Nostradamix
- Göstergeler
- Andrey Kozak
- Sürüm: 1.0
- Etkinleştirmeler: 20
The "Nostradamix" indicator is designed to analyze short-term market movements on lower timeframes (e.g., M1), while simultaneously considering trend direction on higher timeframes (e.g., M30). This tool identifies key trend reversal points, displays volatility levels, and generates buy/sell signals based on market dynamics.
The indicator automatically plots:
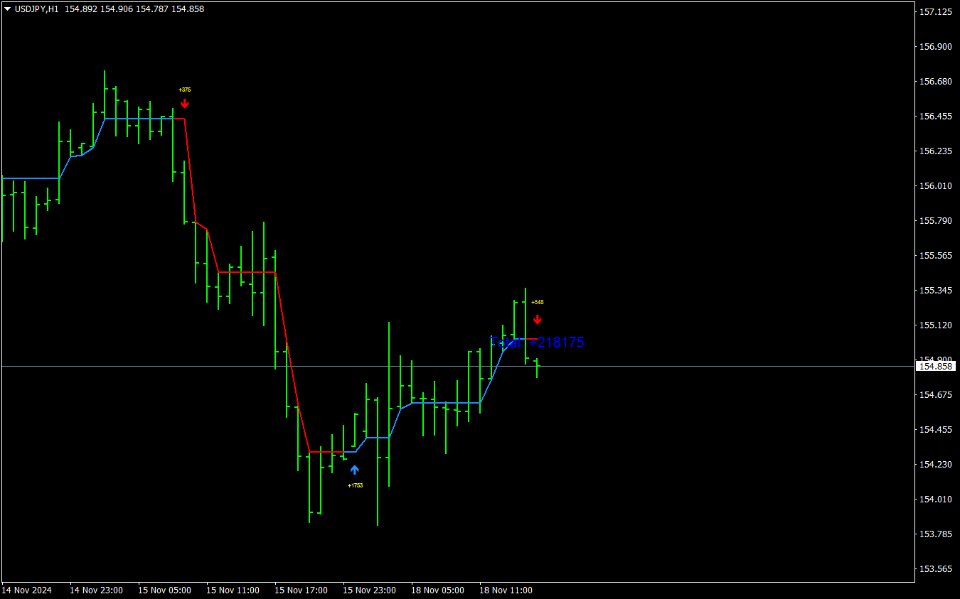
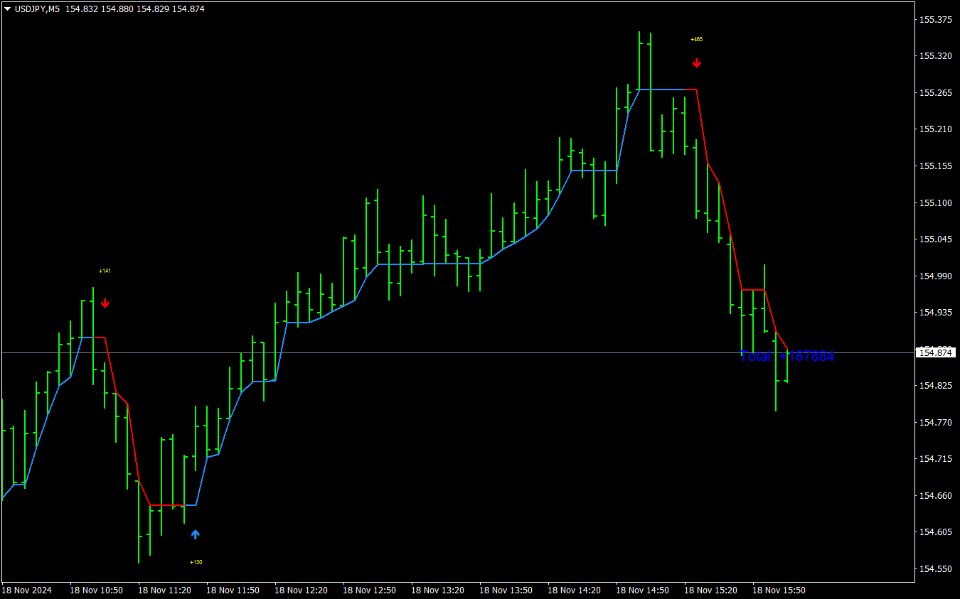
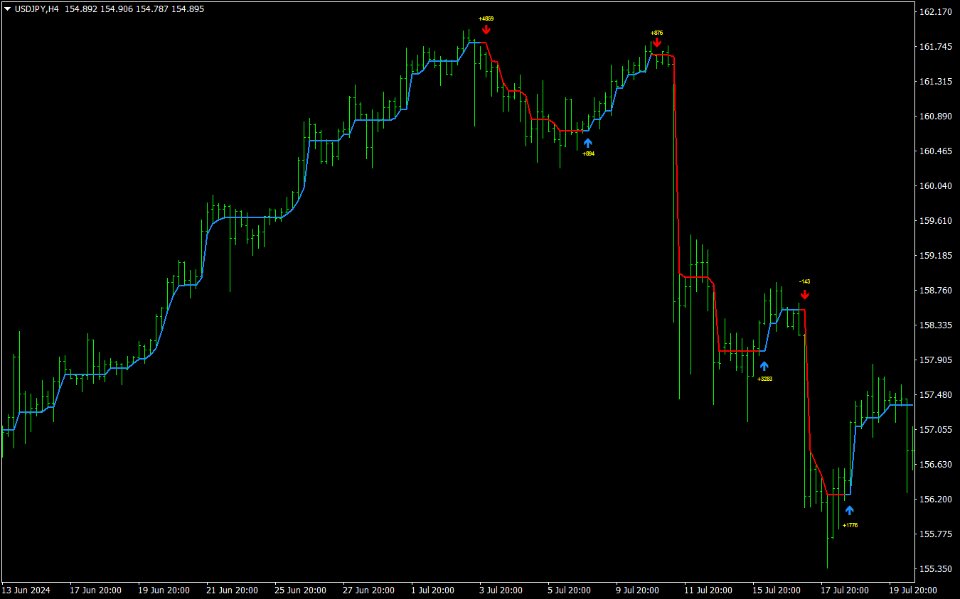
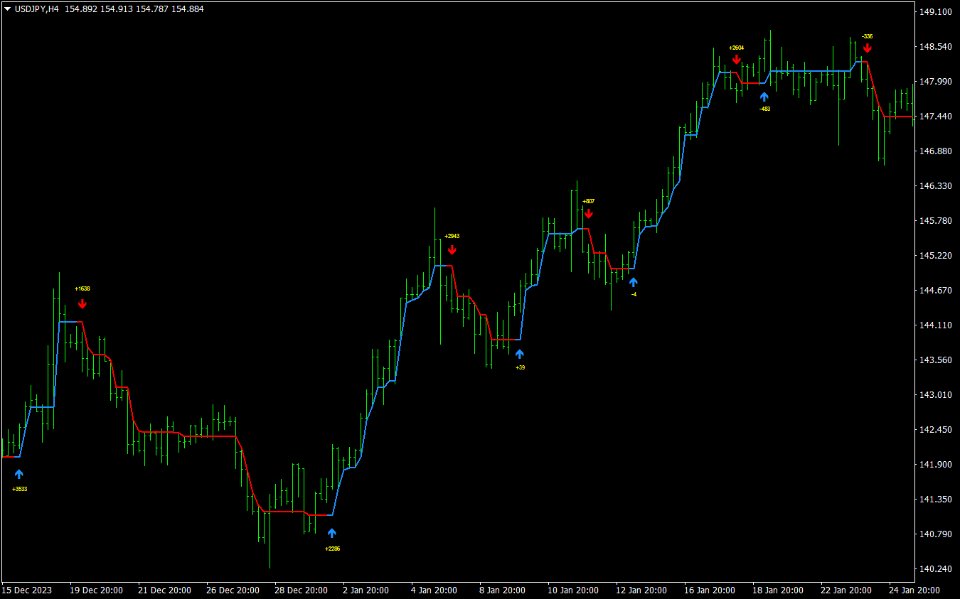
- Current trend lines.
- Volatility bands to assess movement strength.
- Visual markers (arrows) for entry signals.
Forecast Accuracy and Mathematical Justification
The indicator uses a combination of adaptive trend lines and historical volatility analysis to predict potential reversal points:
- Estimated accuracy based on backtesting: ~85–95%, achieved by incorporating volatility filtering to reduce false signals.
- The Average True Range (ATR) method with a smoothing factor is employed to identify market noise effectively.
- On lower timeframes, the indicator can generate approximately 75–115 signals per day, enabling traders to adapt to fast market conditions.
Key Advantages
- Multi-timeframe Approach: Filters short-term signals by considering higher timeframe trends.
- Automatic Volatility Adaptation: The use of ATR helps avoid false signals during sharp price movements.
- Profitability Visualization: Displays potential profits based on historical data.
- Customizable Settings: Parameters can be adjusted to suit individual trading styles.
Example Trading Strategy
Timeframe M1 (with M30 trend analysis):
- Identify the trend direction on M30:
- If M30 shows an uptrend, take buy signals on M1.
- If M30 shows a downtrend, take sell signals on M1.
- Entry conditions:
- Buy: Upward arrow (uptrend signal) at a support level.
- Sell: Downward arrow (downtrend signal) at a resistance level.
- Exit conditions:
- Use volatility levels (channel boundaries) for setting stop-loss and take-profit levels.
- Example: On the M1 chart, an upward arrow appears, confirmed by an uptrend on M30. Open a buy trade with a take-profit target at the nearest volatility band.
Parameter Description
- DisplayProfitMetrics (true/false) — Enable or disable the display of cumulative profit on the chart.
- AnalysisPeriod (int) — Period for trend and volatility analysis.
- ChartOffset (int) — Offset for indicator lines on the chart.
- MaxHistoricalBars (int) — Number of bars used for historical calculations.
- push (true/false) — Send notifications to the mobile app.
- email (true/false) — Send signals via email.
- alert (true/false) — Display popup alerts in the terminal.














Very good indicator! Works extremely well on Gold 1H chart!