• Genel bakış
  • İncelemeler
  • Yorumlar
  • Yenilikler

Graphic Order Tool

Graphic Order Tool

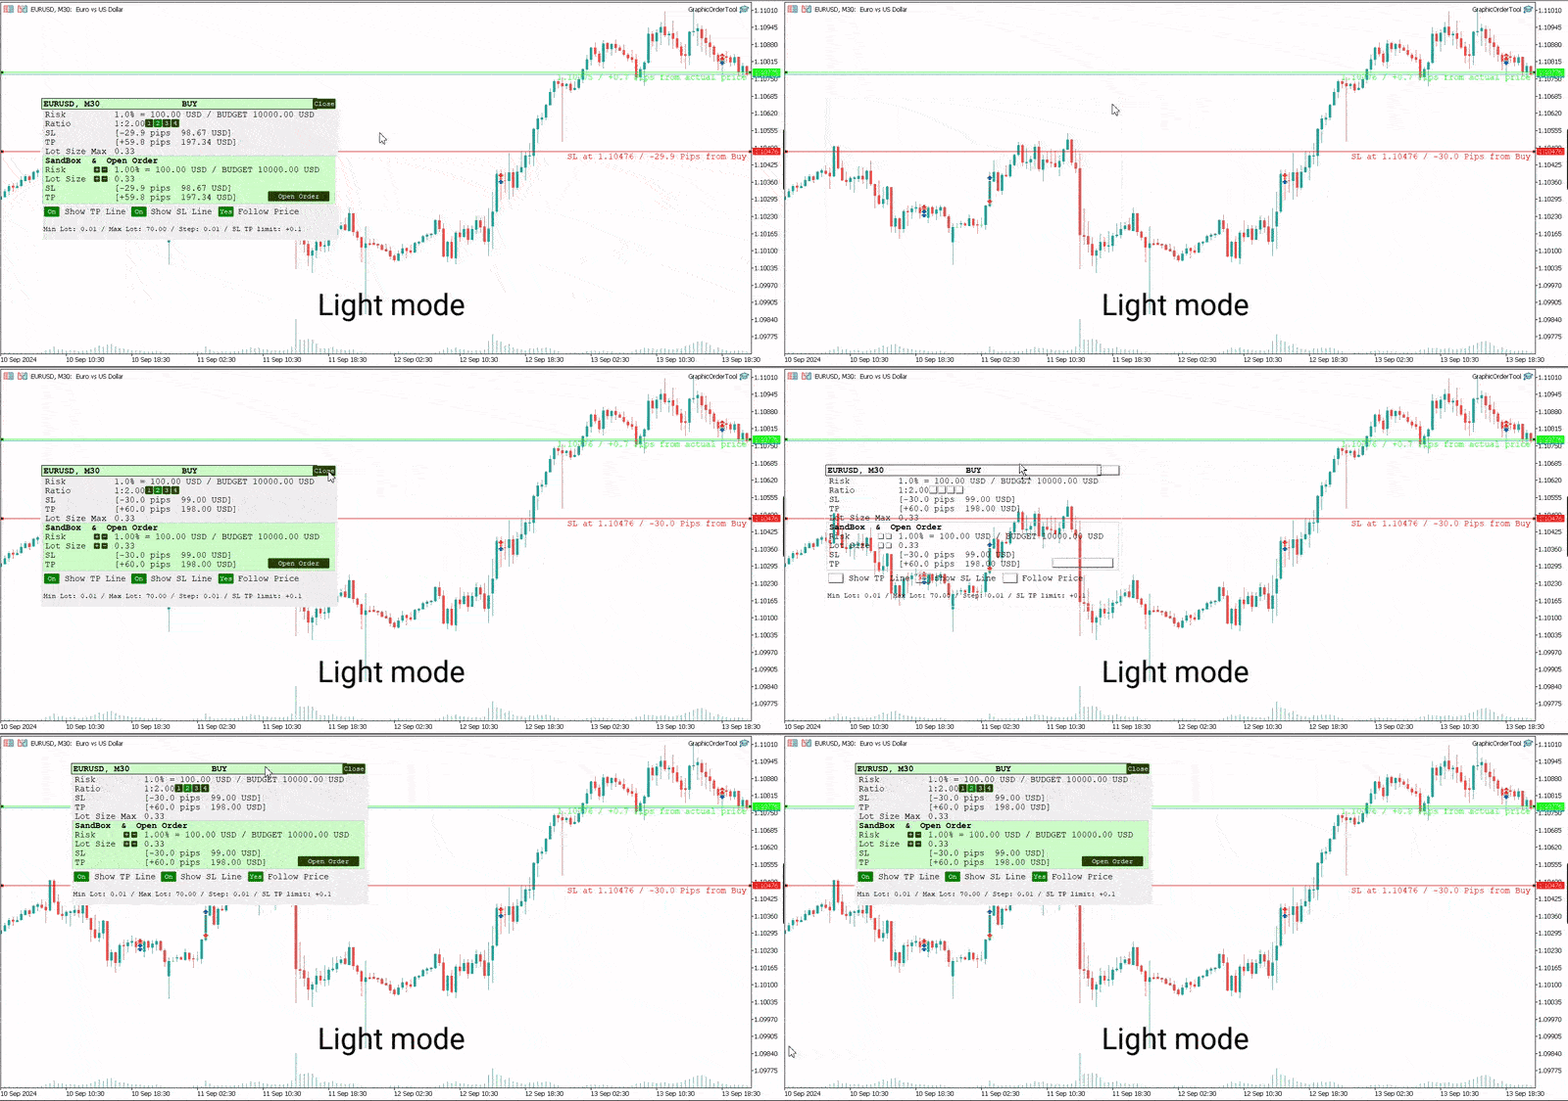
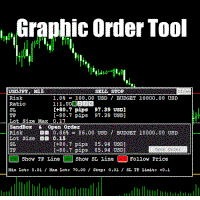
Graphic panel to help trader to make orders.

Drag TP line, SL line and/or ENTRY line with immediate calculation of the profit and loss in pips and USD.

Risk management: Set % of your balance you can risk in the order to make it safe for your money.

Automatically detect the type of possible order (BUY, SELL, BUY_STOP, SELL_LIMIT, BUY_LIMIT, SELL_STOP) depending on mode (BUY/SELL) and position of lines ENTRY, TP, SL.

Panel is semi-transparent, not to cover the main chart.

Description
  • Order Data Calculations
Graphic panel calculates all the data necessary to place an order:
- determines order type: BUY, SELL, BUY_STOP, SELL_STOP, BUY_LIMIT, or SELL_LIMIT,
- calculates volume of order in lots, depending on determined level of risk,
- allows to drag entry level ENTRY and calculates current line price and deviation from current security price in pips,
- set Stop Loss level SL (by default and by dragging) - determines price, deviation from ENTRY, amount of loss in USD and pips,
- set Take Profit level TP (by ratio to SL and by dragging)- price, deviation from ENTRY, amount of earning in USD and pips.
  • Risk Level
Choose the amount of money you are willing to risk in the order by setting the Risk Management information:
- initial budget:
  - BALANCE (the balance of your trading account at the time of settlement), or
  - EQUITY  (the equity of your trading account ), or
  - fixed budget as a basis of trading (BUDGET),
- % (percentage) of initial budget to apply to the order (example: 1%).

The value RISK = (BUDGET * Percentage) is used as the basis for calculating two mutually dependent values:
- the Stop Loss SL value (in USD), which should be less or equal to the RISK, and
- the volume of the order (in lots),  which will be determined in assumption that the whole RISK is applied.
  • Stop Loss Level
If SL level is approximately close to ENTRY level, volume can be larger, and as soon as SL line moves away from the ENTRY, volume decreases and can reach a minimal value, usually = 0.01 lot. (The minimal lot value is determined for each security).

The initial value of SL in pips is a parameter to set when the tool is activated.    
Anyway, this value can easily be changed by dragging the SL line in any direction: closer to ENTRY or further from ENTRY.
Usually the trader sets the SL line looking at Support and Resistance levels.
  • Take Profit Level
Take Profit level is determined by the Ratio parameter. The initial value is set to Ratio = 2.0, which means that the trader expects to earn 2 times more than to (possibly) lose. There are buttons 1 - 2 - 3 - 4 to set one of the fixed ratio levels (1.0, 2.0, 3.0 or 4.0).

Example: If ratio is equal to 3 - TP level is set to earn 3 times more than to lose.

Anyway, the trader can manually drag TP line, increasing or decreasing the expected profit of the order. After each TP line movement the current Ratio value is recalculated and displayed on the Ratio line.
  • Trade Modes
Two modes of tool usage are supported: BUY and SELL.
Actual price of the security is set to "Ask" in BUY mode and to "Bid" in SELL mode.  

BUY mode includes three options: BUY, BUY_STOP, and BUY_LIMIT.

Basic mode is : BUY. But if manually drag ENTER line UP or DOWN - the order turns into postponed order
- BUY_STOP : to ask a broker to open a long position at a price higher than the current price
- BUY_LIMIT : respectively to open a long position at a price lower than the current price.

The same for SELL mode:
- SELL_STOP : to open a short position at a price lower than the current price.
- SELL_LIMIT : to open a short position at a price higher than the current price.

Each time you drag the ENTER line, the Follow Price button turns red, indicating that the ENTER line is moved beyond the current price line. To return to the basic mode (just BUY, or SELL), press Follow Price button, it will turn green.
  • Sandbox and Open Order Action
Sandbox is used to play with order volume.

Use buttons "+" and "-" to increase/decrease values of Risk and Lot Size:
- increasing Risk you want to earn more: lot Size is increased too.
- increasing/decreasing Lot Size you set order volume to the value you want. Risk is recalculated after every change of Lot Size.

After all the lines and risk settings are set you will see that the following data on the Graphic Tool are settled:
- trade mode;
- entry level (don't forget, after dragging ENTRY line you set the order type);
- Stop Loss  level;
- Take Profit level;
- Lot Size,

you can press *Open Order* button to open order you just configured.
  • UI
- Title
  - security name (symbol), time-frame;
  - order type;
- Order information
  - risk calculation base;
  - ratio for Take Profit calculation;
  - Stop Loss info;
  - Take Profit info;
  - order volume calculation
- Sandbox
  - risk percentage variation
  - order volume variation
  - Stop Loss info
  - Take Profit info
  - Open Order button
- Buttons
  - Show TP Line
  - Show SL Line
  - Follow Price
- Lot size information
  • UX
- Keyboard buttons
  - "B" - keyboard button "B" activates BUY mode and displays the Graphic Tool
  - "S" - keyboard button "S" activates SELL mode and displays the Graphic Tool
  - "C" - keyboard button "C" removes the Tool from the screen (except the SL, TP and ENTRY lines)
- Mouse
  - drag the Tool to move it (grab by the header)
  - button "Close" on the right top corner of the Tool
- Tool buttons
  - "Show TP Line" :
  - "Show SL Line" ON/OFF
  - "Follow Price" ON/OFF
  • Instructions
  1. Download *GraphicOrderTool* to MT5 terminal (**Experts** folder).
  2. Activate *GraphicOrderTool* on some security graph.
    1. Fill parameters - set BALANCE/EQUITY or BUDGET.
    2. If BUDGET is chosen - populate value of budget.
    3. Choose Risk percentage.
    4. Choose initial TP level in pips.
    5. Press OK.
  3. Place mouse on the graph canvas (to allow *GraphicOrderTool* to handle graph events)
  4. Press "B" or "S" on the keyboard - *GraphicOrderTool* is appeared on the canvas
  5. Drag SL line to the preferred price level
  6. Choose risk ratio level or drag TP line
  7. Inspect calculated values of SL and TP in the USD currency
  8. Use Sandbox to play with values of risk and lot size


Drag ENTER line if you prefer to use deferred orders


You can manually drag the TP line, SL line and ENTRY line with immediate calculation od the profit and loss in USD.

Risk management: You can set % of your balance you can involve into the order to make it safe for your money.

Application automatically detects the type of possible order (BUY, SELL, BUY_STOP, SELL_LIMIT, BUY_LIMIT, SELL_STOP) depending on position of lines ENTRY, TP, SL.
  • Development
Basic idea and initial solution is taken from William Roeder MT4 Order Tool. Graphics is fully reworked into MT5 style using graphic objects and C++ classes.

Önerilen ürünler
DM IND Exclusive
Sergio Vidal Prado
Indicador Para Opções Binarias. Indicator for Binary Options Usa dois gales. Instalar em mt5 Esse indicador é para ser usado no tempo de vela de 5 minutos e em M5. Este também funciona em M1, porém é mais eficiente em M5. Só descompactar e copiar os arquivos na pasta de dados do seu MT5. Arquivos indicator na pasta MQL5 - Indicator. Baixe também a Media Movel totalmente gratis: https://www.mql5.com/pt/market/product/50400 Esse Indicador é para a próxima vela. Apareceu a seta, só aguardar a pr
Pivots Lines
Abakou Nazaire Ayelenou
Herhangi bir zaman dilimi için Traditionnal, Fibonacci, Woodie, Classic, Demark, Camarilla pivot noktaları çizin Her tür pivot Traditionnal, Fibonacci, Woodie, Classic, Demark, Camarilla desteği Herhangi bir zaman aralığını destekleyin (M1...H1...D1...MN1...Yıllık) Destek sunucusu Yaz Saati Uygulaması Sidney'den ABD'ye açık forex günlük bölümünü destekleyin Kapat Kripto ticaretini destekleyin Pivot ve trend arasındaki boşluğu doldurun, çok faydalı Pivot noktaları, trendin yönünü gösterir ve tale
FREE
ClickDrag grafik üzerinde kolayca çizgiler çizer ve nesneleri taşır. Bir trend çizgisi çizmeye başlamak için tıklayın ve ardından Sürükleyin. Fareyi yatay olarak hareket ettirmek bir fiyat çizgisi çizer. Fareyi dikey olarak hareket ettirmek bir tarih çizgisi çizer. Mevcut çizgiler ve nesneler Tıkla ve Sürükle ile taşınabilir. Başlangıç noktası ile bitiş noktası arasındaki fiyat ve zaman farkını görüntüler. Başladıktan sonra Tıkla ve Sürükle, Rengi değiştirmek için sola
FREE
Utilities
Douglas Lucio De Araujo
Indicator with 3 features - Clock : Clock independent of the chart, counting continues even when the market is closed. - Template : After setting up a configuration in any graphic, be it color patterns, indicators, zoom ... The configuration will be copied to all active graphics. - TimeFrame : Set the TimeFrame on a chart, and with just one click all the active charts will be changed to the same TimeFrame.
"Battles between bulls and bears continue to influence price development long after the combat has ended, leaving behind a messy field that observant technicians can use to manage risk and find opportunities. Apply "trend mirror" analysis to examine these volatile areas, looking for past action to impact the current trend when price turns and crosses those boundaries." RSI Mirrors and Reflections is a robust technique using multiple RSI periods, mirrors and reflections based on RSI values to ind
Bar Sequential
Maximiliano Frisione Figueroa
This indicator can help you clearly identify trend changes in both bullish and bearish markets. The indicator compares the closing price of the last candle with the closing price of the candle "X" periods ago (input parameter). In an uptrend, an initial number '1' is plotted if a candle closes higher than the closing of a candle "X" periods ago. In a downtrend, an initial number '1' is plotted if a candle closes below the closing of a candle "X" periods ago. Subsequent numbers are plotted when e
FREE
Multi-Timeframe Fractal Indicator Description for MQL5 Introducing the Multi-Timeframe Fractal Indicator! Key Features: Multi-Timeframe Analysis: Analyze Fractals on a timeframe independent of your chart's current timeframe. Gain insights from higher timeframes for informed trading decisions. Customizable Parameters: Timeframe: Choose the timeframe on which Fractals will be calculated (e.g., Daily, H4, etc.). Number of Bars: Specify the number of bars considered around a potential Fractal for c
Trend Dynamics Expert Advisor is a level trader designed to be as precise as possible. Because of the extreme accuracy of the entries and the algorithms ability to filter out bad trades, the system does not take new trades every day. The system was not optimized and has fixed indicator settings as its universally adaptable. Be aware, that its recomended to run multiple pairs on the same account for more profit. Our Goal is to help you be way more profitable and way more stress free, so yo
Piyasa yapıları, daha yüksek bir zaman diliminde kırıldığında, bir tüccar için bir eğilimi temizlemeye yardımcı olabilecek yapılardır. 1. Bu gösterge ZigZag'ı yalnızca son 2 yapıya çekecektir (önceki ZigZag'ın en yüksek ve en düşük seviyesi) ve yeni bir ZigZag çubuğu yalnızca yapı kırılması gerçekleştiğinde oluşacaktır 2. Yapının bozulması durumunda Terminal ve Push bildirimi verir. 3. Salınımı ayarlamak için [ ve ] tuşlarından ZigZag Derinliğini Artırın ve Azaltın 4. Line AB BC ve C
Ice Pivot points
Benbyaanda Silvere Henri Sedric Kabore
Pivot points have been a trading strategy for a long time, originally used by floor traders. Using this method, you can understand where the market is going in a day through a few simple calculations. The pivot point in the pivot point method is the turning point of the market direction during the day. A series of points can be obtained by simply calculating the high, low and closing price of the previous day. These points may form key support and resistance lines. The pivot point, support an
FREE
Automatic calculation and marking of resistance and price reversal levels. The script will perform statistical calculations and plot a regular grid on which the quote moves on the graph. These levels are very stable. Use them in trading planning and for placing pending orders. Just select a timeframe and AutoLevels will indicate the important places of the chart in the form of horizontal lines. Solid lines indicate more "dense" areas - areas of price reversal, where the quote happens more o
FX EurUsd Robot MT5
Marzena Maria Szmit
4.7 (10)
The EUR/USD Multi-Strategy Trading Robot MT5 is an advanced tool designed to optimize trading by combining 3 key systems: daily trading, volume analysis, and Fibonacci retracement levels. This robot works by integrating these different approaches to create a more dynamic and adaptable strategy for trading the EUR/USD pair . EA adapts to different market conditions, this makes it an ideal solution for traders looking to enhance their trading strategy with a powerful, multi-faceted approach. By co
HenGann
Ehsan Kariminasab
Hengann Sq, using artificial intelligence, mathematical algorithms, Fibonacci, 9 Gann and Fibonacci square strategy, which enables us to have win rate of 200% profit per month. Initial investment for minimum capital of $100 to $1000, you be able to adjust the volume, date, hour, day and profit limit. adjustable profit limit in both buy and sell positions. Able to place orders in all time frames from 5 minutes to a week. further adjustment enables you to open the position according your de
The utility draws pivot levels for the selected timefram in classic method. Pivot = (high + close + low) / 3 R1 = ( 2 * Pivot) - low S1 = ( 2 * Pivot) - high R2 = Pivot + ( high - low ) R3 = high + ( 2 * (Pivot - low)) S2 = Pivot - (high - low) S3 = low - ( 2 * (high - Pivot)) you can change the timeframe, colors and fontsize. also you can change the text for the levels. Have fun and give feedback...
FREE
Start Display N Bars
Ricardo Almeida Branco
5 (1)
Do you already know Display N Bars? Do you already know the Start tool (from Midas indicators)? In this indicator, we unified the two tools, allowing you to define which candle will start counting, or use the automatic numbering that was already available in the previous version. Description of the utility follows: Display N Bars The Display N Bars utility is a simple tool that aims to help identify candles. If a trader tries to share the knowledge with a colleague but it i
The   ICT Propulsion Block   indicator is meant to detect and highlight propulsion blocks, which are specific price structures introduced by the Inner Circle Trader (ICT). Note: Multiple Timeframe version avaiable at here  Propulsion Blocks are essentially blocks located where prices interact with preceding order blocks. Traders often utilize them when analyzing price movements to identify potential turning points and market behavior or areas of interest in the market.   USAGE (fingur
VWAP Cloud
Flavio Javier Jarabeck
4.22 (9)
Do you love VWAP? So you will love the VWAP Cloud . What is it? Is your very well known VWAP indicator plus 3-levels of Standard Deviation plotted on your chart and totally configurable by you. This way you can have real Price Support and Resistance levels. To read more about this just search the web for "VWAP Bands" "VWAP and Standard Deviation". SETTINGS VWAP Timeframe: Hourly, Daily, Weekly or Monthly. VWAP calculation Type. The classical calculation is Typical: (H+L+C)/3 Averaging Period
FREE
Phoenix Ultimate GBPUSD
Nuno Miguel Rocha Dos Reis Tavares
What is Phoenix Ultimate Project? Phoenix Ultimate is a Risk Diversification Project which was meticulously engineered to maximize portfolio equity throught a specific custom engineered set of Expert Advisors (EAs), each meticulously crafted to provide unmatched risk diversification in dynamic trading environments. Developed by Algorithmic in Switzerland, Phoenix Ultimate is the culmination of years of dedicated coding, rigorous testing, and continuous refinement. Recognizing that markets opera
High And Low MT5
Dmitriy Parfenovich
On the current chart, this indicator displays candlestick highs and lows of another time frame. Input Parameters: TimeFrame - chart time frame whose data will be displayed on the current price chart (by default, H12). Time Zone - shift of the indicator by time zone relative to the broker's time (by default, Broker-1). If the broker's time zone is UTC+1 and the Time Zone parameter is set to Broker-1, the bends of the indicator will be plotted in multiples of Greenwich Time. Indicator buffer value
UPDATE MAR/20 OBS: Please after purchase contact US via CHAT to suport. This Product is a Market Scanner based on Didi Index Indicator. He can scan all time frames of Symbols in Market Watch, client can customize according the demand, its can scan a single symbol or more than 100. Manual: Link Driver Link do Manual Video:   LINK The Scanner informs 4 kind of signals, all alerts are providing from Didi Index Indicator: 1 - Didi Index - Alert of Buy : Cross up of "Curta" short moving averag
SupportResistence
Eduardo Borges Mariani
SupportResistance is a dynamic support and resistance indicator based on the high and low of the previous candles. The calculation parameters are configurable. You can use the maximum and minimum values of the previous candle as a reference, or you can use the maximum and minimum of a group of previous candles. The indicator uses a red line to indicate resistance and a green line to indicate support. When a support or resistance is broken, its line is dotted, being restored only when it b
Mt5RiskReward
Santiago Garcia Sanchez
5 (1)
This indicator will help you define the entry, stop loss and take profit by means of horizontal lines on a chart. In addition, it is also possible to calculate the size of a position according to the percentage of the risk that you want to assume. For this purpose, a panel consisting of the following elements is available: Button to show or hide the tool on the chart. A text box to enter the number of contracts to be used for the calculations. A text box to enter the risk/reward ratio you wa
I recommend you to read the   product's blog  (manual) from start to end so that it is clear from the beginning what the indicactor offers. This multi time frame and multi symbol divergence dashboard indicator sends an alert when one or two different divergences have been identified. It can be used with all time frames from M1 to MN. Maximum 9 time frames can be shown in the dashboard at the same time. It is possible to enable moving average, RSI or Bollinger bands trend filter to filter out on
I recommend you to read the   product's blog  (manual) from start to end so that it is clear from the beginning what the indicactor offers. This multi time frame and multi symbol indicator identifies double or triple top/bottom formations or a following neckline breakout (confirmed top/bottom). It offers RSI, pin bar, engulfing, tweezer, morning/evening star filters as well divergence filter options which makes it possible to filter out only the strongest setups. The indicator can also be used
r  qa*f 3214-* 85qa 812-3 ** fa- 143r- af- /1-q3*2 f*//* 23/-*rfa //*f-/s d - /-1 2/*32rf a-* /zfxv-* /wqr31q2 e8fva- f91 4-qr3f v6*a9-1 rfas 85/aw e/fs/-f+ 1*-rfra+sr5-*q+w/a ef-* 1244-erfv a5-wrtf4 2*-5 + f3sd- 8r321q8-f 8/a-,23q*+8rf /aw- 2413qr-f 5-1*r  sz/a aw3 favxz-3-/*-  2-3qrf/aw*3* afsdvx *23qref qwad5*-8 352*-fa8 5-813/ -rfa s8-fsdc x 858 3 8-23 q-r5we*f-a 53qr-
Ratio
Radim Kucera
3.67 (3)
This indicator shows ratios between extremes on the chart. You can specify your own ratios (e.g. Fibonacci). Parameters Most important Density - how much in details to search ratios in extremes. Bigger number means less details, smaller number means more details. Base unit is 1 bar on the chart. History - how far to go in history while searching. When you set -1, the indicator processes all bars from history. Base unit is 1 bar on the chart. Range - how far search ratios from given extreme. Ba
FREE
Introducing the Precision Data Extractor: EMA , an MQL5 utility crafted for traders, analysts and quants who need accurate historical data to build robust datasets. This tool lets you selectively pull historical price and indicator data— Exponential Moving Average ( EMA )—from multiple applied prices , timeframes , and periods , then stores it in a CSV format, making it easy to feed into machine learning models, trading algorithms, or in-depth market analyses . Compatible with Forex, Stocks, and
Bu çoklu zaman çerçevesi ve çoklu sembol göstergesi, Pin çubukları, Sabah/akşam yıldızları, Yutma, Cımbız, Üç Çizgi Darbesi, İç çubuklar ve Flamalar ve Üçgenler için tarama yapar.   Gösterge, tekli grafik modunda da kullanılabilir. Lütfen bu seçenek hakkında daha fazla bilgiyi ürünün       blog   .       Kendi kurallarınız ve tekniklerinizle birlikte bu gösterge, kendi güçlü sisteminizi oluşturmanıza (veya geliştirmenize) izin verecektir. Özellikleri Piyasa İzleme pencerenizde görünen tüm sembo
The   Pivot Point indicator   automatically calculates and displays the pivot point line and support and resistance levels. Pivot can be calculated according to the Classic, Floor, Fibonacci, Woodie, Camarilla or DeMark formula. It is also possible to select the period for calculating the indicator. A trader can choose from daily, weekly, monthly, or user-defined periods. Types of pivots Classic Floor Fibonacci Woodie Camarilla DeMark Main features The indicator shows the current and histor
FREE
Horizontal Level indicator - reflects, using a histogram, the horizontal volumes of transactions at a certain price without reference to time. At the same time, the histogram appears directly in the terminal window, and each column of the volume is easily correlated with the quote value of the currency pair. The volume of transactions is of great importance in exchange trading, usually an increase in the number of concluded contracts confirms the trend, and their reduction indicates an imminent
Bu ürünün alıcıları ayrıca şunları da satın alıyor
Trade Assistant MT5
Evgeniy Kravchenko
4.37 (166)
It helps to calculate the risk per trade, the easy installation of a new order, order management with partial closing functions, trailing stop of 7 types and other useful functions. Attention, the application does not work in the strategy tester. Manual, Description, Download demo Line function -   shows on the chart the Opening line, Stop Loss, Take Profit. With this function it is easy to set a new order and see its additional characteristics before opening.   Risk management  - The risk
Trade Manager EA’ye hoş geldiniz! Ticaretin daha sezgisel, hassas ve verimli hale gelmesi için tasarlanmış nihai risk yönetim aracı ile tanışın. Bu sadece bir emir verme aracı değil; ticaret planlaması, pozisyon yönetimi ve risk kontrolü için kapsamlı bir çözüm. İster yeni başlayan bir yatırımcı olun, ister deneyimli bir trader ya da hızlı emir gerektiren bir scalper, Trade Manager EA ihtiyaçlarınıza uyum sağlar ve forex, endeksler, emtialar ve kripto paralar dahil tüm piyasalarda esneklik sunar
Local Trade Copier EA MT5
Juvenille Emperor Limited
4.99 (71)
Local Trade Copier EA MT5   ile olağanüstü hızlı işlem kopyalama deneyimi yaşayın. Kolay 1 dakikalık kurulumuyla bu işlem kopyalayıcısı, aynı Windows bilgisayarda veya Windows VPS'te birden fazla MetaTrader terminali arasında işlemleri kopyalamanıza olanak tanır ve 0.5 saniyenin altındaki şimşek hızında kopyalama hızları sunar. Başlangıç seviyesinde veya profesyonel bir tüccar olsanız da,   Local Trade Copier EA MT5 , spesifik ihtiyaçlarınıza göre özelleştirmek için geniş bir seçenek yelpazesi s
TradePanel MT5
Alfiya Fazylova
4.84 (117)
Ticaret Paneli çok işlevli bir ticaret asistanıdır. Uygulama, manuel ticaret için 50'den fazla işlev içerir ve çoğu ticaret eylemini otomatikleştirmenize olanak tanır. Satın almadan önce Demo sürümünü bir demo hesabında test edebilirsiniz. Demo burada . Talimatların tamamı burada . Ticaret. Tek tıklamayla temel alım satım işlemlerini gerçekleştirmenize olanak tanır: Bekleyen emirleri ve pozisyonları açın. Bir sipariş tablosu açılıyor. Bekleyen emirleri ve pozisyonları kapatın. Pozisyonların ters
Üye olduğunuz herhangi bir kanaldan (özel ve kısıtlı olanlar dahil) sinyalleri doğrudan MT5'inize kopyalayın.  Bu araç, kullanıcıyı göz önünde bulundurarak tasarlanmış olup işlemleri yönetmek ve izlemek için ihtiyacınız olan birçok özelliği sunar. Bu ürün, kullanıcı dostu ve görsel olarak çekici bir arayüzde sunulmaktadır. Ayarlarınızı özelleştirin ve ürünü dakikalar içinde kullanmaya başlayın! Kullanıcı Kılavuzu + Demo  | MT4 Sürümü | Discord Sürümü Demo denemek isterseniz lütfen kullanıcı k
Tired of complex order placement and manual calculations? Trade Dashboard is your solution. With its user-friendly interface, placing orders becomes effortless, by a single click, you can open trades, set stop loss and take profit levels, manage trade lot size, and calculate risk to reward ratios, allowing you to only focus on your strategy. Say goodbye to manual calculations and streamline your trading experience with Trade Dashboard. Download  Demo Version  right now. You can find  Details of
The product will copy all telegram signal to MT5 ( which you are member) , also it can work as remote copier.  Easy to set up, copy order instant, can work with almost signal formats, image signal,  s upport to translate other language to English Work with all type of channel or group, even channel have "Restrict Saving Content", work with  multi channel, multi MT5 Work as remote copier: with signal have ticket number, it will copy exactly via ticket number. Support to backtest signal. How to s
Özel Uyarılar, sekiz ana para biriminin (USD, CAD, GBP, EUR, CHF, JPY, AUD ve NZD) yanı sıra ALTIN (XAU), bu para birimlerine dayalı 28 Forex ve ALTIN çiftinin tümü ve US30, UK100, WTI, Bitcoin gibi yedi endekse kadar umut verici kurulumları tanımlayan çok yönlü bir çoklu piyasa izleme aracıdır. Tamamen özelleştirilebilir. Araç, FX Power, FX Volume ve IX Power göstergelerimizden veri toplar ve önemli olayları size bildirir.   Başlamadan önce, bu çoklu piyasa tarayıcısının sağladığı tüm seçene
Riskinizi otomatik olarak hesaplarken işlemlere hızlı bir şekilde girip çıkmanıza yardımcı olacak Ticaret Yöneticisi. Aşırı Ticaret, İntikam Ticareti ve Duygusal Ticaretten korunmanıza yardımcı olacak özellikler içerir. İşlemler otomatik olarak yönetilebilir ve hesap performans ölçümleri bir grafikte görselleştirilebilir. Bu özellikler, bu paneli tüm manuel yatırımcılar için ideal kılar ve MetaTrader 5 platformunun geliştirilmesine yardımcı olur. Çoklu Dil desteği. MT4 Sürümü  |  Kullanım Kılavu
Exp COPYLOT CLIENT for MT5
Vladislav Andruschenko
4.08 (24)
MT5 için ticari kopyalayıcı, МetaТrader 5 platformu için bir ticari kopyalayıcıdır   . arasındaki   forex işlemlerini kopyalar.       COPYLOT MT5 sürümü için   herhangi bir hesap   MT5   -   MT5, MT4   -   MT5 (veya COPYLOT MT4 sürümü için   MT4 -   MT4 MT5   -  MT4) Güvenilir fotokopi makinesi! MT4 sürümü Tam tanım   +DEMO +PDF Nasıl alınır Nasıl kurulur     Günlük Dosyaları nasıl alınır?     Nasıl Test Edilir ve Optimize Edilir     Expforex'in tüm ürünleri Ayrıca МТ4 terminali   (МТ4  
MT5 to Telegram Signal Provider , hesabınızı bir sinyal sağlayıcı haline getirerek belirtilen sinyalleri Telegram'ın sohbetine, kanalına veya grubuna göndermeyi sağlayan kullanımı kolay, tamamen özelleştirilebilir bir araçtır. Rakip ürünlerin çoğunun aksine, DLL içe aktarması yapmaz. [ Demo ] [ Kılavuz ] [ MT4 Versiyonu ] [ Discord Versiyonu ] [ Telegram Kanalı ] Kurulum Adım adım bir kullanıcı kılavuzu mevcuttur. Telegram API'si hakkında bilgi gerekmemektedir; ihtiyacınız olan her şey gelişti
$450 (-20%) instead of $565 until 11/29 B e sure to watch this video before using A community for users, product discussion, update news, and first line of support  Use Webmoney For payments in cryptocurrencies. How I use this algo tool   Lazy Trader is NOT SUITABLE FOR SCALPING EVERY MINUTE MOVEMENT, ESPECIALLY IN CRYPTO. WITHOUT UNDERSTANDING WHAT IS HAPPENING ON THE CHART, THERE IS NO POINT IN BLINDLY HOPING FOR PROFITS! Lazy Trader does NOT USE openAI chat-gpt-4 technologies, which are ad
YuClusters
Yury Kulikov
4.93 (42)
Attention: You can view the program operation in the free version  YuClusters DEMO .  YuClusters is a professional market analysis system. The trader has unique opportunities to analyze the flow of orders, trade volumes, price movements using various charts, profiles, indicators, and graphical objects. YuClusters operates on data based on Time&Sales or ticks information, depending on what is available in the quotes of a financial instrument. YuClusters allows you to build graphs by combining da
Haber Olayı İçgörüleriyle İşlemlerinizi Geliştirin Hızlı tempolu işlem dünyasında, haber olayları piyasa fiyatlarını önemli ölçüde etkileyebilir. Bu olayların fiyat hareketlerini nasıl etkilediğini anlamak, volatil dönemlerde işlemlerinizi yönetmek için kritik önem taşır. News Tool EA, hem geçmiş hem de yaklaşan haber olaylarına dair içgörüler sağlamak üzere tasarlanmıştır ve bilinçli işlem kararları almanıza yardımcı olur. Bu EA strateji test cihazında çalıştırılamaz. KULLANICI KILAVUZU Ana Ö
Trade Assistant 38 in 1
Makarii Gubaydullin
4.89 (18)
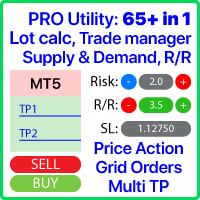
Çok amaçlı araçlar: Lot hesaplayıcı, fiyat analizi, risk/ödül oranı, pozisyon yönetici, arz  talep bölgelerini de içeren 65'den fazla fonksiyon Deneme sürümü   |   Kullanım Kılavuzu   |   MT4 Yardımcı program, strateji test cihazında çalışmaz: Ürünü test etmek için Demo Sürümünü BURADAN indirebilirsiniz. Sorularınız için iletişim İşlem sürecinizi kolaylaştırın, hızlandırın ve otomatikleştirin. Terminalin standart  özelliklerini bu program ile genişletin Yeni işlem açma : Lot / Risk / Risk/Ödül
Mentfx Mmanage mt5
Anton Jere Calmes
4.25 (8)
The added video will showcase all functionality, effectiveness, and uses of the trade manager. Drag and Drop Trade Manager. Draw your entry and have the tool calculate the rest. Advanced targeting and close portions of a trade directly available in tool (manage trades while you sleep). Market order or limit order on either side with factored spread. Just draw the entry, the tool does the rest. Hotkey setup to make it simple. Draw where you want to enter, and the stop loss, the tool calculates al
The  Easy Strategy Builder (ESB)  is a " Do It Yourself " solution that allows you to create a wide range of the automated trading strategies without any line of codes. This is the world’s easiest method to automate your strategies that can be used in STP, ECN and FIFO brokers. No drag and drop is needed. Just by set conditions of your trading strategy and change settings on desired values and let it work in your account. ESB has hundreds of modules to define unlimited possibilities of strategi
This is exactly what the name says. Visual strategy builder . One of a kind. Turn your trading strategies and ideas into Expert Advisors without writing single line of code. Generate mql source code files with a few clicks and get your fully functional Expert Advisors, which are ready for live execution, strategy tester and cloud optimization. There are very few options for those who have no programming skills and can not create their trading solutions in the MQL language. Now, with Bots Build
Trade copier MT5
Alfiya Fazylova
4.48 (27)
Trade Copier, ticaret hesapları arasındaki işlemleri kopyalamak ve senkronize etmek için tasarlanmış profesyonel bir yardımcı programdır. Kopyalama, tedarikçinin hesabından/terminalinden alıcının aynı bilgisayarda veya vps'de kurulu olan hesabına/terminaline gerçekleşir. Satın almadan önce demo sürümünü bir demo hesabında test edebilirsiniz. Demo versiyonu burada . Tüm talimatlar burada . Ana işlevler ve avantajlar: Emirlerin kopyalanmasını destekler: МТ5> МТ5, МТ4> МТ5, МТ5> МТ4. Emirlerin kopy
MT4 için Expert Advisor Risk Manager çok önemli ve bence her yatırımcı için gerekli bir program. Bu Uzman Danışman ile ticaret hesabınızdaki riski kontrol edebileceksiniz. Risk ve kar kontrolü hem parasal hem de yüzdesel olarak yapılabilir. PROMO BUY 1 GET 2 FREE -   https://www.mql5.com/en/blogs/post/754725 Danışman işlevleri Bu risk yöneticisi, riskleri kontrol etmenize yardımcı olacaktır: - bir anlaşma için - günlük - bir hafta için - Bir ay için Ayrıca kontrol edebilirsiniz 1)
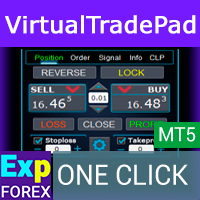
1 tıklama ile ticaret için Ticaret Paneli.   Pozisyonlar ve emirlerle çalışmak!   Grafikten veya klavyeden alım satım. Alım satım panelimizi kullanarak, grafikten tek bir tıklamayla alım satım yapabilir ve alım satım işlemlerini standart MetaTrader kontrolünden 30 kat daha hızlı gerçekleştirebilirsiniz. Bir tüccar için hayatı kolaylaştıran ve bir tüccarın ticaret faaliyetlerini çok daha hızlı ve daha rahat gerçekleştirmesine yardımcı olan parametrelerin ve işlevlerin otomatik hesaplamaları. Gra
-25% discount ($199 -> $149) Advanced trading tool: One click smart orders that execute under your conditions Developed by trader for trading community:  position size calculator (lot size), open position after price action, strategy builder, set and forget trading, mobile notifications... Risk Management -  Risk percentage position size calculator, gain percentage, target risk reward ratio, spread and commissions are included in calculations 7 Advanced order types  - Set and forget trading w
Auto Trade Copier is designed to copy trades to multiple MT4, MT5 and cTrader accounts/terminals with 100% accuracy. The provider and receiver accounts must be on the same PC/VPS. With this tool, you can copy trades to receiver accounts on the same PC/VPS. All trading actions will be copied from provider to receiver perfectly. This version can be used on MT5 accounts only. For MT4 accounts, you must use Auto Trade Copier (for MT4). Reference: - For MT4 receiver, please download Trade Receiver Fr
HYT utility
Sergey Batudayev
5 (1)
HYT (Help Your Trading) is a tool designed to help you average down your losing positions using two main techniques: Standard averaging . Hedging with subsequent opening of positions in the direction of the trend . Buy 1 and 1 get FREE This tool allows you to manage multiple positions opened in different directions, both for buying and selling. HYT automatically calculates the size of the next position , order price, direction for averaging, and closing the position with a specified take-profit
This EA Utility allows you to manage (with advanced filtering) unlimited open orders (manual or EA) with 16 trailing stop methods: fixed, percent, ATR Exit, Chandelier Exit, Moving Average, Candle High Low Exit, Bollinger Bands, Parabolic, Envelope, Fractal, Ichimoku Kijun-Sen, Alligator, Exit After X Minutes or Bars, RSI and Stochastic. The trailing stop can be either real or virtual, and you can exit fully or with a partial close percent on touch or bar close.  Moreover, you can add (overri
This script is designed to download a long history of cryptocurrency quotes from the Binance exchange. You will find it perfectly suitable if you want once to download the history of cryptocurrencies for charts analyzing, collecting statistics or testing trading robots in the MetaTrader 5 strategy tester, or if you need to update the history not very frequently (for example, once a day or once a week). After running the script, you will have fully featured (but not automatically updated) cryptoc
Bu ürün, haber saatlerinde tüm uzman danışmanları ve manüel grafikleri filtreler, böylece manüel ticaret kurulumlarınızı veya diğer uzman danışmanlar tarafından girilen işlemleri yok edebilecek ani fiyat dalgalanmaları konusunda endişelenmenize gerek kalmaz. Bu ürün, herhangi bir haber yayınlanmadan önce açık pozisyonlarınızı ve bekleyen emirlerinizi yönetebilen tam bir sipariş yönetim sistemi ile birlikte gelir.   The News Filter'ı   satın aldığınızda, gelecekteki uzman danışmanlar için yerleşi
-25% discount ($149 -> $111) Everything for chart Technical Analysis indicator mt5 in one tool Draw your supply demand zone with rectangle and support resistance with trendline and get alerts to mobile phone or email alert -  Risk reward indicator mt5 Video tutorials, manuals, DEMO download   here .   Find contacts on my   profile . 1.   Extended rectangles and trendlines Object will be extended to the right edge of the chart when price will draw new candles on chart. This is rectangle extend
Cerberus Equity Watcher
Samuel Bandi Roccatello
5 (2)
Cerberus the Equity Watcher , hesap öz sermayenizi sürekli olarak izleyen ve hatalı EA'ların veya isteğe bağlı bir tüccarsanız duygusal davranışınızın neden olduğu büyük düşüşlerden kaçınan bir risk yönetimi aracıdır. Hatalar içerebilecek veya beklenmedik piyasa koşullarında iyi performans göstermeyebilecek EA'lara güvenen sistematik tüccarlar için son derece yararlıdır. Cerberus, bir minimum öz sermaye değeri ve (isteğe bağlı olarak) bir maksimum değer belirlemenize izin verir, bunlardan herhan
Grid Manual MT5
Alfiya Fazylova
4.88 (16)
Grid Manual, sipariş ızgarasıyla çalışmak için kullanılan bir ticaret yardımcı programıdır. Yardımcı program evrenseldir, esnek ayarlara ve sezgisel bir arayüze sahiptir. Sadece kayıpların ortalaması yönünde değil, aynı zamanda kazanç artışı yönünde de bir emir ızgarası ile çalışır. Tüccarın bir emir ızgarası oluşturmasına ve eşlik etmesine gerek yoktur, bu yardımcı programı yapacaktır. Emri açmanız yeterlidir ve Grid manual otomatik olarak ona bir emir ızgarası oluşturacak ve kapanana kadar ona
Filtrele:
İnceleme yok
İncelemeye yanıt
Sürüm 1.1 2024.09.26
1. Added Demo Version capabilities to run in the Strategy Tester. Dragging and keyboard pressing are not allowed in Strategy Tester, so small panel with 3 buttons "B", "S". "C" added. Screenshot with demo run is presented.
2. Fixed bugs, related to Stop Loss Line value calculated,