• Genel bakış
  • İncelemeler
  • Yorumlar

TradingSessionVisualizer

Before diving into the features of this indicator, please rate this product, leave a comment to share your experience, and subscribe to my page to stay updated on the latest releases and tools. Your support is valuable and helps me continuously improve my creations!

Description:

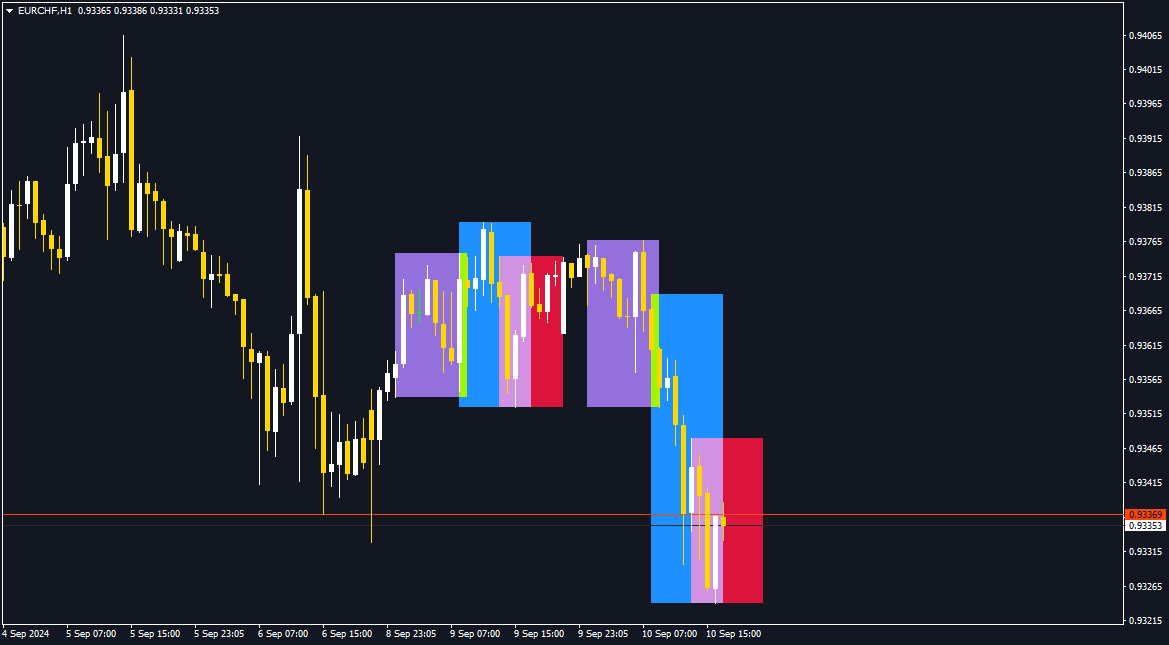
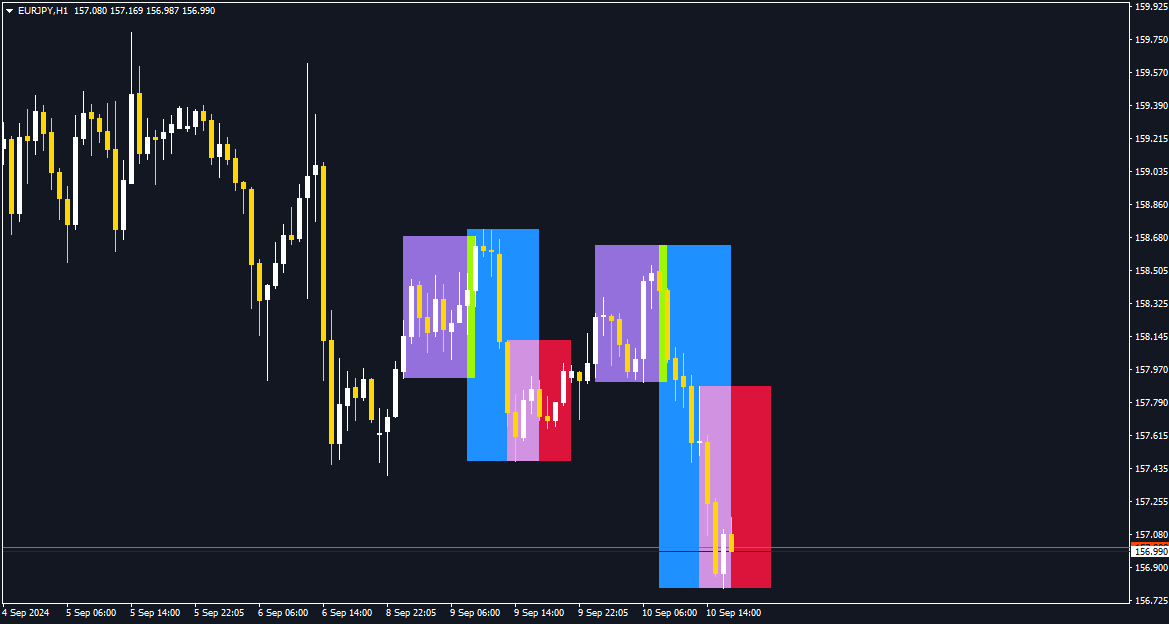
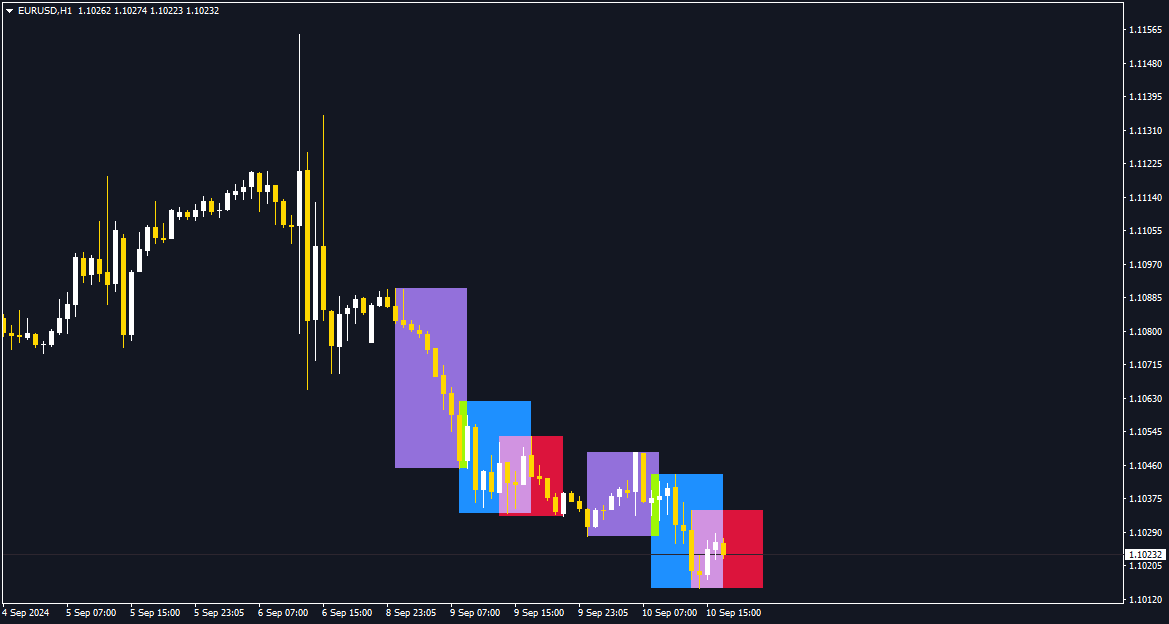
The TradingSessionVisualizer is a powerful MetaTrader 4 indicator designed to provide a clear and customizable visualization of major trading sessions on your charts. This tool allows you to easily distinguish between Asian, London, and New York trading sessions, helping you better understand market movements during these key periods.

Key Features:

  • Trading Session Display: Clearly visualize Asian, London, and New York trading sessions with colored rectangles on your chart.
  • Customizable Parameters: Adjust colors, line width, and whether to fill the rectangles for each session.
  • Dynamic Display: The indicator automatically adjusts based on the number of days you choose to display (up to 3 days).
  • Easy Management: Efficiently handles graphic objects, removing old ones and updating new ones.

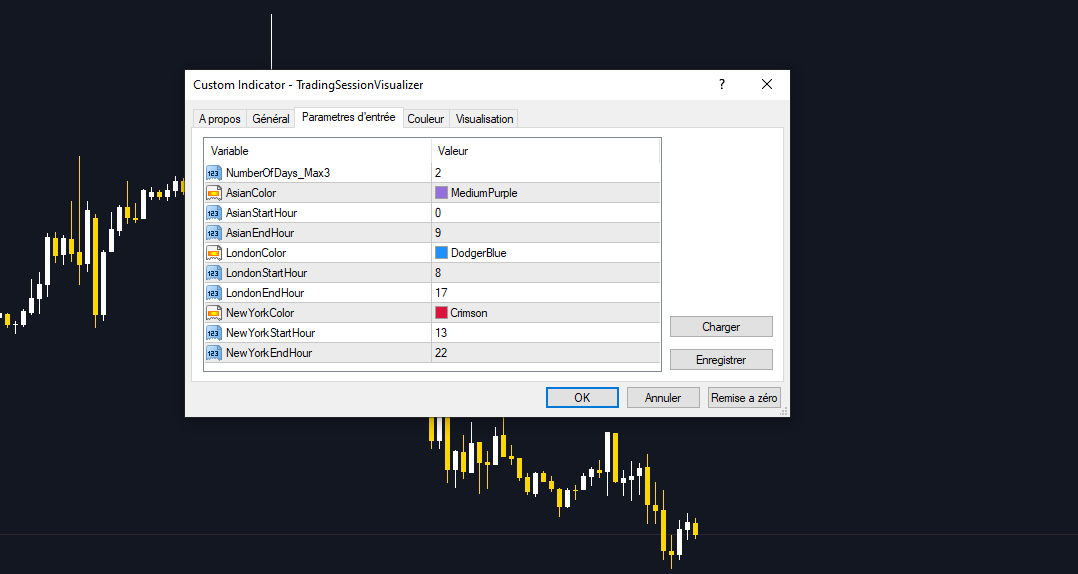
Indicator Parameters:

  • Number of Days: Display sessions for up to 3 days.
  • Color and Style: Customize session colors and rectangle border styles.
  • Rectangle Fill: Choose whether rectangles should be filled or only show borders.

How to Use:

  1. Installation: Download and install the indicator in the MetaTrader 4 indicators folder.
  2. Configuration: Adjust the parameters to your preferences directly in the indicator’s settings panel.
  3. Analysis: Observe trading sessions on your chart for better decision-making.

Feel free to explore the features and adjust the settings to make the most out of your market analysis. Thank you for your support and happy trading!


Önerilen ürünler
CandlePips
Yawo Julio K Kavege Atileh
This indicator works on this way: Trader should provided the n period "Number of Candle" ( the default period is 6) Then the indicator  will calculate the number of pips in the last n period  (not the current candle) And that is display on the chart With that the should confirmed his up trend or down trend analyse according to the number of pips in the last  n candles( bullish or bearish) he has provided
FREE
MASi Wave Histogram
Aleksey Terentev
5 (1)
This is an implementation of the market cycle indicator described by Raghee Horner in the book "Forex Trading for Maximum Profit" . The current state of the market can be determined by analyzing the inclination angle of the exponential moving average (EMA) running on a period of 34 bars. If the EMA inclination is defined as the direction of the hour hand on the dial from 12 to 2 hours, then an uptrend is considered to be present; from 2 to 4 hours, the market consolidates; from 4 to 6 hours, a d
FREE
It is a custom non-repaint indicator to identify trade opportunities in swing action as prices move within an upper and lower band. Inspired by the Keltner Channel, the most popular channel Indicator introduced by Chester Keltner. It is different with a Bollinger Bands. It represents volatility using the high and low prices, while Bollinger's studies rely on the standard deviation. The algorithm for this indicator is also available in the EntryMaximator EA. Including the option to use it or not.
FREE
Growing Bands Sh
Nikolay Likhovid
3 (2)
Do you use dynamic ranges (like Bollinger Bands or Envelopes) in your trading? A fixed period is usually used for such calculations. But is such approach relevant to the very nature of the market? In fact, the price chart consists of a series of successive processes - trends and flats. In this case, we can talk about the internal development logic inside a single process only. Therefore, the nature of the market is better described by dynamic ranges designed for the processes occurring "here and
FREE
Ratio market
Aleksandr Krokhalev
4.29 (14)
Volatility under control. The indicator shows the optimal depth for setting goals within the day and on the average trend. It also builds pivot zones for the estimated correction depth. As an accompaniment, the key levels of the structure are displayed for several timeframes. Classical volatility indicators ATR & ADX on fixed timeframes are used for calculation. The calculation takes into account the spread, and if the market is slightly volatile, you will see a warning about the risk. You can c
FREE
MASi Three Screens
Aleksey Terentev
5 (2)
MASi Three Screens is based on the trading strategy by Dr. Alexander Elder. This indicator is a collection of algorithms. Algorithms are based on the analysis of charts of several timeframes. You can apply any of the provided algorithms. List of versions of algorithms:     ThreeScreens v1.0 - A simple implementation, with analysis of the MACD line;     ThreeScreens v1.1 - A simple implementation, with analysis of the MACD histogram;     ThreeScreens v1.2 - Combines the first two algorithms
FREE
XOATRHIST
Ainur Sharipov
4.83 (6)
This is one of my first indicators. Slightly improved. The indicator is based on point and figure chart, but their period is equal to ATR indicator values. Parameters: ATRPeriod - ATR period for calculation of steps. XOPips - manual pararmetr, ATR ignoring. Note: The indicator uses closes price, thus it is recommended to consider completed bars. There is a more visual, with the display of lines on the chart and alerts, paid version of XOatrline
FREE
This robot is equipped with trend-following logic. Specifically, it detects trends using the Parabolic Indicator and identifies when prices move significantly compared to normal fluctuations. You can input a desired number of pips (Price GAP pips) to determine at what price fluctuation the entry should occur. In case the trend reverses, all open orders will be closed. The number of simultaneous orders you can hold is customizable. Additionally, if you have multiple orders, they will all close o
FREE
AngDistPer
Vasiliy Anokhin
The oscillator indicator " AngDistPer " is one of a series of three calculators of the angular deviation of the price chart of a trading instrument. INPUT PARAMETER: DRAWs =128 - Number of bars to display the indicator in the chart history; DistPER =14 - calculation period of the indicator in the number of bars. The values of the indicator indicators are degrees . The presence of a Strong price Movement begins with a value of +-45 degrees, and can not exceed +-90 degrees. A Good Trading R
FREE
JAngleR
Vasiliy Anokhin
The oscillator indicator " JAngleR " is one of a series of three calculators of the angular deviation of the price chart of a trading instrument. INPUT PARAMETER: DRAWs =128 - Number of bars to display the indicator in the chart history; Period_IND =14 - calculation period of the indicator in the number of bars; ma_period =1 - Moving Average Period; ma_method =MODE_SMA - moving Method; applied_price =PRICE_CLOSE - applied Moving Average Price. The values of the indicator indicators are degree
FREE
The oscillator indicator " AnglerSPeriod " is one of a series of three calculators of the angular deviation of the price chart of a trading instrument. INPUT PARAMETER: DRAWs =128 - Number of bars to display the indicator in the chart history; PeriodIND =14 - calculation period of the indicator in the number of bars. The values of the indicator indicators are degrees . The presence of a Strong price Movement begins with a value of +-45 degrees, and can not exceed +-90 degrees. A Good Tradin
FREE
For more info,  questions   and problems join to discord.gg/reitakfx Very informative and detailed tool for your account.  - pairs, number of trades, lot size, profit, lose, nett p/l, net pips - profit growth chart Instalation : - open chart and delete every other indicator on it - put this report on chart Setting : - magic number - filters (comment, symbols, currencies) - date (today, week, month custom) - Start / End date (this is for custom date) - report type (open - only active trades
FREE
MACD Scanner With Alerts
Niravkumar Maganbhai Patel
4 (2)
MACD Dashboard Panel   This indicator helps you to scan symbols which are in the Market Watch window and filter out a trend according to MACD. Moving Average Convergence Divergence (MACD) is a trend-following momentum indicator that shows the relationship between two moving averages of a security’s price. The MACD is calculated by subtracting the 26-period Exponential Moving Average (EMA) from the 12-period EMA. The result of that calculation is the MACD line. A nine-day EMA of the MACD call
FREE
Super trend is one of the best trend indicators in metatrader 4 (MT4). Triple SuperTrend indicator is an indicator that consist of three super trend indicator that can be aranged. This indicator is built by mql4 language and doesn't provided by MT4 platform. Highly recommended using EMA SuperTrend Strategy Indicator if you want to get better result in here: https://www.mql5.com/en/market/product/91664 This indicator is easy to use, power full and has many benefits, there are: Using three ind
FREE
SRFactor
Aleksandr Teleguz
5 (2)
This indicator identifies short-term, medium-term and long-term highs and lows of the market according to the method described by Larry Williams in the book "Long-term secrets to short-term trading". Brief description of the principle of identifying the market highs and lows A short-term high is a high of a bar with lower highs on either side of it, and, conversely, a short-term low of a bar is a low with higher lows on either side of it. Medium-term highs and lows are determined similarly: a
FREE
This indicator uses a different approach from the previous version to get it's trendlines. This method is derived from Orchard Forex, and the process of making the indicator is demonstrated in there video   https://www.youtube.com/watch?v=mEaiurw56wY&t=1425s . The basic idea behind this indicator is it draws a   tangent line   on the highest levels and lowest levels of the bars used for calculation, while ensuring that the lines don't intersect with the bars in review (alittle confusing? I kno
FREE
Full VWAP MT4
Alexandre Borela
4.79 (28)
Bu projeyi seviyorsanız, 5 yıldız incelemesi bırakın. instagram'da izleyin: borelatech Volume-weighted ortalama fiyat, toplam hacim hacmine yapılan değerin oranıdır Belirli bir zaman ufuk üzerinde ticaret yaptı. Ortalama fiyatın bir ölçüsüdür. Bir stoğun ticaret ufkunun üzerinde ticaret yapılır. VWAP sık sık sık kullanılır Ticaret kriteri, mümkün olduğunca pasif olmayı amaçlayan yatırımcılar tarafından infaz. Bu gösterge ile VWAP'ı şimdilik çizebilirsiniz: Mevcut gün. Hafta. Şimdi Ay. Şimdik
FREE
MASi Wave
Aleksey Terentev
5 (7)
This is an implementation of the market cycle indicator described by Raghee Horner in the book "Forex Trading for Maximum Profit" . The current state of the market can be determined by analyzing the inclination angle of the exponential moving average (EMA) running on a period of 34 bars. If the EMA inclination is defined as the direction of the hour hand on the dial from 12 to 2 hours, then an uptrend is considered to be present; from 2 to 4 hours, the market consolidates; from 4 to 6 hours, a d
FREE
Very usefull expert advisor for ichimoku kinko hyo indicator. this expert advisor will notify you whenever there is a cross over/below the clouds or tenken sen  /kijun crossing. All Ichimoku traders know the importance and valuable signals when crosses done below or above the clouds or tenkan and kijun crosses. Now you will be alerted quickly to make benefits from the markets This will help you to be alerted for possible trade action. it will simplify your chart observation and be notified wtith
FREE
Mini Charts
Sergey Efimenko
4.75 (8)
Gösterge, herhangi bir zaman diliminden herhangi bir sembolün küçültülmüş grafiklerini görüntüler. Maksimum görüntülenen çizelge sayısı 28'dir. Çizelgeler hem ana hem de alt pencerede yer alabilir. İki görüntüleme modu: mumlar ve çubuklar. Görüntülenen veri miktarı (çubuklar ve mumlar) ve grafik boyutları ayarlanabilir. Parametreler: Corner - başlangıç köşesini göster (listeden seçilir) CandleMode - görüntüleme modu: true - mumlar, false - çubuklar ShowLastBid - son fiyat gösterimini etkinleştir
FREE
Parabolic SAR extreme When the Parabolic SAR value indicates an uptrend or downtrend, the EA will open a buy or sell trade respectively, given that all other criteria are met This EA allows you to set up to 21 separate Parabolic SAR  criteria for the EA to work on  There are 3 input parameter sets (SAR1, SAR2, and SAR3) Each set allows you to determine the parameters (such as the step and max step) for each set And within each set, you get to indicate up to 7 timeframe for the EA to operate in
FREE
Trend Z MT4
Claudia Ramona Angerer
Hypothetical trend line display Distance from the trend line Can be used in all symbols Can be used in all time frames An interesting indicator for predicting small waves The greater the distance from the trend line, the more likely it is to return to the trend line Settings: The first three(osic 1,2,3): are the same as the settings of the zigzag indicator The bigger these numbers are, the bigger the trend lines and the longer the trend Back Show: The number of candles displayed
FREE
Basic Harmonic Pattern
Mehran Sepah Mansoor
4.56 (50)
Bu gösterge, piyasanın tersine dönme noktalarını tahmin eden en popüler Harmonik Kalıpları tanımlar. Bu harmonik modeller, forex piyasasında sürekli tekrar eden ve gelecekteki olası fiyat hareketlerini öneren fiyat oluşumlarıdır / Ücretsiz MT5 Sürümü Buna ek olarak, bu gösterge yerleşik bir piyasaya giriş sinyalinin yanı sıra çeşitli kar alma ve zararı durdurma sinyallerine de sahiptir. Harmonik formasyon göstergesi kendi başına al/sat sinyalleri sağlayabilse de, bu sinyallerin diğer teknik g
FREE
Follow The Line
Oliver Gideon Amofa Appiah
4.07 (14)
FOLLOW THE LINE GET THE FULL VERSION HERE: https://www.mql5.com/en/market/product/36024 This indicator obeys the popular maxim that: "THE TREND IS YOUR FRIEND" It paints a GREEN line for BUY and also paints a RED line for SELL.  It gives alarms and alerts of all kinds. IT DOES NOT REPAINT and can be used for all currency pairs and timeframes. Yes, as easy and simple as that. Even a newbie can use it to make great and reliable trades. NB: For best results, get my other premium indicators for more
FREE
Free automatic Fibonacci is an indicator that automatically plots a Fibonacci retracement based on the number of bars you select on the BarsToScan setting in the indicator. The Fibonacci is automatically updated in real time as new highest and lowest values appears amongst the selected bars. You can select which level values to be displayed in the indicator settings. You can also select the color of the levels thus enabling the trader to be able to attach the indicator several times with differe
FREE
Magneto Breakdown
Vladimir Blednov
5 (1)
Полная версия индикатора находится здесь . Индикатор предназначен для торговли внутри дня. Строит канал по пробою крайних уровней которого вы можете открывать ордер на покупку или продажу. Во флетовом рынке работа ведётся на отбой от этих уровней. Для фильтрации входов используется цветная гибридная скользящая средняя. Настройки по умолчанию предназначены для терминального времени GMT +3 (подходит для большинства брокеров) и для терминалов с пятизначными котировками. Индикация канала и уровней
FREE
Market Profile 3
Hussien Abdeltwab Hussien Ryad
3 (2)
Market Profile 3 MetaTrader 4 indicator  — is a classic Market Profile implementation that can show the price density over time, outlining the most important price levels, value area, and control value of a given trading session. This indicator can be attached to timeframes between M1 and D1 and will show the Market Profile for daily, weekly, monthly, or even intraday sessions. Lower timeframes offer higher precision. Higher timeframes are recommended for better visibility. It is also possible t
FREE
TrendLine PRO MT4
Evgenii Aksenov
4.79 (233)
Trend Line PRO göstergesi bağımsız bir ticaret stratejisidir. Trend değişimini, ticarete giriş noktasını gösterir ve ayrıca Take Profit'in üç seviyesini ve Stop Loss'a karşı korumayı otomatik olarak hesaplar Trend Line PRO, tüm Meta Trader sembolleri için idealdir: para birimleri, metaller, kripto para birimleri, hisse senetleri ve endeksler Gerçek hesapların izlenmesi: burada    gösterge için danışmanlar: burada      Scanner Trend Line Pro'yu   ücretsiz almak için göstergeyi satın aldıktan s
FREE
Trend Yakalayıcı: Alarm İndikatörü ile Trend Yakalayıcı Stratejisi, piyasa trendlerini ve potansiyel giriş ve çıkış noktalarını belirlemede yardımcı olan çok yönlü bir teknik analiz aracıdır. Piyasa koşullarına uyum sağlayarak trend yönünün net görsel temsili için dinamik bir Trend Yakalayıcı Stratejisi sunar. Tüccarlar tercihlerine ve risk toleranslarına göre parametreleri özelleştirebilirler. Gösterge, trendleri tanımlamaya yardımcı olur, potansiyel ters dönüşleri sinyaller, trailing stop m
FREE
(Google Çeviri) Bu gösterge, John Welles Wilder'ın ortalama gerçek aralığından (ATR) esinlenmiştir, ancak bazı ek bilgiler içermektedir. Benzer şekilde, gerçek aralığın üstel hareketli ortalamasını hesaplar, ancak Wilder yerine standart alfa ağırlığını kullanır. Ayrıca, aralık ortalamasının ortalama sapmasını da hesaplar ve bunu bir sapma olarak görüntüler. Bu, yalnızca bir değişikliği daha hızlı belirlemeye değil, aynı zamanda etkisini de belirlemeye yardımcı olur. (Original text) This indicato
FREE
Bu ürünün alıcıları ayrıca şunları da satın alıyor
Gann Made Easy
Oleg Rodin
4.85 (80)
Gann Made Easy , bay teorisini kullanarak ticaretin en iyi ilkelerine dayanan, profesyonel ve kullanımı kolay bir Forex ticaret sistemidir. WD Gann. Gösterge, Zararı Durdur ve Kâr Al Seviyeleri dahil olmak üzere doğru SATIN AL ve SAT sinyalleri sağlar. PUSH bildirimlerini kullanarak hareket halindeyken bile işlem yapabilirsiniz. Lütfen satın aldıktan sonra benimle iletişime geçin! Alım satım ipuçlarımı ve harika bonus göstergelerini ücretsiz olarak sizinle paylaşacağım! Muhtemelen Gann ticaret y
TPSpro RFI Levels
Roman Podpora
4.81 (21)
Reversal First Impulse levels (RFI)    INSTRUCTIONS        RUS       -       ENG              R ecommended to use with an indicator   -   TPSpro  TREND PRO -  Version MT5 A key element in trading is zones or levels from which decisions to buy or sell a trading instrument are made. Despite attempts by major players to conceal their presence in the market, they inevitably leave traces. Our task was to learn how to identify these traces and interpret them correctly. Main functions: Displaying activ
Atomic Analyst
Issam Kassas
5 (2)
Öncelikle belirtmek gerekir ki bu Ticaret Göstergesi Yeniden Çizim Yapmaz, Gecikmez ve Gecikme Göstermez, bu da hem manuel hem de robot ticareti için ideal hale getirir. Kullanıcı kılavuzu: ayarlar, girişler ve strateji. Atom Analisti, Piyasada Daha İyi Bir Avantaj Bulmak İçin Fiyatın Gücünü ve Momentumunu Kullanan PA Fiyat Hareketi Göstergesidir. Gürültüleri ve Yanlış Sinyalleri Kaldırmaya ve Ticaret Potansiyelini Artırmaya Yardımcı Olan Gelişmiş Filtrelerle Donatılmıştır. Birden fazla katma
Gold Stuff
Vasiliy Strukov
4.89 (237)
Gold Stuff, özellikle altın için tasarlanmış bir trend göstergesidir ve herhangi bir finansal enstrümanda da kullanılabilir. Gösterge yeniden çizilmez ve gecikmez. Önerilen zaman dilimi H1. Bu göstergede tam otomatik Uzman Danışman EA Gold Stuff çalışır. Profilimde bulabilirsiniz. Ayarları ve kişisel bir bonusu almak için satın alma işleminden hemen sonra benimle iletişime geçin!  Güçlü Destek ve Trend Tarayıcı göstergemizin ücretsiz bir kopyasını pm'den alabilirsiniz. Ben! AYARLAR Ok Ç
Enigmera
Ivan Stefanov
5 (3)
ENIGMERA: Pazarın çekirdeği https://www.enigmera.com Giriş Bu gösterge ve ticaret sistemi, finansal piyasalar için dikkate değer bir yaklaşımdır. ENIGMERA, destek ve direnç seviyelerini doğru bir şekilde hesaplamak için fraktal döngüleri kullanır. Gerçek birikim aşamasını gösterir ve yön ve hedefler verir.  İster bir trendde ister bir düzeltmede olalım çalışan bir sistem.  Nasıl çalışır? ENIGMERA üç çizgiden oluşur: destek/direnç çizgisi, hedef çizgisi ve sapma çizgisi. Sistem, geçmiş veril
TPSproTREND PrO
Roman Podpora
4.79 (19)
TPSpro TREND PRO,   piyasayı otomatik olarak analiz eden, trend ve değişimlerinin her biri hakkında bilgi sağlayan, ayrıca yeniden çizmeden işlemlere girme sinyalleri veren bir trend göstergesidir! Gösterge her mumu ayrı ayrı analiz ederek kullanır. farklı dürtülere atıfta bulunur - yukarı veya aşağı dürtü. Para birimleri, kripto paralar, metaller, hisse senetleri ve endeksler için işlemlere tam giriş noktaları! Sürüm MT5                   GÖSTERGENİN TAM AÇIKLAMASI       Bunu -   RFI SEVİYELER
Trend Punch
Mohamed Hassan
4.95 (19)
This indicator is unstoppable when combined with our other indicator called  Support & Resistance . After purchase, send us a message and you will get it   for  FREE as a BONUS! Introducing Trend Punch , the revolutionary forex trend indicator that will transform the way you trade! Trend Punch is uniquely designed to provide precise buy and sell arrows during strong market trends, making your trading decisions clearer and more confident. Whether you're trading major currency pairs or exotic sym
ŞU ANDA %26 INDIRIMLI Yeni Başlayanlar veya Uzman Tüccarlar için En İyi Çözüm! Bu Gösterge benzersiz, yüksek kaliteli ve uygun fiyatlı bir ticaret aracıdır çünkü bir dizi tescilli özellik ve yeni bir formül ekledik. Sadece BİR grafik ile 28 Forex çifti için Döviz Gücünü okuyabilirsiniz! Yeni bir trendin veya scalping fırsatının tam tetik noktasını belirleyebildiğiniz için ticaretinizin nasıl gelişeceğini hayal edin? Kullanım kılavuzu: buraya tıklayın Bu ilk olan, orijinal! Değersiz bir
Şu anda %20 İNDİRİMLİ! Herhangi bir Acemi veya Uzman Tüccar için En İyi Çözüm! Bu gösterge paneli yazılımı 28 döviz çifti üzerinde çalışıyor. Ana göstergelerimizden 2'sine (Gelişmiş Para Birimi Gücü 28 ve Gelişmiş Para Birimi Dürtüsü) dayanmaktadır. Tüm Forex piyasasına harika bir genel bakış sağlar. Gelişmiş Para Birimi Gücü değerlerini, para birimi hareket hızını ve tüm (9) zaman dilimlerinde 28 Forex çifti için sinyalleri gösterir. Trendleri ve / veya scalping fırsatlarını belirlemek içi
Currency Strength Exotics
Bernhard Schweigert
4.87 (30)
ŞU ANDA %20 INDIRIMLI! Herhangi bir Acemi veya Uzman Tüccar için En İyi Çözüm! Bu Gösterge, Egzotik Çiftler Emtialar, Endeksler veya Vadeli İşlemler gibi herhangi bir sembol için para birimi gücünü göstermek için uzmanlaşmıştır. Türünün ilk örneğidir, Altın, Gümüş, Petrol, DAX, US30, MXN, TRY, CNH vb. gerçek para birimi gücünü göstermek için 9. satıra herhangi bir sembol eklenebilir. Bu benzersiz, yüksek kaliteli ve uygun fiyatlı bir ticaret aracıdır çünkü bir dizi tescilli özelliği ve yeni
Scalper Inside PRO
Alexey Minkov
4.73 (56)
An exclusive indicator that utilizes an innovative algorithm to swiftly and accurately determine the market trend. The indicator automatically calculates opening, closing, and profit levels, providing detailed trading statistics. With these features, you can choose the most appropriate trading instrument for the current market conditions. Additionally, you can easily integrate your own arrow indicators into Scalper Inside Pro to quickly evaluate their statistics and profitability. Scalper Inside
- Real price is 80$ - 40% Discount ( It is 49$ now ) Contact me for instruction, add group and any questions! Related EA Product: Bitcoin Expert Introduction The breakout and retest strategy is traded support and resistance levels. it involves price breaking through a previous level.  The break and retest strategy is designed to help traders do two main things, the first is to avoid false breakouts. Many false breakouts start with a candlestick that breaks out of a level but ends with an immedi
ŞU ANDA %31 INDIRIMLI !!! Yeni Başlayanlar veya Uzman Tüccarlar için En İyi Çözüm! Bu gösterge benzersiz, yüksek kaliteli ve uygun fiyatlı bir ticaret aracıdır çünkü bir dizi tescilli özellik ve gizli bir formül ekledik. Yalnızca BİR grafikle 28 döviz çiftinin tümü için Uyarılar verir. Yeni bir trendin veya scalping fırsatının tam tetik noktasını belirleyebildiğiniz için ticaretinizin nasıl gelişeceğini hayal edin! Yeni temel algoritmalar üzerine inşa edilen bu sistem, potansiyel işlemler
FX Volume
Daniel Stein
4.58 (33)
Sabah Brifingimiz aracılığıyla ayrıntılar ve ekran görüntüleri ile günlük piyasa güncellemenizi alın burada mql5 ve on Telegram ! FX Volume, bir brokerin bakış açısından piyasa duyarlılığı hakkında GERÇEK bir fikir veren İLK ve TEK hacim göstergesidir. COT raporlarından çok daha hızlı bir şekilde, brokerlar gibi kurumsal piyasa katılımcılarının Forex piyasasında nasıl konumlandıklarına dair harika bilgiler sağlar. Bu bilgileri doğrudan grafiğinizde görmek, ticaretiniz için gerçek oyun değiştir
Trend Screener
STE S.S.COMPANY
4.8 (86)
Trend Göstergesi, Trend Alım Satım ve Filtreleme için Çığır Açan Benzersiz Çözüm, Tüm Önemli Trend Özellikleriyle Tek Bir Araç İçinde Yerleştirildi! Forex, emtialar, kripto para birimleri, endeksler ve hisse senetleri gibi tüm sembollerde/araçlarda kullanılabilen %100 yeniden boyamayan çoklu zaman çerçevesi ve Çoklu para birimi göstergesidir. SINIRLI SÜRELİ TEKLİF: Destek ve Direnç Tarama Göstergesi sadece 50$ ve ömür boyu mevcuttur. (Orijinal fiyat 250$) (teklif uzatıldı) Trend Screener, grafik
TakePropips Donchian Trend Pro
Eric John Pajarillaga Aldana
4.44 (16)
TakePropips Donchian Trend Pro   (MT4), Donchian Kanalı'nı kullanarak trendin yönünü otomatik olarak tespit eden ve size ticarete giriş ve çıkış sinyalleri sağlayan güçlü ve etkili bir araçtır! Bu çok işlevli gösterge, bir trend tarayıcı, ticaret sinyalleri, istatistiksel panel, tarayıcı, ticaret oturumları ve uyarı geçmişi panosu içerir. Size ticaret sinyalleri sağlamak ve çizelgeleri analiz ederek saatlerce tasarruf etmenizi sağlamak için tasarlanmıştır! Kullanım kılavuzunu ve kurulum kılavuzu
Chart Patterns All-in-One göstergesi, traderların teknik analizde yaygın olarak kullanılan çeşitli grafik formasyonlarını görselleştirmelerine yardımcı olmak için tasarlanmıştır. Bu formasyonlar, potansiyel piyasa davranışları hakkında fikir verir, ancak göstergenin kendisi tarafından karlılık garanti edilmez veya ima edilmez. Göstergesi, formasyonları kendi ticaret stratejiniz içinde değerlendirmenize olanak tanıyan bir araçtır. Bonus için, bana mesaj göndermekten veya yorum bırakmaktan çekinme
Advanced Supply Demand
Bernhard Schweigert
4.91 (294)
CURRENTLY 26% OFF !! Best Solution for any Newbie or Expert Trader! This indicator is a unique, high quality and affordable trading tool because we have incorporated a number of proprietary features and a new formula. With this update, you will be able to show double timeframe zones. You will not only be able to show a higher TF but to show both, the chart TF, PLUS the higher TF: SHOWING NESTED ZONES. All Supply Demand traders will love it. :) Important Information Revealed Maximize the potenti
This indicator is based on the Gann Signal indicator and acts as a market scanner. All you need to do is fill in the selected currency pairs in the settings and that’s it. Next, the indicator itself will view all these currency pairs and time frames from M5 to D1 simultaneously. When a new signal appears, the indicator will give you an Alert and also draw the letter N where this new signal will be.
IX Power MT4
Daniel Stein
5 (5)
IX Power nihayet FX Power'ın rakipsiz hassasiyetini Forex dışı sembollere getiriyor. En sevdiğiniz endeksler, hisse senetleri, emtialar, ETF'ler ve hatta kripto para birimlerindeki kısa, orta ve uzun vadeli eğilimlerin yoğunluğunu doğru bir şekilde belirler. Terminalinizin sunduğu her şeyi analiz edebilirsiniz. Deneyin ve işlem yaparken zamanlamanızın nasıl önemli ölçüde iyileştiğini deneyimleyin. IX Power Temel Özellikler 100 hassas, yeniden boyanmayan hesaplama sonuçları - terminalini
FX Power MT4 NG
Daniel Stein
5 (12)
Sabah Brifingimiz burada mql5 ve on Telegram! FX Power MT4 NG , uzun zamandır çok popüler olan döviz gücü ölçerimiz FX Power'ın yeni neslidir. Peki bu yeni nesil güç ölçer ne sunuyor? Orijinal FX Power hakkında sevdiğiniz her şey PLUS GOLD/XAU güç analizi Daha da hassas hesaplama sonuçları Ayrı ayrı yapılandırılabilir analiz dönemleri Daha da iyi performans için özelleştirilebilir hesaplama limiti Özel çokluDaha fazlasını görmek isteyenler için örnek ayarlar Her grafikte en sevdiğiniz renkler i
NextCandlePredictor Göstergesi NextCandlePredictor, yeniden boyamayan, rengini değiştirmeyen, hareket etmeyen, kaybolmayan ve gecikme olmayan bir uyarılı sinyal göstergesidir. Herhangi bir zaman diliminde bir sonraki veya yaklaşan mumların yönünü belirlemenize yardımcı olacaktır. New York, Londra veya her ikisinin de çakıştığı yüksek volatiliteye sahip piyasalar için şiddetle tavsiye edilir. Ana Özellikler: Zaman Dilimlerinde Esneklik: M1'den H1'e ve ötesine kadar herhangi bir zaman diliminde hı
Öncelikle, bu Ticaret Aracının Non-Repainting, Non-Redrawing ve Non-Lagging Gösterge olduğunu vurgulamakta fayda var, bu da onu profesyonel ticaret için ideal hale getiriyor. Çevrimiçi kurs, kullanıcı kılavuzu ve demo. Akıllı Fiyat Hareketi Kavramları Göstergesi, hem yeni hem de deneyimli tüccarlar için çok güçlü bir araçtır. İleri ticaret fikirlerini, Inner Circle Trader Analizi ve Smart Money Concepts Ticaret Stratejileri gibi 20'den fazla kullanışlı göstergeyi bir araya getirerek bir araya g
Gold Channel is a volatility-based indicator, developed with a specific timing algorithm for the XAUUSD pair, which consists of finding possible corrections in the market. This indicator shows two outer lines, an inner line (retracement line) and an arrow sign, where the theory of the channel is to help identify overbought and oversold conditions in the market. The market price will generally fall between the boundaries of the channel. If prices touch or move outside the channel it is a tra
Fiyat tersine döndükçe ve geri çekildikçe piyasa yapısından elde edilen kâr değişir. Piyasa yapısını tersine çevirme uyarısı göstergesi, bir trendin veya fiyat hareketinin ne zaman tükenmeye yaklaştığını ve tersine dönmeye hazır olduğunu tanımlar. Genellikle bir geri dönüş veya büyük bir geri çekilme meydana gelmek üzereyken meydana gelen piyasa yapısındaki değişiklikler konusunda sizi uyarır. Gösterge, olası bir tükenme noktasının yakınında her yeni yüksek veya düşük oluştuğunda, başlangıçta
Currency Strength Wizard , başarılı ticaret için size hepsi bir arada çözüm sağlayan çok güçlü bir göstergedir. Gösterge, birden çok zaman dilimindeki tüm para birimlerinin verilerini kullanarak şu veya bu forex çiftinin gücünü hesaplar. Bu veriler, şu veya bu para biriminin gücünü görmek için kullanabileceğiniz, kullanımı kolay para birimi endeksi ve para birimi güç hatları biçiminde temsil edilir. İhtiyacınız olan tek şey, işlem yapmak istediğiniz tabloya göstergeyi eklemektir ve gösterge size
Trend Pulse
Mohamed Hassan
5 (4)
Please contact me after purchase to immediately get your PDF strategy + documentation for Trend Pulse !  Official release price of $79  (3 /50 copies left). Next price is $129 . Introducing Trend Pulse , a unique and robust indicator capable of detecting bullish, bearish, and even ranging trends! Trend Pulse uses a special algorithm to filter out market noise with real precision. If the current symbol is moving sideways, Trend Pulse will send you a ranging signal, letting you know that it'
Özel MT4 göstergemizle başarılı forex ticaretinin sırrını keşfedin! Forex piyasasında nasıl başarıya ulaşacağınızı hiç merak ettiniz, riski en aza indirirken sürekli olarak kar kazandınız mı? İşte aradığınız cevap! Ticaret yaklaşımınızda devrim yaratacak tescilli MT4 göstergimizi tanıtmamıza izin verin. Benzersiz çok yönlülük Göstergemiz, Renko ve RangeBar Mum oluşumlarını tercih eden kullanıcılar için özel olarak tasarlanmıştır. Bu grafik türlerinin birçok deneyimli tüccar tarafından ter
Sizlere ON Trade Waves Patterns Harmonic Elliot Wolfe'u tanıtmaktan mutluluk duyarız. Bu, manuel ve otomatik yöntemleri kullanarak piyasada çeşitli desenleri tespit etmek için tasarlanmış gelişmiş bir göstergedir. İşte nasıl çalıştığı: Harmonik Desenler: Bu gösterge, grafiğinizde görünen harmonik desenleri tanımlayabilir. Bu desenler, Scott Carney'in "Harmonic Trading vol 1 & 2" adlı kitabında açıklandığı gibi harmonik ticaret teorisini uygulayan tüccarlar için önemlidir. Onları manuel olarak ç
Entry Points Pro
Yury Orlov
4.62 (175)
Yeniden boyamadan bir ticarete girmek için doğru sinyaller sağlayan MT5 için en iyi gösterge! Herhangi bir finansal varlığa uygulanabilir: forex, kripto para birimleri, metaller, hisse senetleri, endeksler. MT5 versiyonu burada Oldukça doğru alım satım sinyalleri sağlayacak ve bir alım satımı açıp kapatmanın en iyi zamanını size söyleyecektir. Göstergeyi ödeyen yalnızca bir sinyali işleme örneğiyle videoyu (6:22) izleyin! Çoğu tüccar, Giriş Noktaları Pro göstergesinin yardımıyla ilk işl
Yazarın diğer ürünleri
DailyHighLow
Komi Eyram F Kahoho
Please remember to rate the indicator to help me with visibility. The DailyHighLow Indicator for MetaTrader 4 (MT4) provides a sophisticated tool for tracking daily price movements. Designed for traders who need clear, actionable insights into market highs and lows, this indicator automatically plots trend lines based on the highest and lowest prices over a customizable number of days. Key Features: Trend Lines Customization: Define colors, line styles, and widths for both broken and unbroke
FREE
The RR_TradeManager Visualizer is a trade management indicator designed for traders who want to easily visualize their Take Profit (TP) and Stop Loss (SL) levels on a chart. This initial version provides a simple graphical representation that displays SL and TP zones as well as the entry price. Please note that this current version focuses solely on the graphical display of SL and TP zones as figures on the chart. Current Version Features: SL and TP Zones Display: Clear visualization of stop los
FREE
FVG Analyzer
Komi Eyram F Kahoho
The FVG Analyzer is a custom indicator for MetaTrader 4 designed to detect and highlight Fair Value Gaps (FVG) on price charts. This tool allows traders to easily identify areas where value gaps have occurred, providing potential trading opportunities based on these gaps. Features: FVG Detection : Bullish FVG : Identifies bullish gaps where the high of the next candle is lower than the low of the previous candle. Bearish FVG : Detects bearish gaps where the low of the next candle is higher than
The OrderBlock Analyzer is a powerful custom MetaTrader 4 (MT4) indicator designed to detect and highlight critical Order Blocks on your price charts, helping you identify potential reversal points and key areas of market interest. Key Features: Order Block Detection: Automatically identifies bullish and bearish Order Blocks, marking areas where institutional traders are likely to enter or exit positions. Customizable Display: Choose your preferred colors and styles for bullish and bearish Order
The Liquidity Zone Detector is an advanced technical indicator designed to identify and highlight key liquidity zones in the market using the ZigZag indicator. This tool pinpoints price levels where significant liquidity is likely present by drawing trendlines at the highs and lows detected by the ZigZag. The Liquidity Zone Detector assists traders in spotting potential reversal or trend continuation areas based on liquidity accumulation or release. Key Features: Automatic Liquidity Zone Identif
Before diving into the features of this indicator, please remember to rate this product, leave a comment to share your experience, and subscribe to my page to stay informed about the latest updates and new tools. Your support is invaluable and helps me constantly improve my creations! Description: The TradingSessionPipsVisualizer is a powerful MetaTrader 4 indicator designed to visually represent major trading sessions on your charts. This tool allows you to easily distinguish between various tr
Filtrele:
İnceleme yok
İncelemeye yanıt