RR TradeManager Visualizer
- Göstergeler
- Komi Eyram F Kahoho
- Sürüm: 2.5
- Güncellendi: 26 Aralık 2024
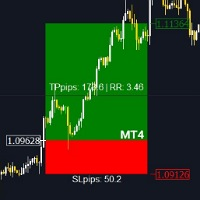
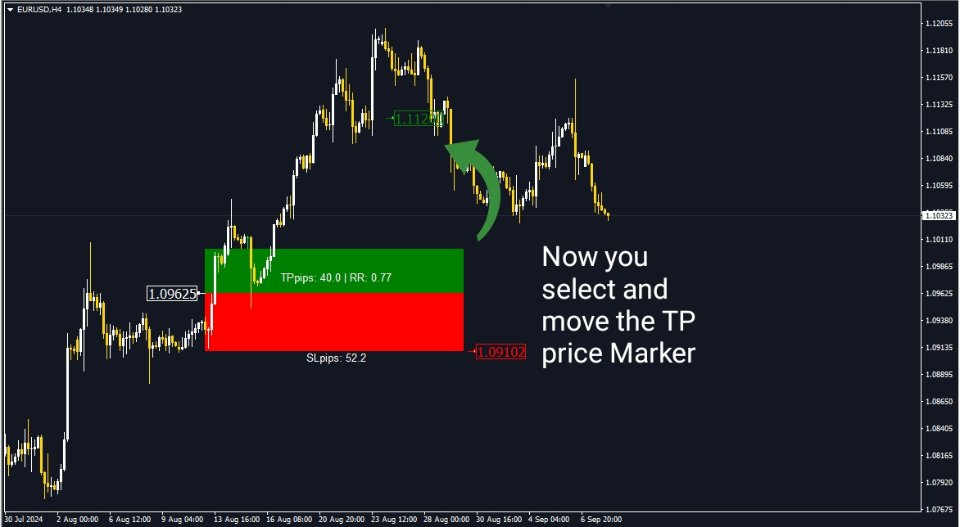
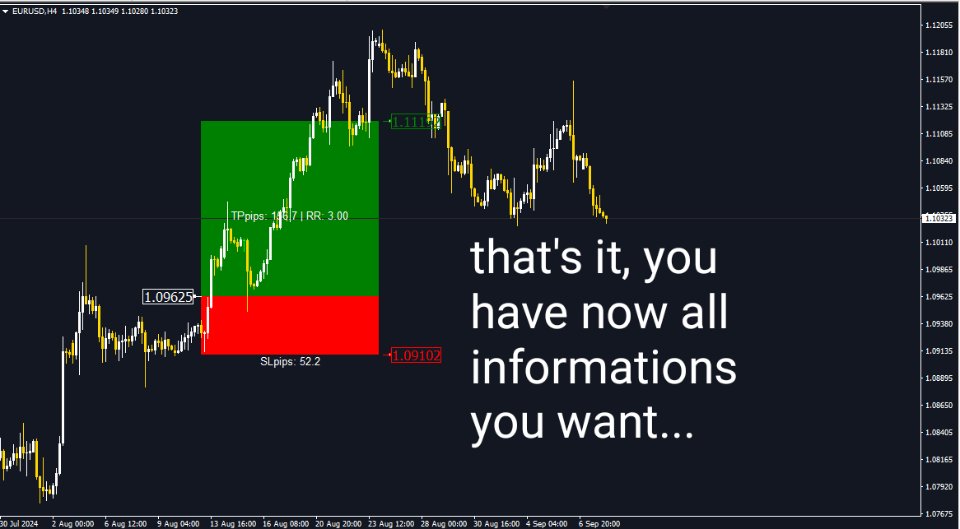
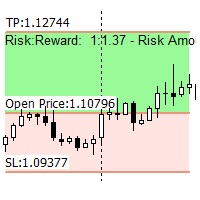
The RR_TradeManager Visualizer is a trade management indicator designed for traders who want to easily visualize their Take Profit (TP) and Stop Loss (SL) levels on a chart. This initial version provides a simple graphical representation that displays SL and TP zones as well as the entry price. Please note that this current version focuses solely on the graphical display of SL and TP zones as figures on the chart.
Current Version Features:
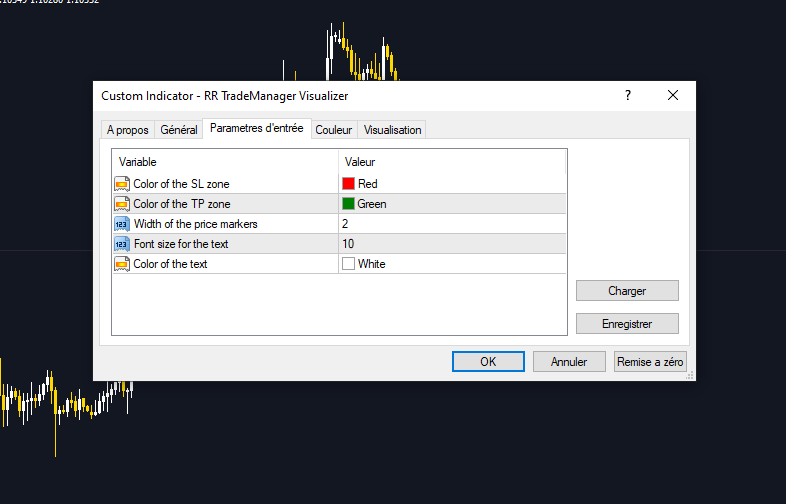
- SL and TP Zones Display: Clear visualization of stop loss and take profit levels with customizable colors.
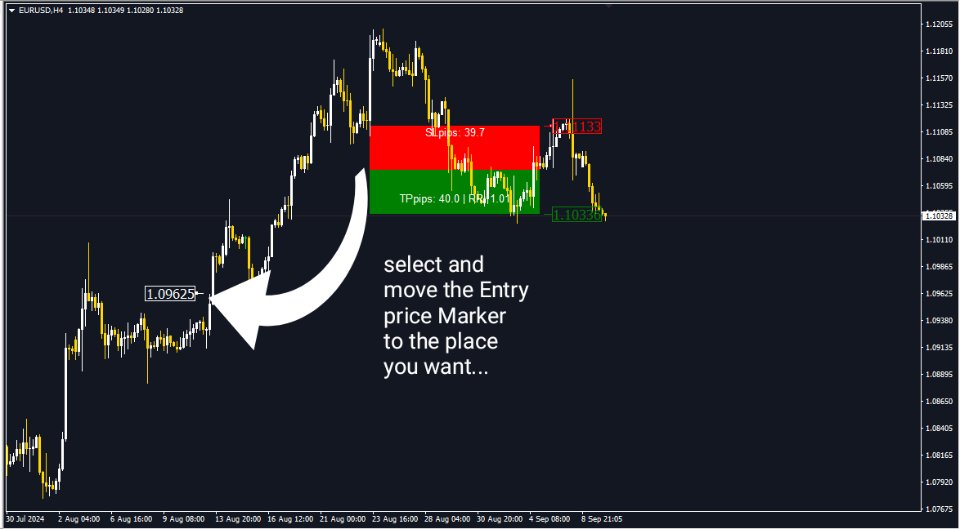
- Movable Entry Price: Allows you to move the entry price on the chart to see how the SL and TP levels adjust.
- Risk/Reward Ratio Calculation: Dynamic display of the risk/reward ratio based on the defined levels.
Usage:
- Set Entry Price: Click on the chart to set your entry price.
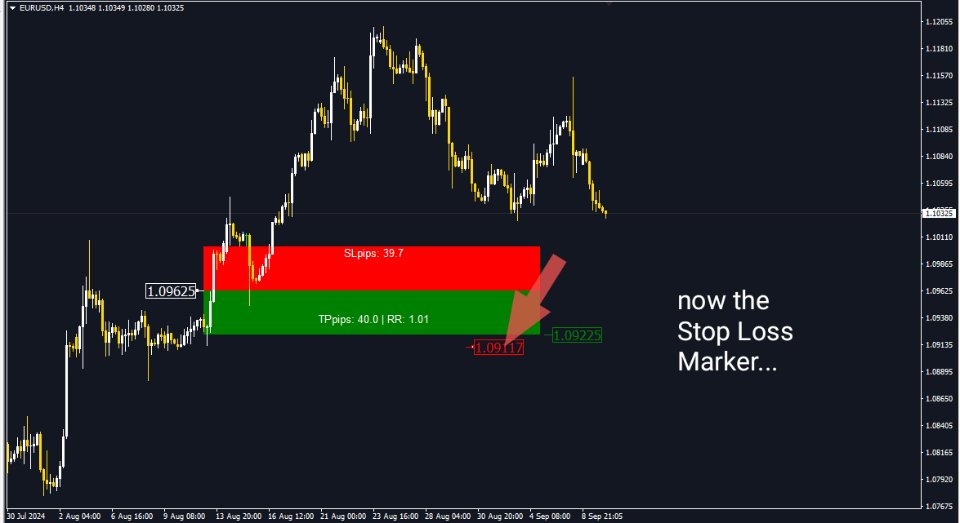
- Adjust SL and TP Levels: Move the SL and TP zones to adjust your risk and reward levels.
- Visualize Zones: SL and TP zones will be displayed with distinct colors for easy visualization.
Coming Soon: An updated version will be available in a few days, offering additional features and improvements for more effective trade management.
Please Rate: If you find the RR_TradeManager Visualizer helpful, kindly rate it on the product page. Your feedback is valuable and helps us improve.











Kullanıcı incelemeye herhangi bir yorum bırakmadı