• Genel bakış
  • İncelemeler
  • Yorumlar

Price Following Indicator

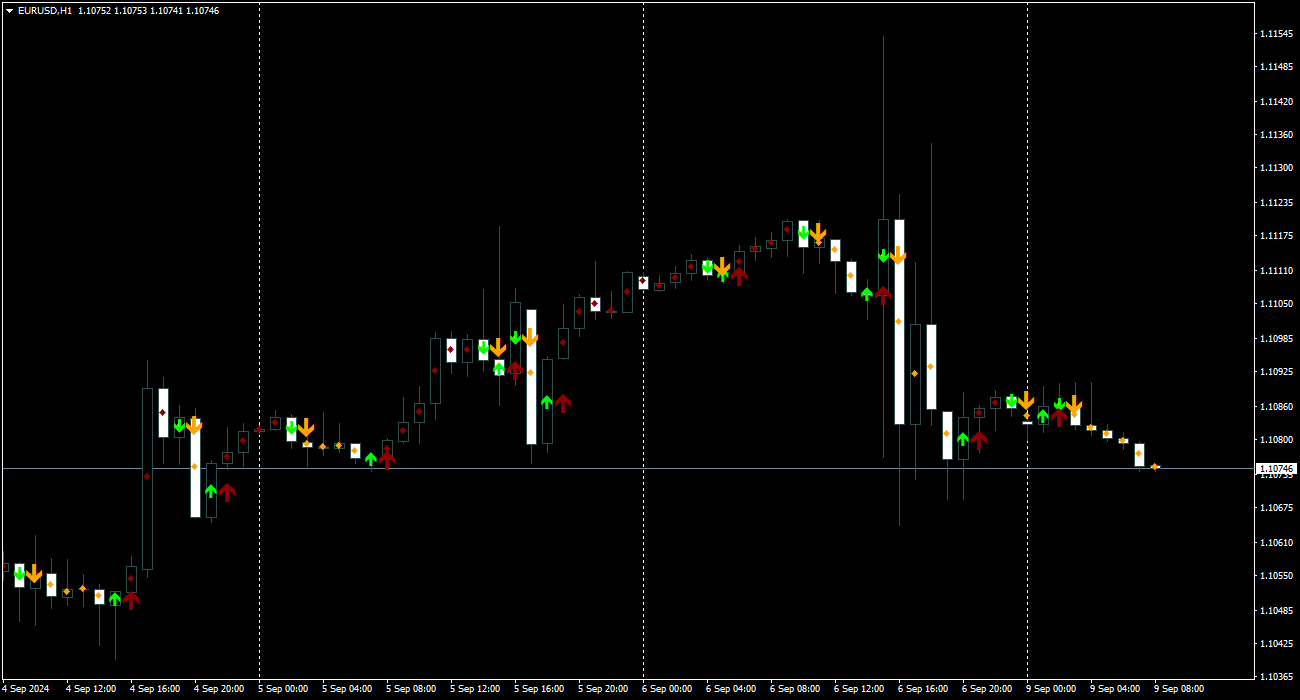
Fiyat dönüşlerini gösteren ve bir trend trendini takip eden ok göstergesi.
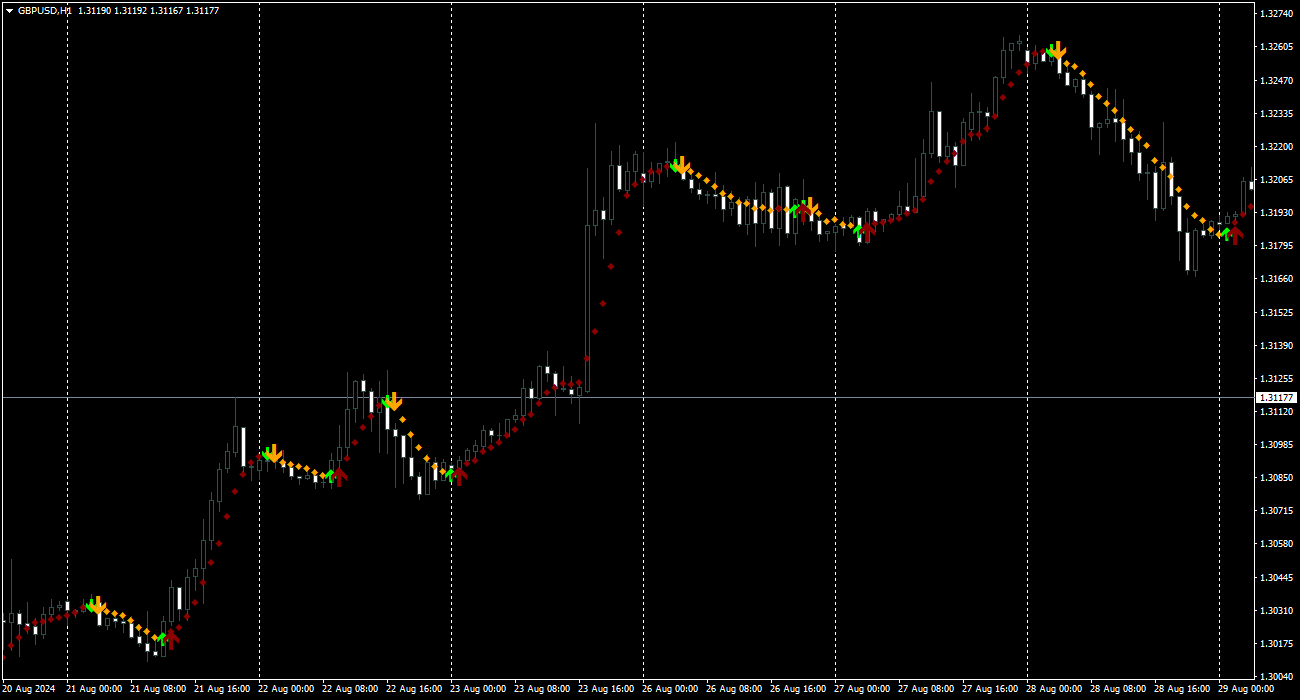
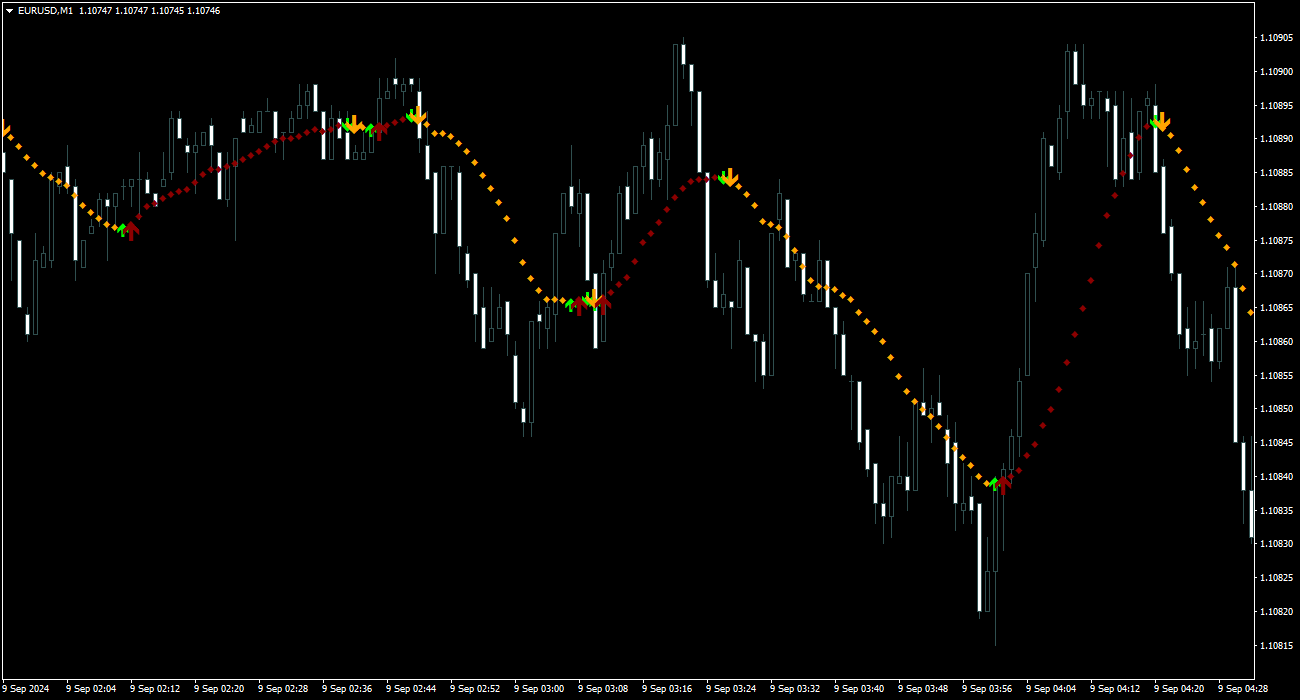
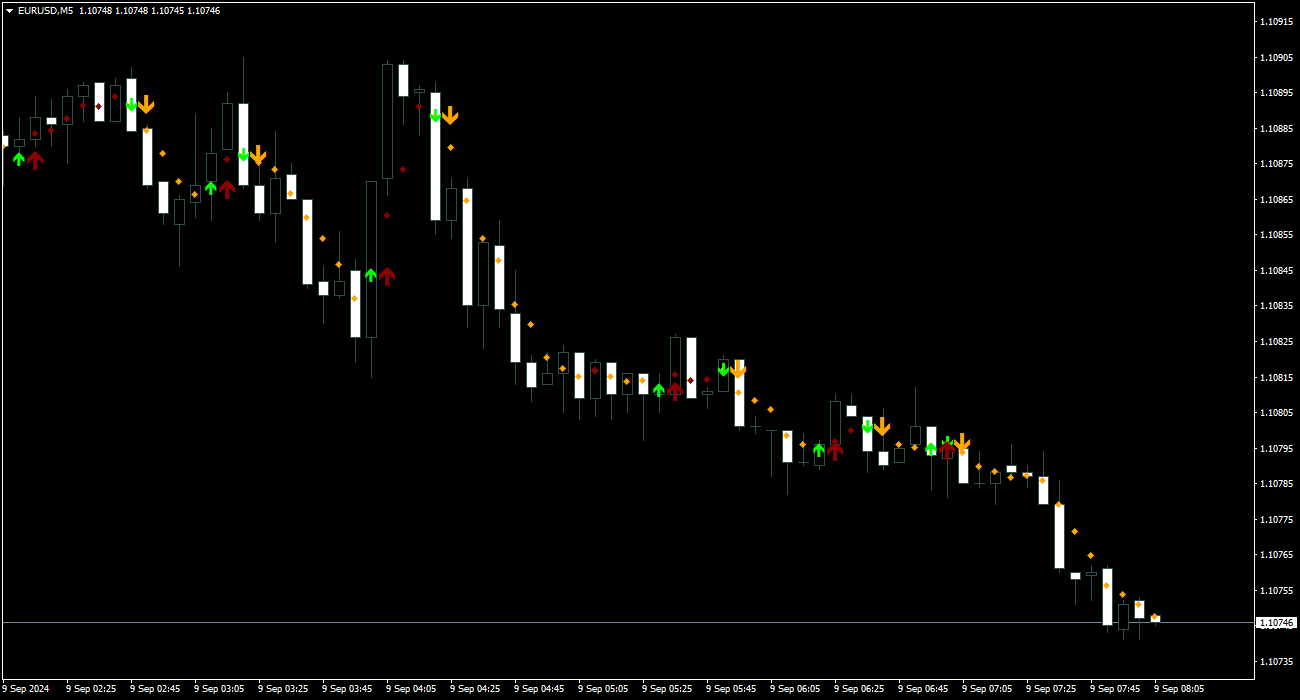
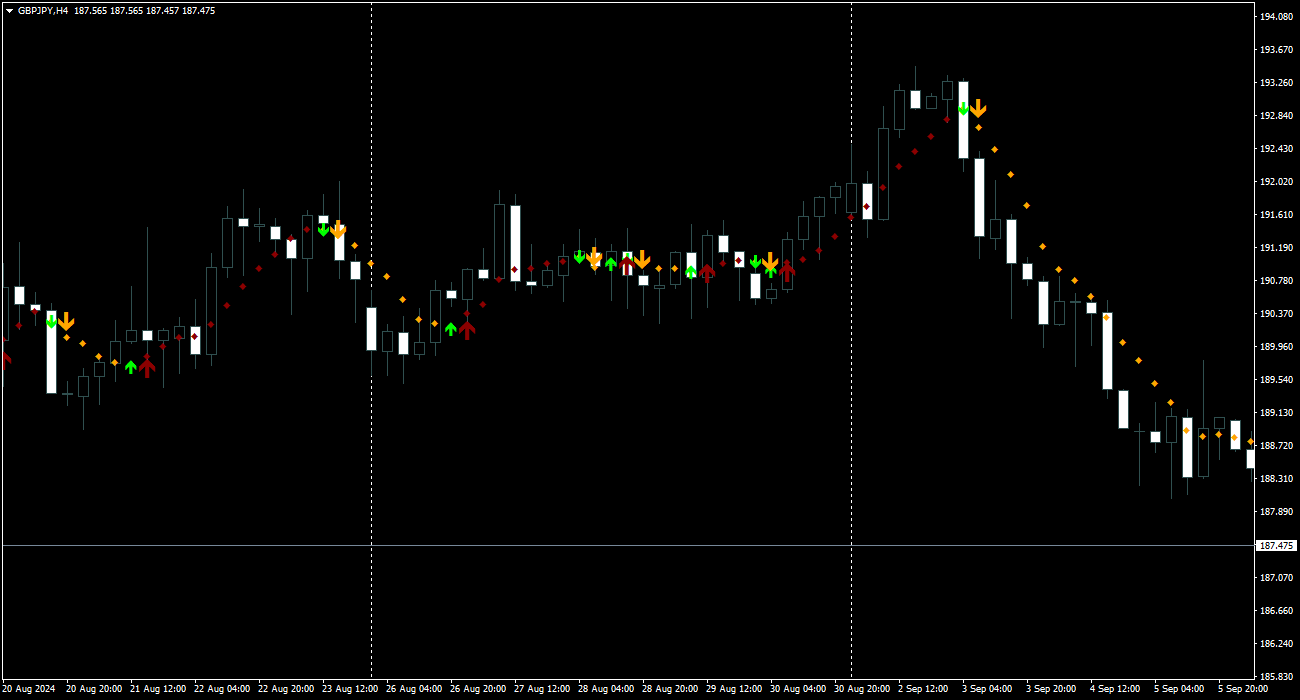
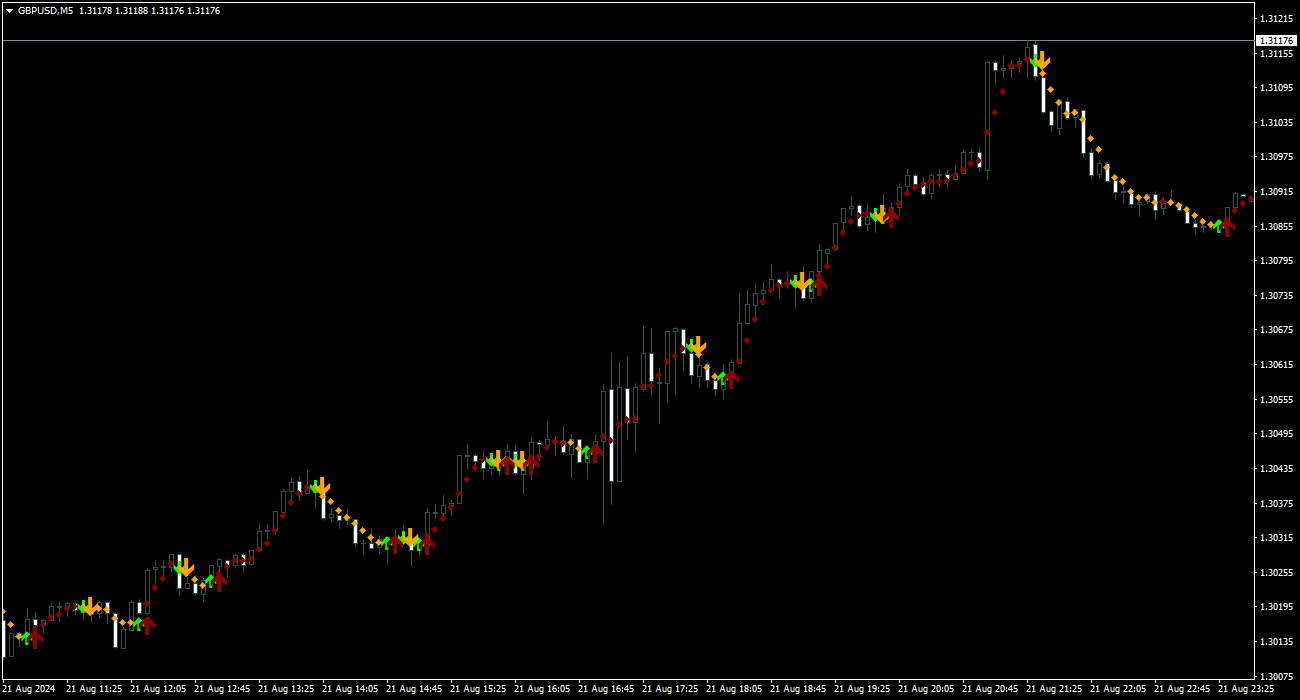
Gösterge, grafikteki fiyat dönüşlerini belirler ve TF 1M-5M'de ölçeklendirme ve TF 1H ve 4H'de günlük işlemler için uygundur. Alış ve satış okları grafikte giriş sinyalleri olarak görüntülenir. Elmaslar, sinyalin devamı olarak okların arkasında görüntülenir.
Yeniden çizilmezler ve mum kapandıktan sonra oluşturulurlar.
Kırmızı oklar satın alma sinyalleridir.
Turuncu oklar satış sinyalleridir.
Gösterge ayrıca erken bir sinyalin yeşil oklarını da içerir;
bunlar yeniden çizilebilir. Ticaret bir trend boyunca gerçekleştiriliyorsa erken bir sinyali tespit etmeye yararlar. Erken oklardan sonra sinyal onaylanırsa normal sinyal oku görünecektir. Sinyal yanlışsa sinyal oku olmayacaktır.
Herhangi bir ticaret stratejisine eklenebilir.
Sinyal okları yeniden boyamaya gerek kalmadan çalışır ve çeşitli türde uyarılara sahiptir.
" Arrow generation mode " ayarlarını değiştirmek için tek bir parametreye sahiptir.


Göstergeyi kullanma seçenekleri
  • Trendi belirlemek için TF 1H veya 4H ok oluşturma modunu 20-35 kullanın. M15-M30, mod 1-10 TF sinyallerini algılamak için. Yeşil okları kullanabilirsiniz.
  • Trendi belirlemek için TF M15 veya M30 ok oluşturma modunu 25-55 kullanın. M1-M5, mod 1-15 TF sinyallerini tanımlamak için. Yeşil okları kullanabilirsiniz.
  • Diğer parametreleri önce test ederek kullanabilirsiniz.
Önerilen ürünler
Trade with Gann on your side!! MASTER CIRCLE 360 CIRCLE CHART, originally created by Gann admitted that this is “The Mother of all charts”. It is one of the last studies that this great trader left for us. The numeric tab le is apparently quite simple like all the tables and is based on square numbers, the SQUARE OF 12 and is by evolution, one of the most important square numbers. Here we can find CYCLE, PRICE AND TIME thanks to angles and grades, to show past and future support and resistance.
Master Scalping M1 , trendi hızlı ve doğru bir şekilde belirlemek için bir algoritma kullanan yenilikçi bir göstergedir. Gösterge, pozisyonların açılış ve kapanış zamanını hesaplar, gösterge algoritmaları, bir ticarete girmek (bir varlık satın almak veya satmak) için ideal anları bulmanızı sağlar, bu da çoğu tüccar için işlemlerin başarısını artırır. Göstergenin faydaları: Kullanımı kolaydır, çizelgeyi gereksiz bilgilerle aşırı yüklemez. Herhangi bir strateji için bir filtre olarak kullanılabili
PipFinite Binary Options PRO
Karlo Wilson Vendiola
4.45 (29)
This LEGIT Indicator Can Accurately Predict the Outcome of One Bar. Imagine adding more filters to further increase your probability! Unlike other products, Binary Options PRO can analyze past signals giving you the statistical edge. How Increase Your Probability Information revealed here www.mql5.com/en/blogs/post/727038 NOTE: The selection of a Good Broker is important for the overall success in trading Binary Options. Benefits You Get Unique algorithm that anticipates price weaknes
Insider Scalper Binary This tool is designed to trade binary options. for short temporary spends. to make a deal is worth the moment of receiving the signal and only 1 candle if it is m1 then only for a minute and so in accordance with the timeframe. for better results, you need to select well-volatile charts.... recommended currency pairs eur | usd, usd | jpy .... the indicator is already configured, you just have to add it to the chart and trade .... The indicator signals the next can
Owl smart levels
Sergey Ermolov
4.34 (35)
MT5 versiyonu  |  FAQ Owl Smart Levels Indicator ,   Bill Williams'ın gelişmiş fraktalları , piyasanın doğru dalga yapısını oluşturan Valable ZigZag ve kesin giriş seviyelerini gösteren   Fibonacci seviyeleri   gibi popüler piyasa analiz araçlarını içeren tek gösterge içinde eksiksiz bir ticaret sistemidir. pazara ve kar elde edilecek yerlere. Stratejinin ayrıntılı açıklaması Gösterge ile çalışma talimatı Baykuş Yardımcısı ticaretinde Danışman Yardımcısı Kullanıcıların özel sohbeti -> Satın ald
Infinity Trend Pro
Yaroslav Varankin
1 (1)
This is a trend indicator without redrawing Developed instead of the binary options strategy (by the color of the Martingale candlestick) Also works well in forex trading When to open trades (binary options) A signal will appear in the place with a candle signaling the current candle It is recommended to open a deal for one candle of the current timeframe M1 and M5 When a blue dot appears, open a deal up When a red dot appears, open a trade down. How to open trades on Forex. When a signal is rec
Gösterge, olası minimum gecikme ile   yeniden boyama yapmadan   grafikte harmonik desenleri gösterir. Gösterge üstleri arayışı, fiyat analizinin dalga ilkesine dayanmaktadır. Gelişmiş ayarlar, ticaret tarzınız için parametreler seçmenize olanak tanır. Bir mumun (çubuk) açılışında, yeni bir model oluşturulduğunda, fiyat hareketinin olası yönünün değişmeyen bir oku sabitlenir. Gösterge aşağıdaki kalıpları ve çeşitlerini tanır: ABCD, Gartley (Butterfly, Crab, Bat), 3Drives, 5-0, Batman, SHS, One2On
Trendiness Index
Libertas LLC
5 (3)
"The trend is your friend" is one of the best known sayings in investing, because capturing large trendy price movements can be extremely profitable. However, trading with the trend is often easier said than done, because many indicators are based on price reversals not trends. These aren't very effective at identifying trendy periods, or predicting whether trends will continue. We developed the Trendiness Index to help address this problem by indicating the strength and direction of price trend
VR Cub
Vladimir Pastushak
VR Cub , yüksek kaliteli giriş noktaları elde etmenin bir göstergesidir. Gösterge, matematiksel hesaplamaları kolaylaştırmak ve bir pozisyona giriş noktalarının aranmasını basitleştirmek için geliştirildi. Göstergenin yazıldığı ticaret stratejisi uzun yıllardan beri etkinliğini kanıtlamaktadır. Ticaret stratejisinin basitliği, acemi yatırımcıların bile başarılı bir şekilde ticaret yapmasına olanak tanıyan büyük avantajıdır. VR Cub, pozisyon açılış noktalarını ve Kâr Al ve Zararı Durdur hedef sev
Wave Wolf MT4
Andrei Salanevich
Forex Dalga Kurt MT4 göstergesi, Wolf dalgalarını aramak ve mevcut ticaret terminali penceresinde görüntülemek için tasarlanmıştır. Ticarette Wolfe dalgalarını kullanan tüccarlar için mükemmel bir gösterge. Ticaret stratejilerinde kullanımı, verimliliğini ve karlılığını önemli ölçüde artıracaktır. GÖSTERGE BİLGİSİ Diğer Wolf dalga göstergelerinin aksine, forex Wave Wold MT4 göstergesinin etkinliğini önemli ölçüde artıran birçok özelliği vardır: Birincisi, Açık Windows 5Point (true) ayarı bi
PABT Pattern Indicator - it's classical system one of the signal patterns. Indicator logic - the Hi & Lo of the bar is fully within the range of the preceding bar, look to trade them as pullback in trend. In the way if indicator found PABT pattern it's drawing two lines and arrow what showing trend way.  - First line - it's entry point and drawing at: 1. On the high of signal bar or on middle of the signal bar (depending from indicator mode) for buy; 2. On the low of signal bar or on middle of t
Forex Indicator  " 3 White Soldiers & 3 Black Crows patterns" for MT4 Indicator "3 White Soldiers & 3 Black Crows" is very powerful for Price Action trading:   No repaint, No delays; Indicator   detects 3 White Soldiers and 3 Black Crows patterns on chart: Bullish  3 White Soldiers   pattern - Blue arrow signal on chart (see pictures) Bearish   3 Black Crows   pattern - Red arrow signal on chart (see pictures) P C, Mobile & Email alerts   are included Indicator  " 3 White Soldiers & 3 Black Crow
Chart Patterns Detect 15 patterns (Ascending Triangle, Descending Triangle, Rising Wedge, Falling Wedge, Bullish Flag, Bearish Flag, Bullish Rectangle, Bearish Rectangle Symmetrical triangle, Head and Shoulders, Inverted Head and Shoulders, Triple top, Triple Bottom, Double Top, Double Bottom) Use historical data to calculate the probability of each pattern to succeed (possibility to filter notification according to the chance of success) gives graphic indication about the invalidation level and
Distinctive
Tatiana Savkevych
Distinctive is a forex trending arrow indicator for identifying potential entry points. I like it, first of all, because it has a simple mechanism of work, adaptation to all time periods and trading tactics. Created on the basis of a regression channel with filters. Plotting the Lawrence indicator signals on a price function chart using a mathematical approach. How it works - when the price breaks out in the overbought / oversold zone (channel levels), a buy or sell signal is generated. Every
The Stepping Trend Indicator     The Steppi ng Trend indicator uses the  average true range  (ATR indicator) in its calculation. This gives you control to set your own average true range period, I set the Default as 10.   Indicator Details. Green Arrow Up: This means you are at the starting point of a new bullish trend, it’s time to buy.   Red  Arrow  Down : This means you are at the starting point of a new  bearish  trend, it’ s time to sell .   What if you miss the Arrow Signal?   No
Sto Signal AM
Andriy Matviyevs'kyy
This indicator displays Stochastic osc signals on the price chart and allows the user to receive notifications of such signals. The Stochastic indicator is a classic and proven indicator of the technical analysis of the markets. Despite its age, it is still relevant today. Depending on the settings, the indicator allows you to work effectively on various TFs and any markets. Signals are given on fully formed bars and are not redrawn. Custom Parameters: Stochastic_Price (0-1) - The applied pric
FREE
The Th3Eng PipFinite indicator is based on a very excellent analysis of the right trend direction with perfect custom algorithms. It show the true direction and the best point to start trading. With StopLoss point and Three Take Profit points. Also it show the right pivot of the price and small points to order to replace the dynamic support and resistance channel, Which surrounds the price. And Finally it draws a very helpful Box on the left side on the chart includes (take profits and Stop loss
Trend Deviation
VLADISLAV AKINDINOV
Trend indicator with calculation of dynamic levels and signaling their intersection. Description of input parameters: StepTF = true; - Calculation of the indicator by closing the bar (true) or by each tick (false) BarsCount = 300; - Number of settlement bars Price = PRICE_CLOSE; - Type of price used TimeFrame = PERIOD_CURRENT; - Estimated timeframe TrendPeriod = 9; - Trend calculation period TrendDeviations = 4.9; - coefficient of deviation PeriodTrendSmooth = 1; - Trend smoothi
Trend Monitor
Pavel Zamoshnikov
4 (4)
The indicator generates early signals basing on ADX reading data combined with elements of price patterns. Works on all symbols and timeframes. The indicator does not redraw its signals. You see the same things on history and in real time. For better visual perception signals are displayed as arrows (in order not to overload the chart). Features Easy to use. Filter configuration only requires selection of sensitivity in the " Sensitivity of the indicator " input. Signals can be filtered usin
Gann Square of 144
Taras Slobodyanik
5 (5)
Gann Kutusu (veya Gann Meydanı), W.D. Gann'ın "Piyasa tahminleri için matematiksel formül" makalesine dayanan bir pazar analiz yöntemidir. Bu gösterge üç Kare modelini çizebilir: 90, 52(104), 144. Altı ızgara çeşidi ve iki yay çeşidi vardır. Bir grafik üzerinde aynı anda birden fazla kare çizebilirsiniz. Parametreler Square — kare modelin seçimi : 90 — 90'ın karesi (veya dokuzun karesi); 52 (104) — 52'nin karesi (veya 104); 144 — 144'ün evrensel karesi; 144 (full) — karenin "tam" versiyonu
Point61 Indicator
Evgeniy Machok
5 (1)
The Point61 indicator is the result of many years of monitoring of price behavior of currency pairs and metals. It is not a secret, that in times of uncertainty, traders are looking for possible levels of support and resistance - the point, where price should stop its movement. There are 2 possible scenarios at these points: 1. Reverse (correction) to the opposite direction; 2. Breakthrough to continue movement. Very often these points are used to set stop orders - TakeProfit or
PipFinite Trend PRO
Karlo Wilson Vendiola
4.89 (2359)
Breakthrough Solution For Trend Trading And Filtering With All Important Features Built Inside One Tool! Trend PRO's smart algorithm detects the trend, filters out market noise and gives entry signals with exit levels. The new features with enhanced rules for statistical calculation improved the overall performance of this indicator. Important Information Revealed Maximize the potential of Trend Pro, please visit www.mql5.com/en/blogs/post/713938 The Powerful Expert Advisor Version Automa
Atomic Analyst
Issam Kassas
5 (2)
Öncelikle belirtmek gerekir ki bu Ticaret Göstergesi Yeniden Çizim Yapmaz, Gecikmez ve Gecikme Göstermez, bu da hem manuel hem de robot ticareti için ideal hale getirir. Kullanıcı kılavuzu: ayarlar, girişler ve strateji. Atom Analisti, Piyasada Daha İyi Bir Avantaj Bulmak İçin Fiyatın Gücünü ve Momentumunu Kullanan PA Fiyat Hareketi Göstergesidir. Gürültüleri ve Yanlış Sinyalleri Kaldırmaya ve Ticaret Potansiyelini Artırmaya Yardımcı Olan Gelişmiş Filtrelerle Donatılmıştır. Birden fazla katma
Next Trend Pro
Eduard Bartashevich
Next Trend Pro INDICATOR - the best trend indicator on the market, the indicator works on all timeframes and assets, the indicator is built on the basis of 12 years of experience in forex and many other markets. You know that many trend indicators on the internet are not perfect, late and difficult to trade with, but the Next Trend Pro indicator is different, the Next Trend Pro indicator shows a buy or sell signal, colored candles confirm the signal, and support levels and resistance levels give
Candlestick Patterns Analytics is a powerful tool for analyzing candlestick patterns. Do you trade based on candlestick patterns? Then Candlestick Patterns Analytics is designed for you. The undeniable advantage of the indicator: Predicts trading result when trading candlestick patterns; Uses statistical data based on the history of the selected symbol and timeframe. What the indicator does Finds and marks on the chart 29 candlestick patterns; Draws arrows to indicate the classical and stati
The trend is your friend! This is what this indicator is all about. Follow this famous saying and be safe. Characteristics: Buy/Sell signals fixed on the close of a bar. Works on all symbols and all timeframes. Clear visual market trend laser line, Buy/Sell signal arrows, market strength meter, TP1 & TP2 boxes. Visual signals when to enter, when to exit the market. No repainting. Compatible with Flexible EA for trading automation. (Ask for a free set file optimized to perform 2010-2018) Para
Price reach indicator. It also serves as the perfect term for supports and resistance. I use it in two experts. The basic tool for professional trading. The indicator analyzes the last 500 bar and uses this to determine the levels ( but it doesn't predict the future ) . Personally, I use it on TF H1.  It is very simple. Four lines on chart and that's all. Only two input parameters.  Thousands of indicators. Why this? Is good ? No! Is very good. Please test the indicator prior to purchasing.
Indicator based trading according to the price analysis of bars, the most popular among traders. The indicators calculated based on larger periods are used for identification of a stable trend on the market, and the ones calculated based on smaller periods are used for entering the market after a correction. The oscillators with overbought and oversold levels have a special place in indicator-based trading. The values of such indicators are subjected to wave structure - the higher waves (chart t
[ZhiBiCCI] indicators are suitable for all cycle use, and are also suitable for all market varieties. [ZhiBiCCI] Green solid line is a reversal of bullish divergence. The green dotted line is a classic bullish divergence. [ZhiBiCCI] The solid line to the red is a reverse bearish divergence. The red dotted line is a classical bearish divergence. [ZhiBiCCI] can be set in the parameters (Alert, Send mail, Send notification), set to (true) to send instant signals to the alarm window, email, in
Future Candle One Candle is an arrow indicator of candlestick patterns, based on the calculation of historical statistics. It identifies and calculates patterns consisting of one candle. Advantages of the indicator Gives information about the next candle right now; The indicator values are based on statistical data on the history of the current instrument; Forecasts and displays the result of trading based on its signals; The colors of the indicator have been selected for a comfortable operati
Bu ürünün alıcıları ayrıca şunları da satın alıyor
TPSpro RFI Levels
Roman Podpora
4.82 (22)
Reversal First Impulse levels (RFI)    INSTRUCTIONS        RUS       -       ENG              R ecommended to use with an indicator   -   TPSpro  TREND PRO -  Version MT5 A key element in trading is zones or levels from which decisions to buy or sell a trading instrument are made. Despite attempts by major players to conceal their presence in the market, they inevitably leave traces. Our task was to learn how to identify these traces and interpret them correctly. Main functions: Displaying activ
Enigmera
Ivan Stefanov
5 (3)
ENIGMERA: Pazarın çekirdeği https://www.enigmera.com Giriş Bu gösterge ve ticaret sistemi, finansal piyasalar için dikkate değer bir yaklaşımdır. ENIGMERA, destek ve direnç seviyelerini doğru bir şekilde hesaplamak için fraktal döngüleri kullanır. Gerçek birikim aşamasını gösterir ve yön ve hedefler verir.  İster bir trendde ister bir düzeltmede olalım çalışan bir sistem.  Nasıl çalışır? ENIGMERA üç çizgiden oluşur: destek/direnç çizgisi, hedef çizgisi ve sapma çizgisi. Sistem, geçmiş veril
Gold Channel is a volatility-based indicator, developed with a specific timing algorithm for the XAUUSD pair, which consists of finding possible corrections in the market. This indicator shows two outer lines, an inner line (retracement line) and an arrow sign, where the theory of the channel is to help identify overbought and oversold conditions in the market. The market price will generally fall between the boundaries of the channel. If prices touch or move outside the channel it is a tra
Bomb Bank Signal
Igor Pereira Calil
5 (1)
Bomb Bank Signal: Your Trusted Indicator for MetaTrader 4 The Bomb Bank Signal is a powerful indicator for MetaTrader 4, designed to identify the most relevant trends in the financial market. If you are looking for a tool that accurately anticipates movements, Bomb Bank is the ally you need. How it Works: This indicator combines three distinct methods – volume analysis, candle closes and symmetrical trend – to detect and signal buying and selling opportunities. Bomb Bank is like a "bomb"
ÜRÜNÜ SATIN ALMADAN ÖNCE LÜTFEN AŞAĞIDAKİ BİLGİLERİ OKUYUNUZ! Apollo Pips PLUS SP benzersiz bir üründür! YENİ "APOLLO PIPS" GÖSTERGEMİ ARTI TÜM İŞLEM GÖSTERGELERİME ERİŞİM İLE "SÜPER PAKET" BONUSUNU ALMAK İSTEYENLER İÇİN! Apollo Pips PLUS SP ürününü satın alarak aslında Apollo Pips göstergemin tamamen yeni bir versiyonunu satın almış oluyorsunuz. Göstergenin bu sürümü, geliştirilmiş bir algoritmaya ve kullanımı kolay bir parametreye sahiptir; bu, size göstergeyi herhangi bir piyasada ve herhangi
NAM Order Blocks
NAM TECH GROUP, CORP.
5 (1)
MT4 Multi-timeframe Order Blocks detection indicator. Features - Fully customizable on chart control panel, provides complete interaction. - Hide and show control panel wherever you want. - Detect OBs on multiple timeframes. - Select OBs quantity to display. - Different OBs user interface. - Different filters on OBs. - OB proximity alert. - ADR High and Low lines. - Notification service (Screen alerts | Push notifications). Summary Order block is a market behavior that indicates order collection
RelicusRoad Pro
Relicus LLC
4.64 (103)
Şimdi 147 $ (birkaç güncellemeden sonra 499 $ 'a yükseliyor) - Sınırsız Hesaplar (PC'ler veya Mac'ler) RelicusRoad Kullanım Kılavuzu + Eğitim Videoları + Özel Discord Grubuna Erişim + VIP Durumu PİYASAYA BAKMAK İÇİN YENİ BİR YOL RelicusRoad, forex, vadeli işlemler, kripto para birimleri, hisse senetleri ve endeksler için dünyanın en güçlü ticaret göstergesidir ve yatırımcılara kârlı kalmaları için ihtiyaç duydukları tüm bilgileri ve araçları sağlar. Başlangıç ​​seviyesinden ileri seviyey
Indicator : RealValueIndicator Description : RealValueIndicator is a powerful tool designed specifically for trading on the EURUSD pair. This indicator analyzes all EUR and USD pairs, calculates their real currency strength values, and displays them as a single realistic value to give you a head start on price. This indicator will tell you moves before they happen if you use it right. RealValueIndicator allows you to get a quick and accurate overview of the EURUSD currency pair tops and bottoms,
This indicator is based on the Gann Signal indicator and acts as a market scanner. All you need to do is fill in the selected currency pairs in the settings and that’s it. Next, the indicator itself will view all these currency pairs and time frames from M5 to D1 simultaneously. When a new signal appears, the indicator will give you an Alert and also draw the letter N where this new signal will be.
Dynamic Forex28 Navigator - The Next Generation Forex Trading Tool CURRENTLY 49% OFF. Dynamic Forex28 Navigator is the evolution of our long-time, popular indicators, combining the power of three into one: Advanced Currency Strength28 Indicator  (695 reviews) + Advanced Currency IMPULSE with ALERT  (520 reviews) + CS28 Combo Signals (recent Bonus) Details about the indicator What Does This Next-Generation Strength Indicator Offer? Everything you loved about the originals, now enhanced with ne
MT4 için Astronomi Göstergesini Tanıtıyoruz: En İleri Göksel Ticaret Arkadaşınız Ticaret deneyiminizi göksel seviyelere yükseltmeye hazır mısınız? MT4 için devrim niteliğindeki Astronomi Göstergemizi arayın. Bu yenilikçi araç karmaşık algoritmaları kullanarak eşsiz astronomik içgörüler ve hassas hesaplamalar sunmak için geleneksel ticaret göstergelerini aşmaktadır. Bilgi Evreni Parmaklarınızın Ucunda: Göksel verilerin hazinelerini açığa çıkaran kapsamlı bir paneli gözlemleyin. Gezegenlerin geo/h
Sizlere ON Trade Waves Patterns Harmonic Elliot Wolfe'u tanıtmaktan mutluluk duyarız. Bu, manuel ve otomatik yöntemleri kullanarak piyasada çeşitli desenleri tespit etmek için tasarlanmış gelişmiş bir göstergedir. İşte nasıl çalıştığı: Harmonik Desenler: Bu gösterge, grafiğinizde görünen harmonik desenleri tanımlayabilir. Bu desenler, Scott Carney'in "Harmonic Trading vol 1 & 2" adlı kitabında açıklandığı gibi harmonik ticaret teorisini uygulayan tüccarlar için önemlidir. Onları manuel olarak ç
ECM Elite Channel is a volatility-based indicator, developed with a specific time algorithm, which consists of finding possible corrections in the market. This indicator shows two outer lines, an inner line (retracement line) and an arrow sign, where the channel theory is to help identify overbought and oversold conditions in the market. The market price will generally fall between the boundaries of the channel. If prices touch or move outside the channel, it's a trading opportunity. The
TrendMaestro
Stefano Frisetti
5 (3)
note: this indicator is for METATRADER4, if you want the version for METATRADER5 this is the link:  https://www.mql5.com/it/market/product/108106 TRENDMAESTRO ver 2.4 TRENDMAESTRO recognizes a new TREND in the bud, he never makes mistakes. The certainty of identifying a new TREND is priceless. DESCRIPTION TRENDMAESTRO identifies a new TREND in the bud, this indicator examines the volatility, volumes and momentum to identify the moment in which there is an explosion of one or more of these data a
3 Indicators in 1 indicator Strategy based on price action Made specifically for the best forex currency pairs Can be used in the best time frame of the market at a very reasonable price This indicator is basically 3 different indicatos . But we have combined these 3 indicators in 1 indicator so that you can use 3 indicators at the lowest price. All three strategies are based on price action. But based on different trends. Long term, medium term and short term Attributes : No repaintin
Full STO
Roman Smoroda
Tam STO göstergesi (üç STO göstergesinin tüm sürümlerini içerir: Premium, Gold, Silver) - STABLE TRADE OPTION, otomatik ikili opsiyon ticareti için tasarlanmıştır.  DİKKATLİCE OKUYUN!!!!! ÖNEMLİ Bir terminalde farklı sürelere sahip iki şablon oluşturun: 18:01, 18:02 için 1 ila 15 dakika arasında süreleri olan bir şablon ve 22:00 için 10 ila 20 dakika arasında süreleri olan bir şablon. Kazanma oranı: Son 5 yılda %71 Para yönetimi: Mevduattan %0,3 Göstergenin bu sürümü yalnızca Gümüş ve
How to use Pair Trading Station Pair Trading Station is recommended for H1 time frame and you can use it for any currency pairs. To generate buy and sell signal, follow few steps below to apply Pair Trading Station to your MetaTrader terminal. When you load Pair Trading Station on your chart, Pair Trading station will assess available historical data in your MetaTrader platforms for each currency pair. On your chart, the amount of historical data available will be displayed for each currency pai
MT My Way
Issara Seeboonrueang
Best strategy,  Easy trade ,  Support of version update in the future MT My Way:  For new traders with no experience It is a very simple trade. Open the order when there is signal and close the order when there is exit or found the next opposite signal. You can set Stop Loss at the arrow and set the distance at Arrow Gap. For experienced traders, It will be very easy to trade. indicator for trade by yourself TRADE: Forex  TIME FRAME:  All Time Frame (Not M1) SYMBOL PAIR: All Sy
" ZigZag on Trend " göstergesi, fiyat hareketinin yönünü belirlemenin yanı sıra bir çubuk ve pip hesaplayıcıdır. Zikzak şeklinde sunulan bir trend çizgisi ile fiyatın yönünü izleyen bir trend göstergesi ve trend yönünde geçen çubuk sayısını ve dikey ölçekteki nokta sayısını hesaplayan bir sayaçtan oluşur. (Hesaplamalar çubuğun açılmasıyla yapılır) Gösterge yeniden çizilmez. Kolaylık sağlamak için renkli çubuklar veya çizgiler şeklinde tasarlanmıştır. Tüm TF'lerde kullanılabilir, ancak en iyisi M
Gann Swing Structure
Kirill Borovskii
5 (1)
This indicator is based on the mathematics of the great trader W.D. Ganna. With its help, you can easily find strong levels by analyzing swings to find the optimal entry point. The indicator works on all instruments and all timeframes. The indicator is fully manual and has control buttons. All you need to do is press the NEW button, a segment will appear, which you can place on any movement, swing or even 1 candle that you want to analyze. By placing the segment, press the OK button. A grid (th
Septermber OFFER 85% OFF next price for unlimited version will be 2500$. This is the only time you can get this institutional and professional indicator at this price for unlimited version. Don't dare to miss this. The tool I am about to introduce to you you can't compare it with other tools due to its strategy and accuracy level in predicting the next price directional movement. This tool is designed for serious traders who have decided to make a difference through trading. Be the next person t
Dear Traders this is my another tool called " Swing Master Indicator ". As the name above the indicator is designed to help you in swing trading by capturing the low and highs of the price. You may us this tool with any trading strategy and style from scalping to position trading. It is made for level of traders including newbies and advanced traders even prop-firms, hedge funds and banks to help them make sold market analysis. I create tools for serious traders who want to make a difference in
Introduction to X3 Chart Pattern Scanner X3 Cherart Pattern Scanner is the non-repainting and non-lagging indicator detecting X3 chart patterns including Harmonic pattern, Elliott Wave pattern, X3 patterns, and Japanese Candlestick patterns. Historical patterns match with signal patterns. Hence, you can readily develop the solid trading strategy in your chart. More importantly, this superb pattern scanner can detect the optimal pattern of its kind. In addition, you can switch on and off individu
Moving pivot Average Fibonacci The  indicator compares the selected period with its counterpart from the previous period. The indicator determines the moving Fibonacci levels for the day or any time interval to assess the price movement range from the time average. The indicator helps predict the expected high or low for the day based on historical time data. The pivot line can be considered an average trend line and use it in a variety of trading strategies. If you have any question about t
İŞLEM HIZI, piyasada büyük emirlerin nerede ve ne zaman biriktiğini ve bunun faydalarını gösteren en kaliteli göstergedir. Trend değişikliklerini çok erken aşamada tespit eder. Aynı anda hem bir gösterge hem de bir ticaret sistemidir. Konsept benzersiz ve inanılmaz derecede karlı. Forex'te tik hacmi oldukça yanıltıcı bir şekilde hacim olarak adlandırılır. Aslında, fiilen İŞLEM HIZI olan birim zaman başına fiyat değişimidir. Bu gösterge, Forex'teki hacim fikrini mantıksal olarak doğru şekilde
Max Paynex
Abdulkarim Karazon
Max Payne, ok şeklinde sinyaller veren bir ters/trend sinyal göstergesidir, bu gösterge sinyalini aynı çubuk kapanışında verir, bu gösterge sinyallerin ikili/üçlü onayını almak için grafik üzerinde farklı periyotlarla birden çok kez düşebilir Gösterge, hiçbir zaman yeniden boyamaz veya arkasını boyamazken, herhangi bir ticaret stiline uyacak şekilde son derece ayarlanabilir; satın alma sonrasında, kullanılan şablonların yanı sıra ekran görüntülerinde gösterilen tüm sistemi elde edeceksiniz. ---
Please send me Direct message on MQL5 CHAT after purchasing the Indicator for Training and Installation Support There are some additional files that is important to use with the Indicator . So be sure to contact me after purchasing the Indicator So that I can add you for training and support . If you find any difficulty with installation then send me Direct message here So that I can connect with you via Anydesk or Teamview for the product installation. " Smart Order Block Indicator " to find
The indicator is designed to work on any trading platform. The program is based on proprietary algorithms and W.D.Ganna's mathematics, allowing you to calculate target levels of price movement based on three points with the highest degree of certainty. It is a great tool for stock trading. The indicator has three buttons: NEW - call up a triangle for calculation. DEL - delete the selected triangle. DELS - completely remove all constructions. The probability of achieving the goals is more than 80
Precision Index Osilatörü (Pi-Osc) - Precision Trading Systems'dan Roger Medcalf Sürüm 2, grafiklerinizde hızlı bir şekilde yüklenmek üzere dikkatle yeniden kodlandı ve deneyimi artırmak için bazı teknik geliştirmeler de içerdi. Pi-Osc, herkesin stoplarını almak için zorlanan pazarların gitmek zorunda kaldığı aşırı yorgunluk noktalarını bulmak için tasarlanmış doğru ticaret zamanlama sinyalleri sunmak amacıyla oluşturuldu. Bu ürün, aşırı noktaların nerede olduğunu bilmek gibi yaşlı bir so
Full Forex Market View Dashboard
Opengates Success International
5 (2)
TAM FOREX PİYASASI GÖRÜNÜMÜ Pano Göstergesi Bu, Yatırımcılara piyasada neler olup bittiğine dair tam bir görüş sağlamak için oluşturulmuş özel bir göstergedir. Piyasaya erişmek ve başarılı ticaret yapmak için gereken her türlü bilgiyi görüntülemek için gerçek zamanlı bir veri kullanır. KURULUM: Bu Göstergeyi pencere grafiğinize eklemeden önce, MT4'ünüzün Piyasa İzleme paneline gidin ve ihtiyaç duymadığınız veya ticaret yapmadığınız tüm Döviz çiftlerini GİZLEYİN ve geri kalanını orada bı
Yazarın diğer ürünleri
Level Breakout Indicato r , üst ve alt sınırlardan çalışan, trendin yönünü belirleyebilen bir teknik analiz ürünüdür. Yeniden çizim veya gecikme olmadan mum 0 üzerinde çalışır. Çalışmasında, parametreleri önceden yapılandırılmış ve dönemlerin derecelendirmesini gerçekleştiren tek bir parametre olan " Scale " halinde birleştirilmiş farklı göstergelerden oluşan bir sistem kullanır. Göstergenin kullanımı kolaydır, herhangi bir hesaplama gerektirmez; tek bir parametre kullanarak, seçilen zaman dil
Volatility Trend System - girişler için sinyaller veren bir ticaret sistemi. Oynaklık sistemi, trend yönünde doğrusal ve noktasal sinyaller ve ayrıca yeniden çizme ve gecikme olmaksızın trendden çıkmak için sinyaller verir. Trend göstergesi, orta vadeli trendin yönünü izler, yönünü ve değişimini gösterir. Sinyal göstergesi volatilitedeki değişikliklere dayalıdır ve piyasa girişlerini gösterir. Gösterge, çeşitli uyarı türleri ile donatılmıştır. Çeşitli alım satım araçlarına ve zaman dilimler
Candle Binary Scalper , forex ve ikili opsiyonlar için teknik analiz ürünüdür. Bir ticaret sisteminde birleştirilmiş birkaç teknik gösterge içerir. Ölçeklendirme ve ikili opsiyonlar için bir trend içinde manuel ticaret için uygundur. Tüm zaman dilimlerinde ve ticaret enstrümanlarında çalışır. Yüksek volatilite durumunda M15, M30, H1 ve H4, M5 ve M1 ticareti için Önerilen Zaman Çerçeveleri kullanılmalıdır. Birkaç uyarı türü vardır. ürün nasıl kullanılır Her Zaman Çerçevesi için en uygun ay
Scalping Entry Points - fiyat hareketlerine uyum sağlayabilen ve yeniden çizmeden alım satımları açmak için sinyaller verebilen manuel bir alım satım sistemidir. Gösterge, merkezi destek ve direnç seviyesine göre trendin yönünü belirler. Nokta göstergesi, girişler ve çıkışlar için sinyaller sağlar. Manuel gün içi ticaret, ölçeklendirme ve ikili opsiyonlar için uygundur. Tüm zaman dilimlerinde ve ticaret enstrümanlarında çalışır. Gösterge birkaç türde uyarı verir. ürün nasıl kullanılır Mavi
Scalping and Binary Signal Detector - Trend boyunca pozisyon açmak için yön sinyalleri veren Scalping göstergesi. Gösterge, Forex ve ikili opsiyonlar için kullanılabilecek eksiksiz bir ticaret sistemidir. Algoritma sistemi, birbirini takip eden birkaç çubuktaki yoğun fiyat hareketlerini tanımanıza olanak tanır. Gösterge, oklar için çeşitli uyarı türleri sağlar. Tüm alım satım enstrümanları ve zaman dilimleri üzerinde çalışır (M5 veya Üzeri önerilir). Ticaret için nasıl kullanılır Sarı b
" ZigZag on Trend " göstergesi, fiyat hareketinin yönünü belirlemenin yanı sıra bir çubuk ve pip hesaplayıcıdır. Zikzak şeklinde sunulan bir trend çizgisi ile fiyatın yönünü izleyen bir trend göstergesi ve trend yönünde geçen çubuk sayısını ve dikey ölçekteki nokta sayısını hesaplayan bir sayaçtan oluşur. (Hesaplamalar çubuğun açılmasıyla yapılır) Gösterge yeniden çizilmez. Kolaylık sağlamak için renkli çubuklar veya çizgiler şeklinde tasarlanmıştır. Tüm TF'lerde kullanılabilir, ancak en iyisi M
Channel Cluster
Vitalyi Belyh
5 (1)
Cluster indicator working in the price channel. For operation, the indicator builds a channel line - (dashed line). Inside the channel, cluster sections are determined that determine the direction of the price movement - (histograms in two directions), start with large arrows. Small arrows are plotted above / below each histogram - indicator increase volatility. The indicator does not redraw the values. Works on any tools and timeframes. Entrances are made when large arrows appear, inside s
Dönüm noktalarını tanıyan bir dizi gösterge. İki MA'dan çıkarıldıktan sonra mum çubuğu kombinasyonlarının üst ve alt seviyelerini tespit eder. Erken girişlerin kullanıldığı ticaret sistemleri için geçerlidir. Ölçeklendirme ve gün içi ticaret için trend boyunca kullanılabilir ve erken aşamalarda trendin tersine döndüğünü tespit etmek için kullanılabilir. Olasılıklar Parametreler, herhangi bir zaman dilimi ve ticaret aracı için esnek ayarlar sağlar. Sinyaller için çeşitli uyarı türleri vard
Özellikle scalping için tasarlanmış, volatilite dürtülerini tanımlayabilen ve sürelerini gösterebilen teknik bir gösterge. Göstergenin işlevselliğini herhangi bir ticaret aracına uygulamanıza olanak tanıyan, manuel ayarlar için esnek parametrelere sahiptir. Kullanılması Önerilen Zaman Çerçeveleri M5, M15, M30, H1 ve H4'tür. Birkaç tür uyarı vardır. Mumun kapanışında tüm sinyaller asla değişmez veya yeniden renklenmez. Gösterge yukarıdan aşağıya parametrelerle yapılandırılır. Trend Lengt
Forex için manuel ticaret ve teknik analiz göstergesi. İşlem gününün açılış seviyesini gösteren bir trend göstergesi ve giriş noktalarını belirlemek için bir ok göstergesinden oluşur. Gösterge yeniden renklenmez; mum kapandığında çalışır. Sinyal okları için çeşitli uyarı türleri içerir. Herhangi bir grafikte, alım satım aracında veya zaman diliminde çalışacak şekilde yapılandırılabilir. Çalışma stratejisi trend boyunca fiyat hareketlerini aramaya dayanmaktadır.  " Buy " işlemleri ya
Volatility Trend System , girişler için sinyaller sağlayan bir ticaret sistemidir. Volatilite sistemi, trend yönünde doğrusal ve nokta sinyallerinin yanı sıra, yeniden çizme veya gecikme olmadan trendden çıkış sinyallerini de verir. Trend göstergesi orta vadeli trendin yönünü izler, yönünü ve değişimini gösterir. Sinyal göstergesi oynaklıktaki değişikliklere dayanır ve piyasaya girişleri gösterir. Gösterge çeşitli uyarı türleri ile donatılmıştır. Çeşitli ticaret araçlarına ve zaman diliml
Wave Reversal Indicator - determines the direction of trend waves and price reversals. The indicator shows wave movements and trend directions. It gives recommendations where to follow the trader, helps to follow the trading strategy. It is an addition to an intraday or medium-term strategy. Almost all parameters are selected for each time frame and are changed automatically, the only parameter for manual adjustment is the wavelength. Works on various trading instruments and timeframes, rec
FREE
Zig-Zag indicator with additional signals for inputs. Visually easy to use: The red zig-zag line is an uptrend. The blue zig-zag line is a downward trend. Arrows in the form of additional signals. Works on any trading pairs. On any timeframe. Not redrawn. Input parameters Zig-Zag Period - Zig-zag period (from 5) Signal Period - period of signal arrows (from 3) Alerts for signals Play sound - Sound alert Display pop-up message - Notification by message on the screen Send push not
FREE
Dönüm noktalarını tanıyan bir dizi gösterge. İki MA'dan çıkarıldıktan sonra mum çubuğu kombinasyonlarının üst ve alt seviyelerini tespit eder. Erken girişlerin kullanıldığı ticaret sistemleri için geçerlidir. Ölçeklendirme ve gün içi ticaret için trend boyunca kullanılabilir ve erken aşamalarda trendin tersine döndüğünü tespit etmek için kullanılabilir. Olasılıklar Parametreler, herhangi bir zaman dilimi ve ticaret aracı için esnek ayarlar sağlar. Sinyaller için çeşitli uyarı türleri vard
Candle Power Signals , ticaret kararları vermek için potansiyel değişken sinyalleri arama stratejisini kullanan bir trend göstergesidir. Gösterge, piyasayı analiz ederek, yönlü trend hareketi içinde artan ve azalan volatilite bölgelerini tanımlar. Ana sinyal oluşturma parametreleri halihazırda yapılandırılmıştır; geri kalan ayarlar ve periyotlar, manuel yapılandırma için 2 parametreye endekslenmiştir: 1. "Candle calculation method" - 2 sinyal oluşturma modu, zaman dilimlerinde normal olanın
Level Breakout Indicato r , üst ve alt sınırlardan çalışan, trendin yönünü belirleyebilen bir teknik analiz ürünüdür. Yeniden çizim veya gecikme olmadan mum 0 üzerinde çalışır. Çalışmasında, parametreleri önceden yapılandırılmış ve dönemlerin derecelendirmesini gerçekleştiren tek bir parametre olan " Scale " halinde birleştirilmiş farklı göstergelerden oluşan bir sistem kullanır. Göstergenin kullanımı kolaydır, herhangi bir hesaplama gerektirmez; tek bir parametre kullanarak, seçilen zaman dil
Max Min Reversal Arrows MT5 - an arrow reversal indicator for predicting price movement. The indicator is built on the support and resistance levels at the local lows and highs of the price. Product features Arrows appear on the current candle. The indicator does not redraw. Can be used on all time frames and trading instruments. Recommended timeframes to use M30, H1, H4. The dotted lines are the support and resistance levels within the signal. Price movement from these levels means a reve
BB Reversal Arrows Teknik Ticaret Sistemi, perakende kararları almak için ters noktaları tahmin etmek için geliştirilmiştir. Mevcut pazar durumu gösterge ile analiz edilir ve çeşitli kriterler için yapılandırılır: ters anlar beklentisi, potansiyel dönüm noktaları, satın alma ve satış sinyalleri. Gösterge fazla bilgi içermez, tüccarların makul kararlar vermesine izin veren görsel anlaşılabilir bir arayüze sahiptir. Tüm oklar mumu kapatıyor gibi görünüyor, yeniden çizim yapmadan, birkaç uyarı
Ticaret ve piyasa yönünü tahmin etmek için döngüsel gösterge. Fiyatın döngüsel davranışını osilatör biçiminde gösterir. Osilatörün üst ve alt sınırlarından bir geri dönüş olduğunda, işlem açılmasına yönelik sinyaller verir. Histogram biçiminde trendin yumuşatılmış gücünü gösterir.  Ölçeklendirmeden gün içi işlemlere kadar her türlü ticaret stratejisini tamamlayacak.  Gösterge yeniden çizilmez.  Tüm sembollerde/aletlerde kullanıma uygundur.  Kısa vadeli işlemler için uygun zaman dilimleri M5,
Fiyat kanalının göstergesi ve içindeki kesme noktası oluşturucu. Kullanım süresine göre fiyatın konumu hakkında fikir verir. Giriş ve çıkış anlarını belirleyen kanal sınırları ve sıçrama noktaları boyunca oluşturulmuş düzleştirilmiş trend sıçrama çizgileri içerir. Çeşitli ticaret enstrümanları ve zaman dilimleri üzerinde çalışır. gösterge ile nasıl çalışılır Kanal kesme çizgisini takip edin, mavi çizgi yukarı girişler, pembe çizgi aşağı girişler. Giriş noktaları mevcut mum üzerinde oluşt
A trend indicator showing the strength of bulls and bears in a trading range. Consists of two lines: The green line is a balanced overbought/oversold condition. The red line is the direction of trading activity. Does not redraw calculations. Can be used on all Symbols/Instruments/Time Frames. Easy to use and set up. How to use the indicator and what it determines. The basic rule is to follow the direction of the red line: if it crosses the green line from the bottom up, the market i
FREE
Smoothed oscillator based on basic DeMarker indicators. Shows the volatility of the price direction. Can be used to determine intraday entry and exit points from the market. Suitable for use on all time frames and trading instruments. It is recommended to use on M5, M15 and M30. The green line shows the price direction up, the blue line shows the price direction down. The red line is a smoothed representation of the price. Input parameters      Period - Period of the main indicator DeMarker
FREE
Lines Channel Pro
Vitalyi Belyh
5 (1)
The "Lines Channel Pro" indicator determines price reversals from the High/Low channel. Contains a built-in trend finder, signal lines, entry and exit points. The recommended timeframe for M15 to work is D1. For each timeframe and trading instrument, depending on the volatility, it is necessary to select individual settings. Does not redraw calculations. Input parameters Use Channel trend filter - Turn on/off the trend filter Channel trend period - Trend filter period (from 8 and abov
Arrow indicator with trend filter. Generates trend input without delays or delays - on the emerging candle. Suitable for use on any trading tools and timeframes. Easy to use, contains the direction of the trend in the form of a histogram lines and signal generator. Input parameters Period Trend Line - Period of the Histogram Line Signal Generator Period - If the period is longer, then the arrows are less Play sound Display pop-up message Send push notification Send email Sound file signal -
An indicator that determines the point levels of price resistance. The arrows indicate price bounces in the indicated directions. Arrows are not redrawn formed on the current candle, shown on the previous candle for convenience.      It has one setting - the formation intensity: If the parameter is smaller, most of the signals are formed in a wide trend. If the parameter is larger, signals are formed in a narrower trend. Input parameters Formation Intensity - Arrow Formation Intensity Num
A technical indicator that calculates its readings based on trading volumes. It has an oscillatory line that follows the change in volumes. Large arrows on the line indicate reversal values. A channel is built around the line with small arrows showing the strengthening of price movement in the direction of increasing volumes. The indicator does not redraw values. Works on any instrument and timeframe. It can complement any trading strategy by finding a trend or make entries in the direction of
Max Min Reversal Arrows - an arrow reversal indicator for predicting price movement. The indicator is built on the support and resistance levels at the local lows and highs of the price. Product features Arrows appear on the current candle. The indicator does not redraw. Can be used on all time frames and trading instruments. Recommended timeframes to use M30, H1, H4. The dotted lines are the support and resistance levels within the signal. Price movement from these levels means a reversal.
Scalping Entry Points - fiyat hareketlerine uyum sağlayabilen ve yeniden çizmeden alım satımları açmak için sinyaller verebilen manuel bir alım satım sistemidir. Gösterge, merkezi destek ve direnç seviyesine göre trendin yönünü belirler. Nokta göstergesi, girişler ve çıkışlar için sinyaller sağlar. Manuel gün içi ticaret, ölçeklendirme ve ikili opsiyonlar için uygundur. Tüm zaman dilimlerinde ve ticaret enstrümanlarında çalışır. Gösterge birkaç türde uyarı verir. ürün nasıl kullanılır Mavi
Alım satım yapmak, piyasa durumunu analiz etmek ve tahmin etmek için bir trend aracı. Gösterge, günlük veya haftalık trend dalgaları için kılavuz görevi gören bir kılavuz çizgi içerir. Ve işlem hacimlerini analiz eden özel bir osilatör. Aşırı alım ve satım piyasalarının dönemlerini gösterir ve olası bir fiyat hareketinin başlangıcında giriş noktalarını belirler. Gösterge yeniden çizilmez ve gecikmez. Herhangi bir enstrüman ve Zaman Çerçevesi üzerinde çalışır. Gösterge grafiği yüklemez, yaln
Binary Lines , para birimleri, emtialar, kripto para birimleri, hisse senetleri, endeksler ve herhangi bir finansal araç için teknik bir analiz göstergesidir. İkili opsiyonlar veya Forex ölçeklendirme için kullanılabilir. Giriş ve çıkış noktalarını sabit aralıklarla gösterir ve tüccarlar olası işlemlerin sonuçları hakkında gerekli bilgileri. Giriş noktaları, mumun en başında, MA çizgisi yönünde, süre boyunca oluşturulur. çubuklardaki işlemler manuel olarak ayarlanabilir ve herhangi bir finansal
Filtrele:
İnceleme yok
İncelemeye yanıt