• Genel bakış
  • İncelemeler (1)
  • Yorumlar (5)
  • Yenilikler

VolumeSecret

VolumeSecret: Volume’un Gücü Elinizde

Programlama dünyasında karşılaştığımız zorluklar, sürekli olarak büyümemize ve gelişmemize neden olur. Pazarın getirdiği zorlukları ve traderların en yüksek performansa ulaşma mücadelesini derinden anlıyoruz. Bu yüzden, pazar kararlarını daha akıcı ve hassas hale getirmek için yenilikçi çözümler üzerinde durmaksızın çalışıyoruz.

VolumeSecret, bu bağlılığın bir sonucudur. Bu gelişmiş göstergeler, hacim analizi ile sofistike bir stratejiyi birleştirerek piyasayı ustaca yönetmek isteyenlere belirleyici bir avantaj sunar.

🔍 VolumeSecret Nedir?

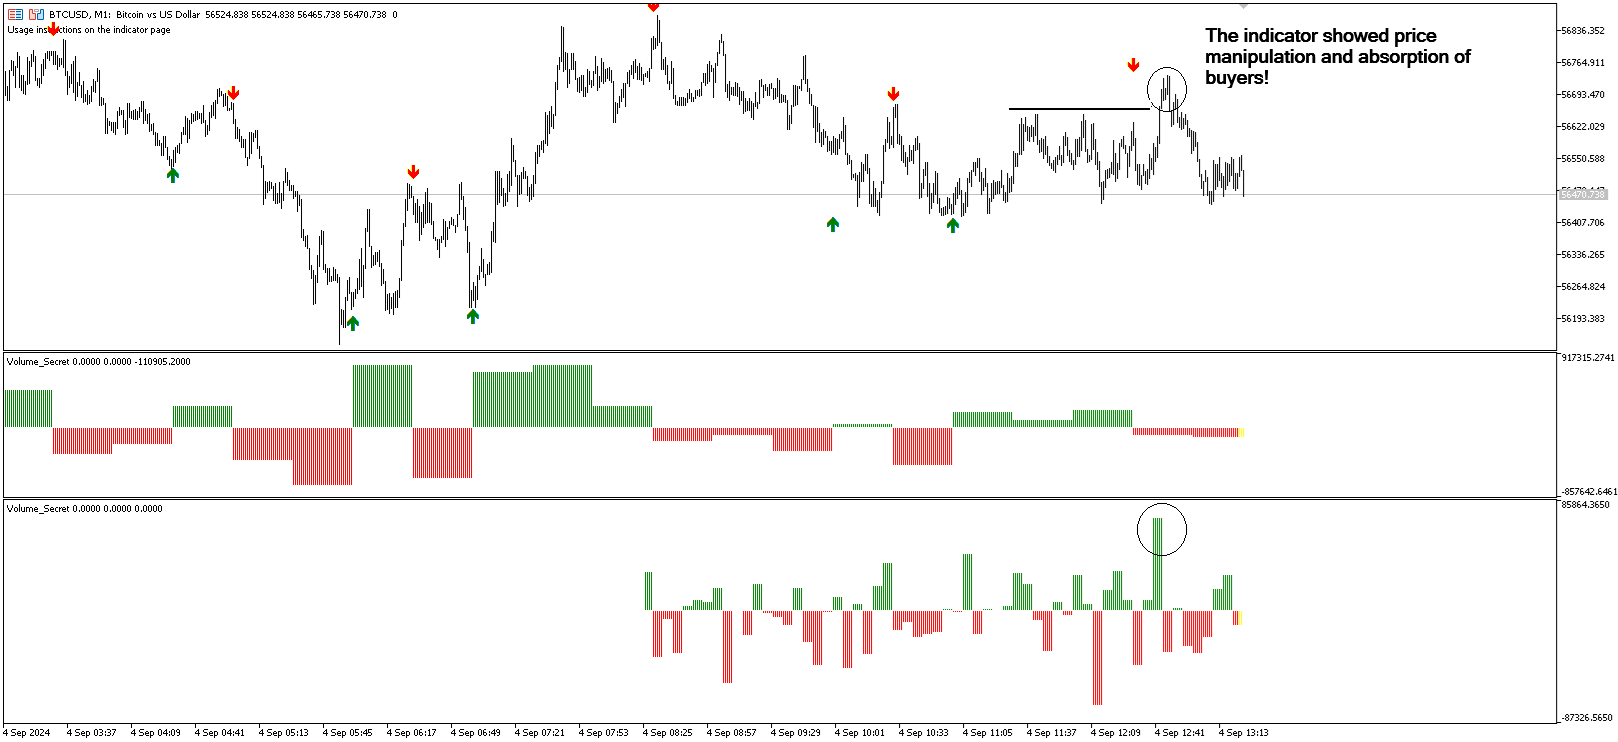
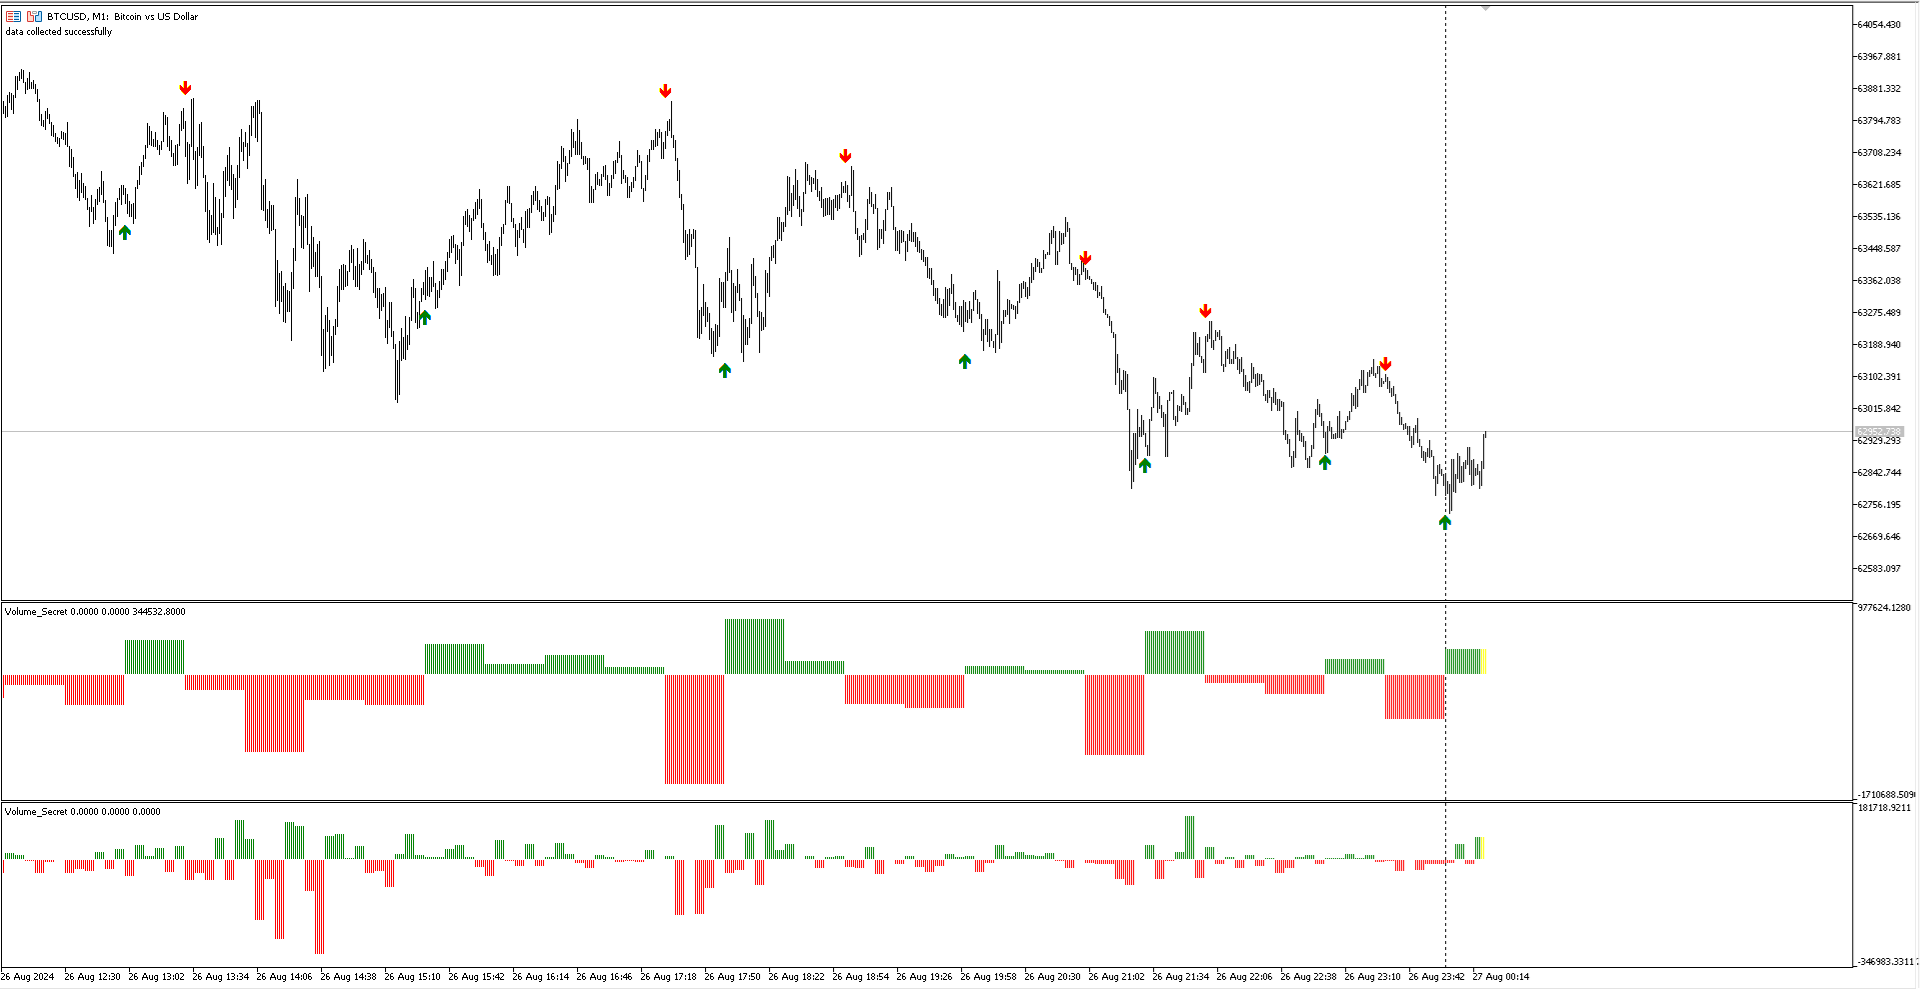
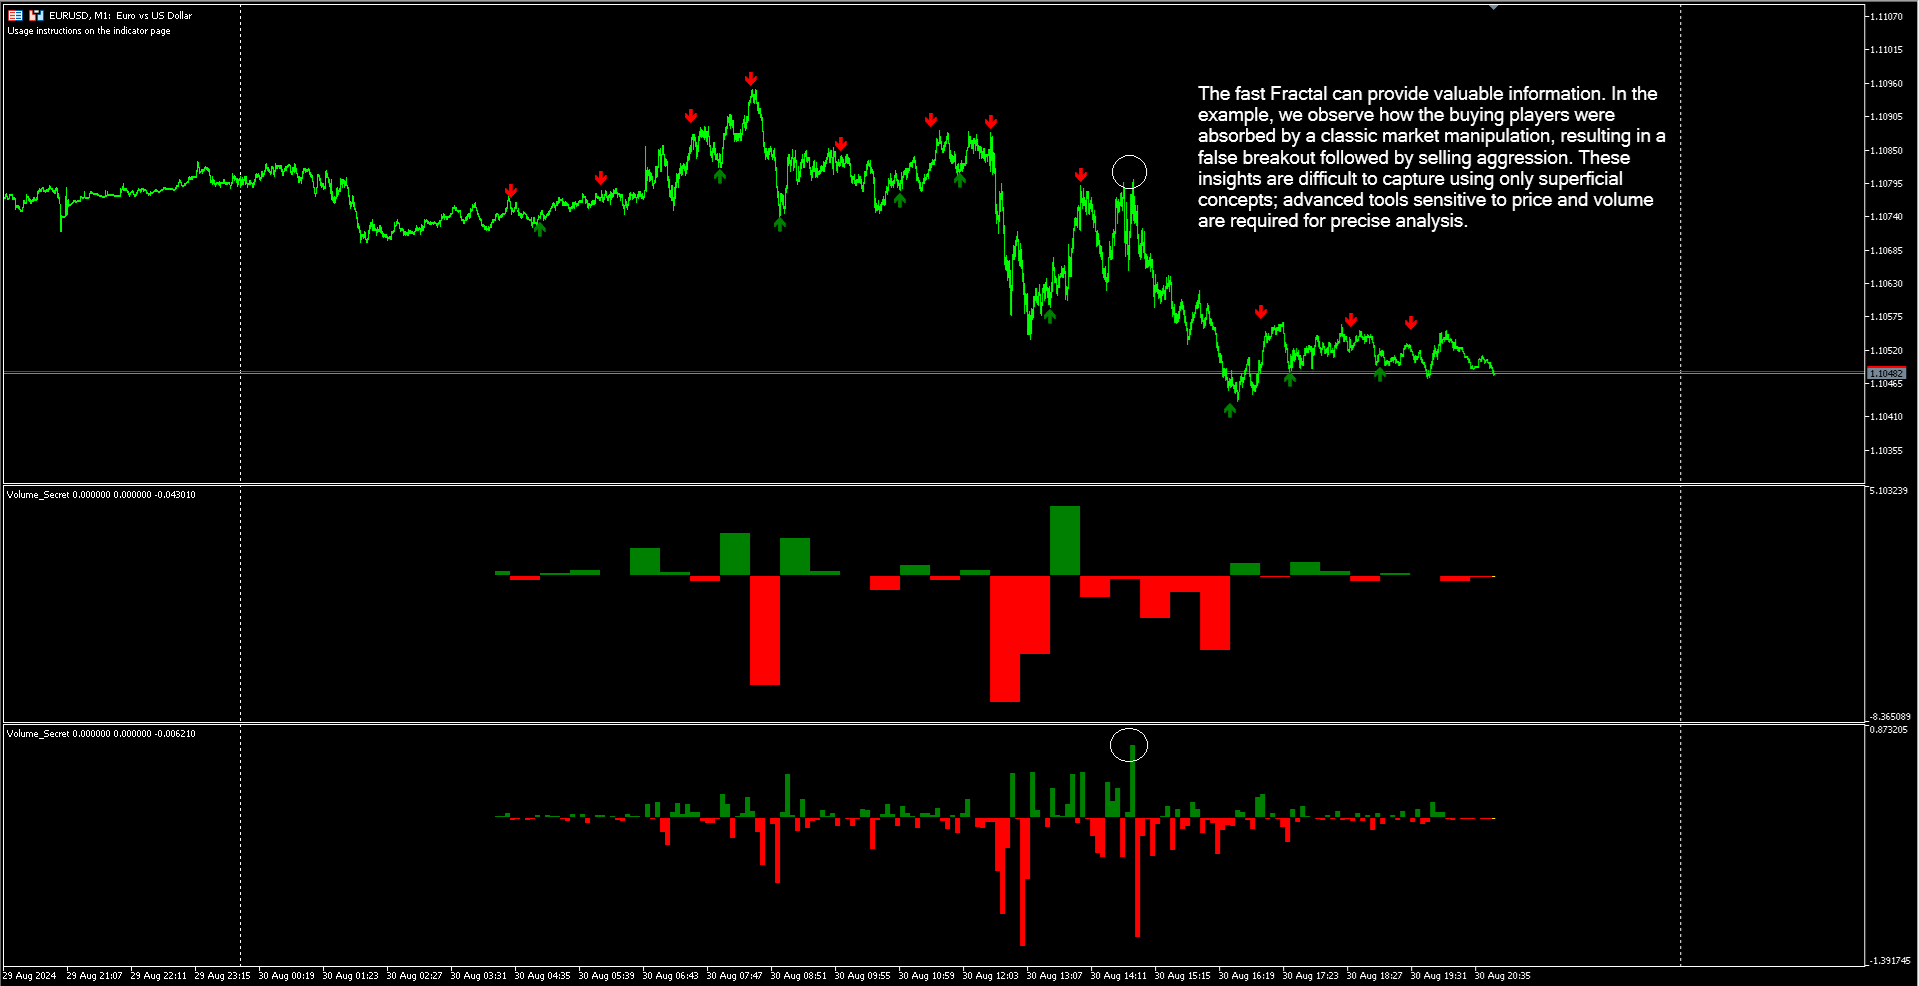
VolumeSecret, fiyat hareketlerinin arkasındaki sırları ortaya çıkarmak için tasarlanmış ileri düzey bir teknik göstergedir. Hacim analizini bir pusula olarak kullanarak, giriş ve çıkış fırsatlarını yüksek doğrulukla belirlemeye yardımcı olur. Fraktal geometri ve hacmi birleştirerek piyasa hareketlerini derinlemesine ve detaylı bir şekilde analiz eder.

🚀 VolumeSecret’in Faydaları

  • Derinlemesine Hacim Analizi: Kurumsal hareketleri ve gizli piyasa akışlarını tespit eder.
  • Hassas Sinyaller: İşlemlerinizi optimize etmek için net ve objektif uyarılar sunar.
  • Güçlü Strateji: Hacmi sağlam bir metodolojiyle birleştirerek kar potansiyelini maksimize eder.

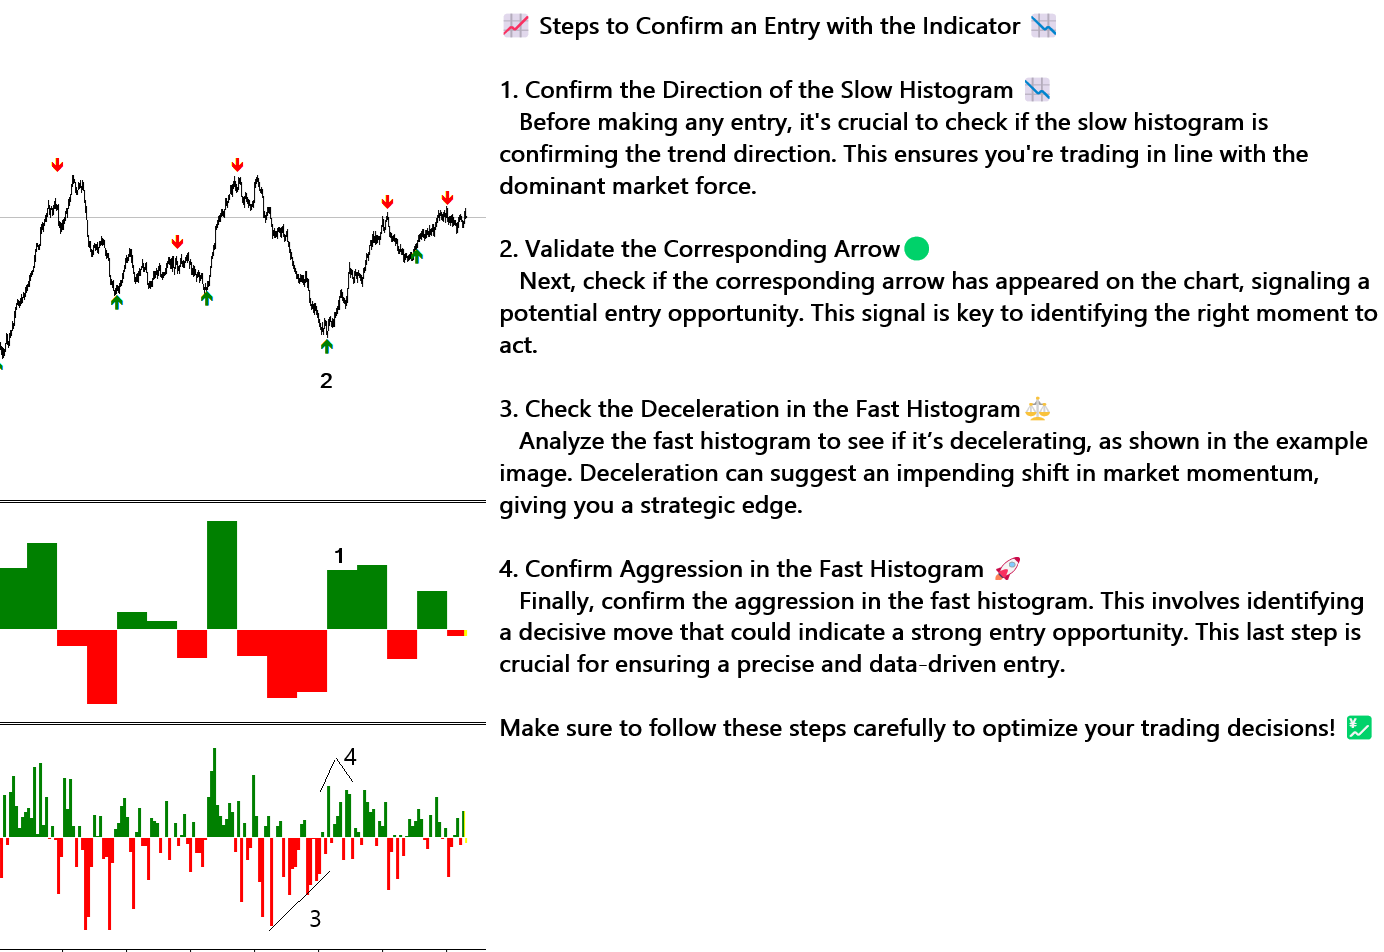
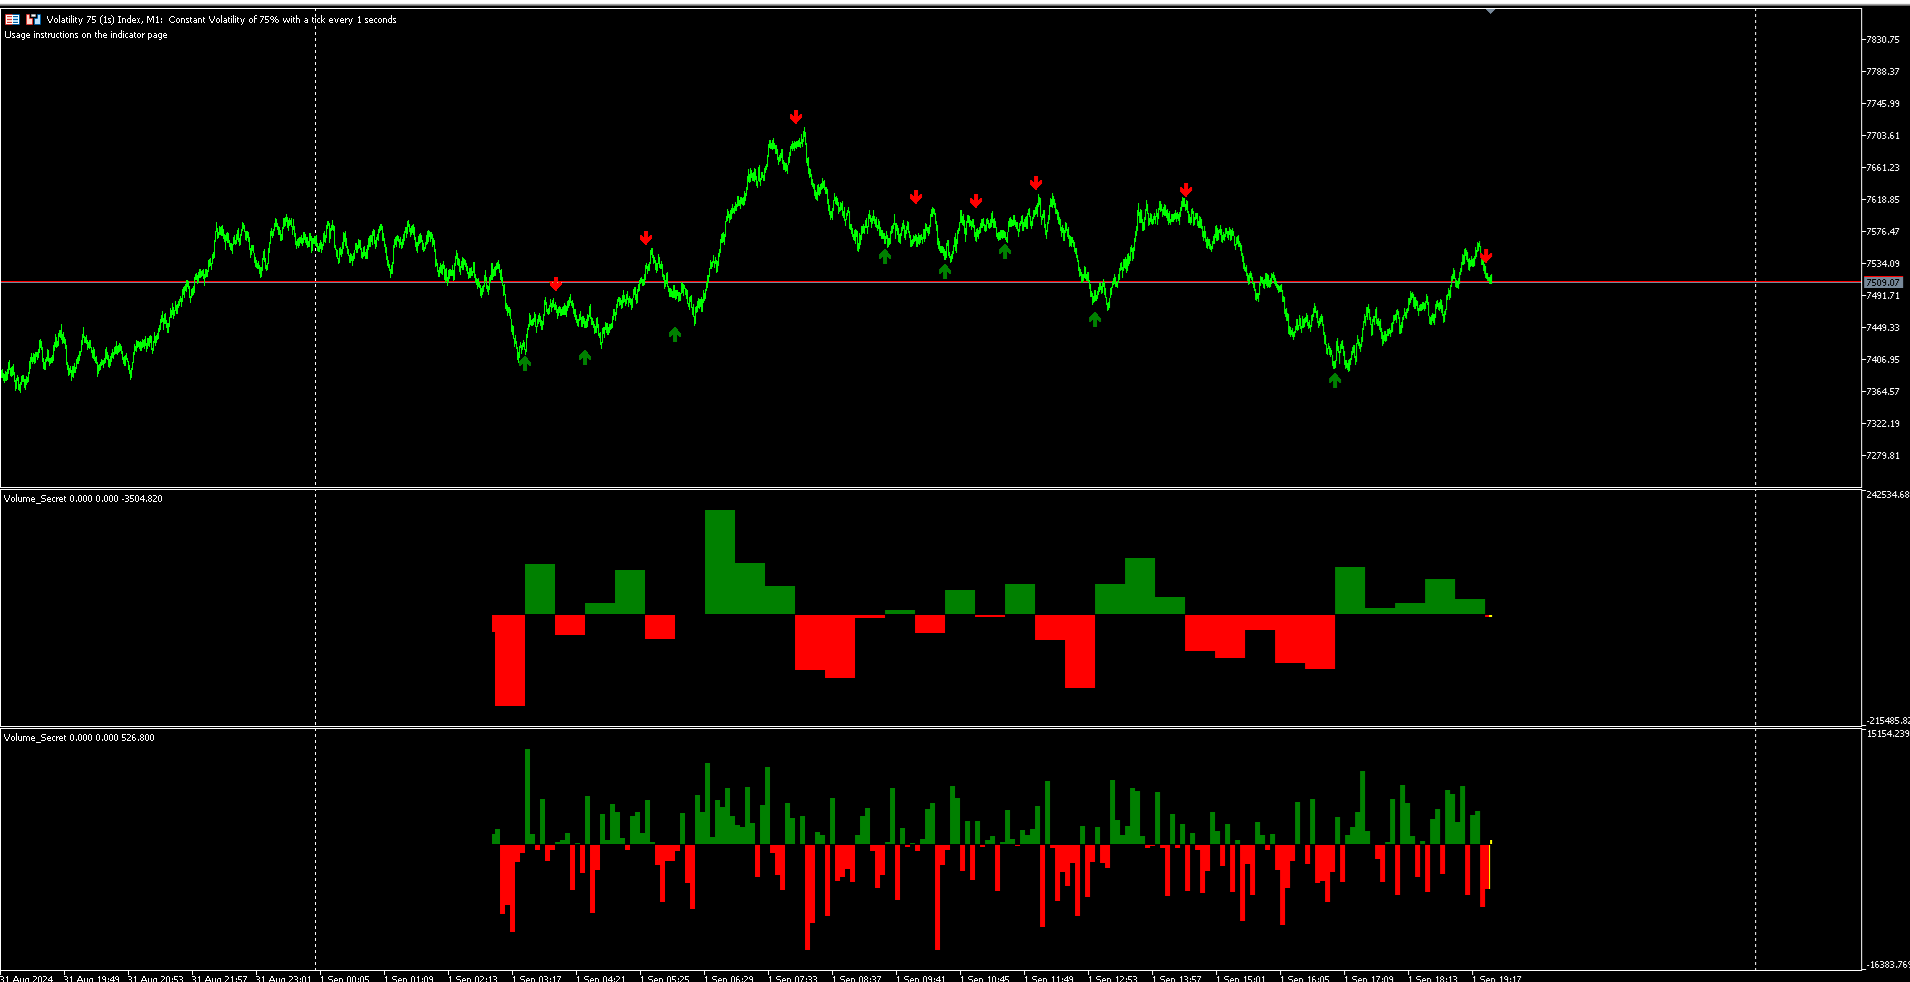
📈 VolumeSecret ile Bir Giriş Onayı İçin Adımlar 📉

  1. Yavaş Histogramın Yönünü Onaylayın 📉
    Herhangi bir giriş yapmadan önce, yavaş histogramın trend yönünü onaylayıp onaylamadığını kontrol edin. Bu, piyasanın baskın gücüyle uyumlu işlem yapmanızı sağlar.

  2. İlgili Ok’u Doğrulayın 🟢
    Daha sonra, grafik üzerinde ilgili ok’un görünüp görünmediğini kontrol edin; bu, potansiyel bir giriş fırsatını işaret eder. Bu sinyal, doğru eylem zamanını belirlemede kritik öneme sahiptir.

  3. Hızlı Histogramdaki Yavaşlamayı Kontrol Edin ⚖️
    Daha kısa bir zaman diliminde kullanılan hızlı histogramı analiz ederek yavaşlama belirtilerini kontrol edin. Bu histogram, fraktal ilkeler temelinde makro düzeyde projeksiyonları erken gösterir, bu da size stratejik bir avantaj sağlar.

  4. Hızlı Histogramdaki Saldırganlığı Onaylayın 🚀
    Son olarak, hızlı histogramdaki saldırganlığı doğrulayın. Bu, güçlü bir giriş fırsatını belirtebilecek belirleyici bir hareketi tanımlamayı içerir. Bu son adım, veri destekli ve doğru bir giriş sağlamada kritik öneme sahiptir.

💰 Sürüm 1.2: Artık Tüm Finansal Araçlarla Uyumludur

Sürüm 1.2 ile VolumeSecret, hisse senetleri, forex, kripto paralar, emtialar ve daha fazlası dahil olmak üzere tüm finansal araçlarla analiz yapacak ve işlem yapacak şekilde uyarlanmıştır. Bu güncelleme, göstergenin çok yönlülüğünü artırarak çeşitli piyasalarda optimize edilmiş analiz yapmanıza olanak tanır.

💬 Geri Bildiriminizin Önemi

Geri bildiriminiz, VolumeSecret’in sürekli gelişimi için hayati öneme sahiptir. Deneyimlerinizi paylaşarak, göstergenin traderların ihtiyaçlarına daha iyi cevap verecek şekilde iyileştirilmesine yardımcı oluyorsunuz. En iyi aracı sunmaya devam edebilmemiz için görüş ve önerilerinizi çekinmeden iletmenizi rica ederiz!


Önerilen ürünler
Introducing RSIScalperPro - the revolutionary RSI-based indicator for Metatrader 5, specifically designed for scalping in the one-minute chart. With RSIScalperPro, you'll have a powerful toolkit for precise entry and exit signals to take your trading to the next level. RSIScalperPro utilizes two different RSI indicators that provide clear signals for overbought and oversold areas. You can customize the time periods and limit values of the two RSIs according to your preferences to achieve the be
To get access to MT4 version please click here . - This is the exact conversion from TradingView: "Twin Range Filter" by " colinmck ". - This is a light-load processing and non-repaint indicator. - All input options are available.  - Buffers are available for processing in EAs. - You can message in private chat for further changes you need. Here is the code a sample EA that operated based on signals coming from the indicator: #include <Trade\Trade.mqh> CTrade trade; int handle_twr= 0 ; input gro
** All Symbols x All Time frames scan just by pressing scanner button ** *** Contact me  to send you instruction and add you in "Harmonic Scanner group" for sharing or seeing experiences with other users. Introduction Harmonic Patterns are best used to predict turning point. Harmonic Patterns give you high win rate and high opportunities for trade in during one day. This indicator detects the best and successful patterns based on Harmonic Trading concepts . The   Harmonic Patterns   Scanner   Sc
This Indicator adding power to traditional zigzag indicator. With High-Low numbers in vision it will be easier to estimate change of trend by knowing the depth of each wave. Information including points, pips, percentage%, and #bars can be displayed based on configuration. All information is real-time update. This indicator is especially useful in sideway market to buy low sell high.
When analyzing financial time series, researchers most often make a preliminary assumption that prices are distributed according to the normal (Gaussian) law. This approach is due to the fact that a large number of real processes can be simulated using the normal distribution. Moreover, the calculation of the parameters of this distribution presents no great difficulties. However, when applied to financial markets, normal distribution does not always work. The returns on financial instruments of
Best swing
Winsou Cedric Anicet Kpanou
-- BEST SWING  -- L'indicateur BEST SWING est un indicateur technique personnalisé, un excellent outil pour négocier les cassures en fonction des niveaux de support et de résistance horizontaux. L'indicateur BEST SWING utilise une formule complexe en analysant des données de prix autrement incongrues sur les cours de clôture de chaque période, ainsi que les hauts et les bas du prix, afin de donner un aperçu de la force ou de la faiblesse de la tendance du marché et de sa probabilité
Signal Eskiya, in addition to channel lines, reflects entry signals in the form of arrows. Trading strategies using the channel indicator belong to the classic methods of technical analysis, are easy to execute, and therefore available even to beginners. Price ranges work equally well on any trading assets and timeframes, they can be used both independently and with additional confirmation from oscillators and market volumes. American traders say: “Trend is your friend”, which means “Trend is
Here I present you this awesome indicator I made. This is a nique combination witch puts you in the same level as MM's. So you can surf a lot of waves and identify the rally time, breakouts, and the perfect time to get in the market. ---- The SSL Channel is a great all-rounder based on 2 Simple Moving Averages, one of recent Highs, one of recent Lows. The calculation prints a   channel   on the chart consisting of 2 lines. This strategy gives a Long signal when price closes above the top of the
Volume Bands Chart
Rafael Caetano Pinto
This indicator marks the relevant volume levels among the day. The two relevant levels are the candle with more volume and the period with more volume of lots transacted.  The filled red background is the range of price with the most relevant volume of the day (probably the big player that is command the game). The purple lines shows the range of price with most volume (probably a area where some big player is accumulating before force a market direction). There is also the dot lines that mark
This indicator is an extended implementation of Weis waves. It builds Weis waves on absolute volumes (which is the classical approach) or delta of volumes (unique feature) using different methods of wave formation and visualization. It works with real volumes, if available, or with tick volumes otherwise, but also provides an option to use so called "true volume surrogates", as an artificial substitution for missing real volumes (for example, for Forex symbols), which was introduced in correspo
White Weis Volume Ticks
Ricardo Almeida Branco
5 (3)
White Weis Volume This indicator shows the sum of the volume in each wave, bulish or bearish, as idealized by David Weis , but it brings an important addition , which is the marking of the bar with the highest volume of the wave (White Bar)! In coding the indicator, it was sought to optimize the code to require minimal processing during use and not to overload mt5. The indicator can be used for pre-trading analysis and study, where the trader analyzes possible points of support and resi
Descriptions A point point is a technical analysis indicator, or calculations, used to determine the overall trend of market over different time frames. This indicator calculate the highest or lowest pivots among left x and right y bars and show the high/low level during that period.   From that, you could clearly see the top resistance & bottom support level and how market goes break out. Instructions pivotLeft - pivot left bar count pivotRight - pivot right bar count pivotHighColor - c
The Rocket Trend indicator is trending. The indicator draws two-color points connected by lines along the chart. This is a trend indicator, it is an algorithmic indicator. It is easy to work and understand when a blue circle appears, you need to buy, when a red one appears, sell. The indicator is used for scalping and pipsing, and has proven itself well. Rocket Trend is available for analyzing the direction of the trend for a specific period of time. Ideal for novice traders learning the laws o
I recommend you to read the  product's blog  (manual) from start to end so that it is clear from the beginning what the indicator offers. This multi time frame and multi symbol supply and demand zone dashboard indicator sends alerts when the price has reached a supply/demand zone. It is also possible to use it to be alerted about regular double tops/bottoms instead of zones. It can be used with all time frames from M1 to MN. Maximum 9 time frames can be shown in the dashboard at the same time. 
Value Chart Candlesticks
Flavio Javier Jarabeck
4.7 (10)
The idea of a Value Chart indicator was presented in the very good book I read back in 2020 , " Dynamic Trading Indicators: Winning with Value Charts and Price Action Profile ", from the authors Mark Helweg and David Stendahl. The idea is simple and the result is pure genius: Present candlestick Price analysis in a detrended way! HOW TO READ THIS INDICATOR Look for Overbought and Oversold levels. Of course, you will need to test the settings a lot to find the "correct" one for your approach.
FREE
TilsonT3
Jonathan Pereira
Tillson's T3 moving average was introduced to the world of technical analysis in the article ''A Better Moving Average'', published in the American magazine Technical Analysis of Stock Commodities. Developed by Tim Tillson, analysts and traders of futures markets soon became fascinated with this technique that smoothes the price series while decreasing the lag (lag) typical of trend-following systems.
FREE
Stackable VWAP
Flavio Javier Jarabeck
3.5 (4)
Volume Weighted Average Price (VWAP) is a trading benchmark commonly used by Big Players that gives the average price a Symbol has traded throughout the day. It is based on both Volume and price. Additionally we put in this indicator the MVWAP (Moving Volume Weighted Average Price). For those who do not know the usage and the importance od this indicator I recommend a great article about this subject at Investopedia ( https://www.investopedia.com/articles/trading/11/trading-with-vwap-mvwap.asp
FREE
Contact me for instruction, any questions! Introduction The Elliott Wave in technical analysis describes price movements in the financial market that are related to changes in trader sentiment and psychology. The 5 W Pattern (Known as 3 Drives) is an Elliott Wave pattern that is formed by 5 consecutive symmetrical moves up or down. In its bullish form, the market is making 5 drives to a bottom before an uptrend forms. In a bearish 5-drive, it is peaking before the bears take over.  5W Pattern S
Candle EA MT5
Mansour Babasafary
4.37 (43)
This expert is based on patterns The main patterns of this specialist are candlestick patterns Detects trends with candlestick patterns It has a profit limit and a loss limit, so it has a low risk The best time frame to use this expert is M30 time frame The best currency pairs to use with this expert is the EURUSD, GBPUSD, AUDUSD, USDCAD currency pairs Attributes: Can be used in the EURUSD, GBPUSD, AUDUSD, USDCAD  currency pairs Can be used in M30, H1, H4 time frames Has profit limit an
Disclaimer : Keep in mind that seasonal patterns are not always reliable. Therefore, thoughtful risk management is crucial to minimize losses.  Seasonal patterns in the financial world are like a well-guarded secret that successful investors use to their advantage. These patterns are recurring price movements that occur during specific periods or around special events. Additionally, there are also intraday patterns that repeat. For example, Uncle Ted from Forex Family suggests examining previou
A countdown timer for the  Volume bar chart generator  and  Tick chart generator  products, which are available for download from the MQL5 Market: Tick chart generator: https://www.mql5.com/en/market/product/29215 Volume bar chart generator: https://www.mql5.com/en/market/product/47197 The counter conveniently displays the number of ticks or transactions (depending on the chart) that need to pass for a new bar to start printing. The user can set the following indicator inputs. Volume type
FREE
The   Visual Volatility Clustering   indicator clusters the market based on volatility. The indicator does not redraw and gives accurate data, does not use closing prices. Uses the opening prices or the highs or lows of the previous completed bar. Therefore, all information will be clear and unambiguous. The essence of the indicator is to divide the price market into certain areas according to a similar type of volatility. This can be done in any way. In this example, the indicator is configure
Volume Candle MT5
Rafael Caetano Pinto
This indicator shows the candles with the highest volume in the market, based on a period and above-average growth percentage. It is also possible to activate the "Show in-depth analysis" functionality that uses algorithms to paint the candles with the probably market direction instead of painting based on the opening and closing positions. EA programmers: This indicator does not redraw.
Graphic Alignment Context
Ricardo Alexandre Laurentino
The Graphic Alignment Context (GAC) Technical Indicator measures the vertical difference of the simple average price of a financial instrument in the context of three different timeframes determined by a defined number of bars or candles (periods) to determine the strength of the buy or sell trend. sale. Ascending average prices indicate Buying strength (1), Descending average prices indicate Selling strength (-1) and any scenario different from the previous two conditions indicates Neutrality
FREE
This indicator uses a different approach from the previous version to get it's trendlines. This method is derived from Orchard Forex, and the process of making the indicator is demonstrated in there video   https://www.youtube.com/watch?v=mEaiurw56wY&t=1425s . The basic idea behind this indicator is it draws a   tangent line   on the highest levels and lowest levels of the bars used for calculation, while ensuring that the lines don't intersect with the bars in review (alittle confusing? I kno
FREE
Note: If you want to apply this indicators on indicators which are shown in a sub-window, then consider using this indicator instead:  https://www.mql5.com/en/market/product/109066.&nbsp ; AIntel Predict - Your Gateway to Future Trading Success! Unlock the power of predictive analytics with AIntel Predict. Say goodbye to the guesswork and hello to improved forecasting, as AIntel Predict leverages historical data to unveil the future of your trades like never before. Whether you're a seasoned tra
Volume is a widely used indicator in technical analysis, however there is a variation that is even more useful than Volume alone: the Moving Average of Volume. It is nothing more than a moving average applied to the popular Volume indicator. As the name says, Volume + MA serves to display the transacted volume (purchases and sales executed) of a certain financial asset at a given point of time together with the moving average of that same volume over time. What is it for? With the Volume
FREE
BS Vwap 5 Bands
Bruno Gomes Falcao Seixas
The BS Vwap 5 Bands indicator is an advanced tool that integrates price and volume data, providing a comprehensive view of market dynamics. Designed with a focus on performance and tested under real trading conditions, this indicator aims to deliver valuable insights to traders. Its innovative approach combines VWAP with five distinct bands, revealing whether the price is aligned with the "fair price" and indicating overbought or oversold conditions. Additionally, the indicator offers visual cus
Vwap Bands Auto
Ricardo Almeida Branco
The Vwap Bands Auto indicator seeks to automatically map the maximum market frequency ( automatic update of the outermost band ) and has two intermediate bands that also adjust to daily volatility. Another tool from White Trader that combines price and volume, in addition to mapping the daily amplitude. The external band is updated automatically when the daily maximum or minimum breaks the current frequency, and can be an input signal, seeking a return to the daily vwap. Thus, in ad
CYCLE WAVE OSCILLATOR indicator is an indicator based on cyclical price fluctuations. This indicator can help you determine overbought and oversold levels, and help you predict price trends within the cycle. MT4 Version here! You can combine it with our indicators below to make your trading decisions more accurate: Supply Demand Ribbon MT5 Basic Feature: - Three Trend Types: + Zero + Basic + Advanced
FREE
Bu ürünün alıcıları ayrıca şunları da satın alıyor
TPSpro RFI Levels MT5
Roman Podpora
4.73 (11)
TALİMATLAR         RUS   -        ENG       Bir gösterge ile kullanılması   önerilir       -       TPSpro   TREND PRO -   Sürüm MT4         Ticarette önemli bir unsur, bir ticaret aracını satın alma veya satma kararlarının alındığı bölgeler veya seviyelerdir. Büyük oyuncuların piyasadaki varlıklarını gizleme girişimlerine rağmen, kaçınılmaz olarak izler bırakırlar. Bizim görevimiz bu izleri nasıl tanımlayacağımızı ve doğru şekilde nasıl yorumlayacağımızı öğrenmekti. Ana işlevler:: Satıcılar ve
TPSproTREND PrO MT5
Roman Podpora
4.89 (9)
TPSpro TREND PRO  - is a trend indicator that automatically analyzes the market and provides information about the trend and each of its changes, as well as giving signals for entering trades without redrawing! The indicator uses each candle, analyzing them separately. referring to different impulses - up or down impulse. Exact entry points into transactions for currencies, crypto, metals, stocks, indices!  Version MT4               DETAILED DESCRIPTION               R ecommended to use with an
Öncelikle, bu Ticaret Sistemi'nin Non-Repainting, Non-Redrawing ve Non-Lagging Göstergesi olduğunu vurgulamak önemlidir, bu da hem manuel hem de robot ticareti için ideal hale getirir. Online kurs, kılavuz ve ön ayarları indir. "Smart Trend Trading System MT5", yeni ve deneyimli tüccarlar için özelleştirilmiş kapsamlı bir ticaret çözümüdür. 10'dan fazla premium göstergeyi birleştiriyor ve 7'den fazla sağlam ticaret stratejisi sunuyor, bu da çeşitli piyasa koşulları için esnek bir seçim yapar. Tr
Atomic Analyst MT5
Issam Kassas
4.42 (19)
Öncelikle belirtmek gerekir ki bu Ticaret Göstergesi Yeniden Çizim Yapmaz, Gecikmez ve Gecikme Göstermez, bu da hem manuel hem de robot ticareti için ideal hale getirir. Kullanıcı kılavuzu: ayarlar, girişler ve strateji. Atom Analisti, Piyasada Daha İyi Bir Avantaj Bulmak İçin Fiyatın Gücünü ve Momentumunu Kullanan PA Fiyat Hareketi Göstergesidir. Gürültüleri ve Yanlış Sinyalleri Kaldırmaya ve Ticaret Potansiyelini Artırmaya Yardımcı Olan Gelişmiş Filtrelerle Donatılmıştır. Birden fazla katmanl
FX Power MT5 NG
Daniel Stein
5 (5)
Sabah Brifingimiz burada mql5 ve on Telegram! FX Power MT5 NG , uzun zamandır çok popüler olan döviz gücü ölçerimiz FX Power'ın yeni neslidir. Peki bu yeni nesil güç ölçer ne sunuyor? Orijinal FX Power hakkında sevdiğiniz her şey PLUS GOLD/XAU güç analizi Daha da hassas hesaplama sonuçları Ayrı ayrı yapılandırılabilir analiz dönemleri Daha da iyi performans için özelleştirilebilir hesaplama limiti Özel çokluDaha fazlasını görmek isteyenler için örnek ayarlar Her grafikte en sevdiğiniz renkler i
Quantum Trend Sniper
Bogdan Ion Puscasu
4.8 (49)
Tanıtım       Kuantum Trend Keskin Nişancı Göstergesi   , trend tersine dönmeleri belirleme ve ticaret yapma şeklinizi değiştiren çığır açan MQL5 Göstergesi! 13 yılı aşkın ticaret tecrübesine sahip deneyimli tüccarlardan oluşan bir ekip tarafından geliştirilmiştir.       Kuantum Trend Keskin Nişancı Göstergesi       trend dönüşlerini son derece yüksek doğrulukla belirlemenin yenilikçi yolu ile ticaret yolculuğunuzu yeni zirvelere taşımak için tasarlanmıştır. ***Kuantum Trend Keskin Nişancı Gö
AT Forex Indicator MT5
Marzena Maria Szmit
5 (4)
The AT Forex Indicator MT5 is a sophisticated trading tool designed to provide traders with a comprehensive analysis of multiple currency pairs. This powerful indicator simplifies the complex nature of the forex market, making it accessible for both novice and experienced traders. AT Forex Indicator uses advanced algorithms to detect trends, patterns and is an essential tool for traders aiming to enhance their forex trading performance. With its robust features, ease of use, and reliable signal
TrendMaestro5
Stefano Frisetti
note: this indicator is for METATRADER4, if you want the version for METATRADER5 this is the link:  https://www.mql5.com/it/market/product/108106 TRENDMAESTRO ver 2.4 TRENDMAESTRO recognizes a new TREND in the bud, he never makes mistakes. The certainty of identifying a new TREND is priceless. DESCRIPTION TRENDMAESTRO identifies a new TREND in the bud, this indicator examines the volatility, volumes and momentum to identify the moment in which there is an explosion of one or more of these data a
Bu gösterge paneli, seçilen semboller için mevcut en son   harmonik kalıpları   gösterir, böylece zamandan tasarruf edersiniz ve daha verimli olursunuz /   MT4 sürümü . Ücretsiz Gösterge:   Basic Harmonic Pattern Gösterge sütunları Symbol :   seçilen semboller görünecektir Trend:   yükseliş veya düşüş Pattern :   desen türü (gartley, kelebek, yarasa, yengeç, köpekbalığı, cypher veya ABCD) Entry :   giriş fiyatı SL:   zararı durdur fiyatı TP1:   1. kar alma fiyatı TP2:   2. kar alma fiyatı
Top indicator for MT5   providing accurate signals to enter a trade without repainting! It can be applied to any financial assets:   forex, cryptocurrencies, metals, stocks, indices .  Watch  the video  (6:22) with an example of processing only one signal that paid off the indicator! MT4 version is here It will provide pretty accurate trading signals and tell you when it's best to open a trade and close it. Most traders improve their trading results during the first trading week with the help of
FxaccurateLS
Shiv Raj Kumawat
WHY IS OUR FXACCCURATE LS MT5 THE PROFITABLE ? PROTECT YOUR CAPITAL WITH RISK MANAGEMENT Gives entry, stop and target levels from time to time. It finds Trading opportunities by analyzing what the price is doing during established trends. POWERFUL INDICATOR FOR A RELIABLE STRATEGIES We have made these indicators with a lot of years of hard work. It is made at a very advanced level. Established trends provide dozens of trading opportunities, but most trend indicators completely ignore them!
Advanced Supply Demand MT5
Bernhard Schweigert
4.5 (14)
Herhangi bir Acemi veya Uzman Tüccar için En İyi Çözüm! Bu gösterge benzersiz, yüksek kaliteli ve uygun fiyatlı bir ticaret aracıdır çünkü bir dizi tescilli özelliği ve yeni bir formülü bir araya getirdik. Bu güncelleme ile çift zaman dilimi dilimlerini gösterebileceksiniz. Yalnızca daha yüksek bir TF gösteremeyeceksiniz, aynı zamanda TF grafiğini ve ARTIK daha yüksek TF'yi de gösterebileceksiniz: YUVARLAK BÖLGELERİ GÖSTERMEK. Tüm Arz Talebi tüccarları buna bayılacak. :) Önemli Bilgiler Açıkland
TPA True Price Action indicator reveals the true price action of the market makers through 100% non-repainting signals strictly at the close of a candle! TPA shows entries and re-entries, every time the bulls are definitely stronger than the bears and vice versa. Not to confuse with red/green candles. The shift of power gets confirmed at the earliest stage and is ONE exit strategy of several. There are available now two free parts of the TPA User Guide for our customers. The first "The Basics"
Blahtech Supply Demand MT5
Blahtech Limited
4.54 (13)
Was: $299  Now: $99   Supply Demand uses previous price action to identify potential imbalances between buyers and sellers. The key is to identify the better odds zones, not just the untouched ones. Blahtech Supply Demand indicator delivers functionality previously unavailable on any trading platform. This 4-in-1 indicator not only highlights the higher probability zones using a multi-criteria strength engine, but also combines it with multi-timeframe trend analysis, previously confirmed swings
XQ Indicator MetaTrader 5
Marzena Maria Szmit
3 (2)
Step into the realm of Forex trading with confidence and precision using XQ, a cutting-edge Forex indicator designed to elevate your trading game to unprecedented heights. Whether you're a seasoned trader or just stepping into the world of currency exchange, XQ Forex Indicator empowers you with the insights and signals needed to make informed trading decisions. The signal conditions are a combination of three indicators, and XQ Forex Indicator only display  medium and long-term trends . The ind
FX Volume MT5
Daniel Stein
4.93 (14)
Sabah Brifingimiz aracılığıyla ayrıntılar ve ekran görüntüleri ile günlük piyasa güncellemenizi alın burada mql5 ve on Telegram ! FX Volume, bir brokerin bakış açısından piyasa duyarlılığı hakkında GERÇEK bir fikir veren İLK ve TEK hacim göstergesidir. COT raporlarından çok daha hızlı bir şekilde, brokerlar gibi kurumsal piyasa katılımcılarının Forex piyasasında nasıl konumlandıklarına dair harika bilgiler sağlar. Bu bilgileri doğrudan grafiğinizde görmek, ticaretiniz için gerçek oyun değiştir
Was: $249  Now: $99   Market Profile defines a number of day types that can help the trader to determine market behaviour. A key feature is the Value Area, representing the range of price action where 70% of trading took place. Understanding the Value Area can give traders valuable insight into market direction and establish the higher odds trade. It is an excellent addition to any system you may be using. Inspired by Jim Dalton’s book “Mind Over Markets”, this indicator is designed to suit the
Gartley Hunter Multi
Siarhei Vashchylka
5 (8)
Gartley Hunter Multi - An indicator for searching for harmonic patterns simultaneously on dozens of trading instruments and on all possible timeframes. Manual (Be sure to read before purchasing) | Version for MT4 Advantages 1. Patterns: Gartley, Butterfly, Shark, Crab. Bat, Alternate Bat, Deep Crab, Cypher 2. Simultaneous search for patterns on dozens of trading instruments and on all possible timeframes 3. Search for patterns of all possible sizes. From the smallest to the largest 4. A
Bu gösterge paneli, seçilen semboller için ticaret stratejinize bağlı olarak hem ölçeklendirme hem de uzun vadeli modda grafikteki   Arz ve Talep   bölgelerini keşfeder ve görüntüler. Ek olarak, gösterge tablosunun tarayıcı modu, istediğiniz tüm sembolleri bir bakışta kontrol etmenize ve uygun pozisyonları kaçırmamanıza yardımcı olur /   MT4 sürümü Ücretsiz gösterge:   Basic Supply Demand Özellikler Birden fazla döviz çiftinde   alım satım fırsatlarını görüntülemenize olanak tanıyarak,
The Price Action Finder Multi indicator is an indicator of entry points that searches for and displays Price Action system patterns on dozens of trading instruments and on all standard time frames: (m1, m5, m15, m30, H1, H4, D1, Wk, Mn). The indicator places the found patterns in a table at the bottom of the screen. By clicking on the pattern names in the table, you can move to the chart where this pattern is located. Manual (Be sure to read before purchasing) | Version for MT4 Advantages 1. Pa
Golden Spikes Premium
Kwaku Bondzie Ghartey
5 (1)
Golden Spikes Detector Acknowledgement and Dedications:  The name of this indicator was Inspired by an Original; Mr Grant Koopman; a Knowledgeable and experienced Synthetics trader. I dedicate this indicator to Mr Grant.  Overview: The Golden Spikes Premium is a groundbreaking trading indicator meticulously crafted for the Boom and Crash indices on the Deriv market. Tailored to meet the needs of discerning traders, this powerful tool operates exclusively on the one-minute timeframe, providin
MetaForecast M5
Vahidreza Heidar Gholami
5 (2)
MetaForecast, fiyat verilerindeki harmonileri kullanarak herhangi bir piyasanın geleceğini tahmin eder ve görselleştirir. Piyasa her zaman tahmin edilemezken, fiyatlarda bir desen varsa, MetaForecast geleceği mümkün olduğunca doğru bir şekilde tahmin edebilir. Benzer ürünlere göre, MetaForecast piyasa eğilimlerini analiz ederek daha kesin sonuçlar üretebilir. Giriş Parametreleri Past size (Geçmiş boyut) MetaForecast'ın gelecekteki tahminler oluşturmak için kullandığı çubuk sayısını belirtir. M
Market Overview MT5
Mehran Sepah Mansoor
Piyasa gücü ve duyarlılık göstergemizle alım satım kararlarınızı optimize edin ve artık trende karşı alım satım yapmayın! Doğru ve zamanında bilgiye değer veren ciddi yatırımcılar için titizlikle tasarlanan göstergemiz, 28 ana çifte çok basit bir şekilde kuş bakışı bir görünüm sağlar. Bu araç, döviz çiftlerini popülerlik, yükseliş veya düşüş eğilimi gücü ve alıcı ve satıcıların yüzdesi /   MT5 versiyonuna   göre sıralayabilir.  Özellikler Gerçek Zamanlı Trend Gücü: Her bir döviz çiftind
Boom and Crash Trend Detector is a  Non-Repaint   MT5 trading system usually being sold for 50 0$ . Most people use this for Deriv but can be used to forex too. The boom and crash spike indicator is a spike detecting software, with Multiple features, these features include. Spike Alert ( from 10 to 100-second warning before spike) Continues spike Alert (for double or continuous spikes at a time) supports all Boom/crash Indices M6 time frame works best here . Bigger time frame trend pointer f
Trend Forecaster
Alexey Minkov
5 (6)
The Trend Forecaster indicator utilizes a unique proprietary algorithm to determine entry points for a breakout trading strategy. The indicator identifies price clusters, analyzes price movement near levels, and provides a signal when the price breaks through a level. The Trend Forecaster indicator is suitable for all financial assets, including currencies (Forex), metals, stocks, indices, and cryptocurrencies. You can also adjust the indicator to work on any time frames, although it is recommen
Introduction Harmonic Patterns are best used to predict potential turning point. Traditionally, Harmonic Pattern was identified manually connecting peaks and troughs points in the chart. Manual harmonic pattern detection is painfully tedious and not suitable for everyone. You are often exposed under subjective pattern identification with manual pattern detection. To avoid these limitations, Harmonic Pattern Plus was designed to automate your harmonic pattern detection process. The functionality
Renko is a well-known Japanese charting technique that removes time from the chart. Instead of drawing bars in constant intervals (time) as a normal chart would, a Renko chart does so only when price moves beyond a predefined amount. In a Renko chart, a bar is created when price exceeds the previous bar’s high or low by a predefined amount or what we call the Box Size. The result is a chart with equally sized bars running up or down in 45 degree angles. Such a chart offers the following advant
Unlock hidden profits: accurate divergence trading for all markets Special Offer: Purchase now to receive free bonuses worth $90! (Read more for details) Tricky to find and scarce in frequency, divergences are one of the most reliable trading scenarios. This indicator finds and scans for regular and hidden divergences automatically using your favourite oscillator. [ Installation Guide | Update Guide | Troubleshooting | FAQ | All Products ] Easy to trade Finds regular and hidden divergences S
Protect against whipsaws: revolutionize your swing trading approach Special Offer: Purchase now to receive free bonuses worth $135! (Read more for details) Swing Trading is the first indicator designed to detect swings in the direction of the trend and possible reversal swings. It uses the baseline swing trading approach, widely described in trading literature. The indicator studies several price and time vectors to track the aggregate trend direction and detects situations in which the market i
Şimdi 147 $ (birkaç güncellemeden sonra 499 $ 'a yükseliyor) - Sınırsız Hesaplar (PC'ler veya Mac'ler) RelicusRoad Kullanım Kılavuzu + Eğitim Videoları + Özel Discord Grubuna Erişim + VIP Durumu PİYASAYA BAKMAK İÇİN YENİ BİR YOL RelicusRoad, forex, vadeli işlemler, kripto para birimleri, hisse senetleri ve endeksler için dünyanın en güçlü ticaret göstergesidir ve yatırımcılara kârlı kalmaları için ihtiyaç duydukları tüm bilgileri ve araçları sağlar. Başlangıç ​​seviyesinden ileri seviyey
Yazarın diğer ürünleri
SwingVolumePro
Thalles Nascimento De Carvalho
Genel Bakış SwingVolumePro , geniş bir finansal varlık yelpazesi üzerinde kullanılmak üzere tasarlanmış gelişmiş ve çok yönlü bir göstergedir. Hacim ve fiyat analizi üzerine kurulmuş olan bu gösterge, tüm seviyelerdeki trader'ların yüksek kaliteli verilere dayanarak bilinçli kararlar almasını sağlayacak şekilde net ve hassas sinyaller sunar. SwingVolumePro.PDF Ana Özellikler Çok Yönlülük: SwingVolumePro, hisse senetleri, forex, kripto paralar ve daha fazlası dahil olmak üzere çeşi
AI Channel
Thalles Nascimento De Carvalho
4 (4)
Welcome to the presentation of the AI Channel indicator, a powerful tool that uses artificial intelligence for price channel analysis in the financial market. In this session, we will explore how this revolutionary indicator can assist investors and traders in making more informed and strategic decisions. Let's get started! I. What is the AI Channel indicator? AI Channel is an indicator developed based on advanced artificial intelligence algorithms. It utilizes historical price data of financial
FREE
Cumulative Volume Bands
Thalles Nascimento De Carvalho
CVB Cumulative Volume Bands: Birikmiş Hacim ile İşlemlerinizi Güçlendirin! CVB Cumulative Volume Bands , birikmiş hacme dayalı kesin sinyaller arayan traderlar için tasarlanmış ileri düzey bir göstergedir. Birikmiş hacim bantlarını kullanarak, bu gösterge piyasanın alım ve satım baskılarının net okumasını sağlar ve dönüşleri ve güçlü fiyat hareketlerini tanımlamada yardımcı olur. Cumulative Volume Bands for MT5 ! Temel Özellikler: Birikmiş Hacim Analizi : Hacme dayalı baskı n
FREE
Box Weis Wave
Thalles Nascimento De Carvalho
5 (1)
Weis Wave Box ile analizlerinizi bir üst seviyeye taşıyın! Eğer ticaretinizde hassasiyet ve netlik arıyorsanız, Weis Wave Box ihtiyaç duyduğunuz araçtır. Bu ileri düzey gösterge, hacim dalgaları ve swing noktalarının ayrıntılı görsel analizini sunarak, piyasalarda çaba ve sonuç arasındaki ilişkiyi daha iyi anlamanıza yardımcı olur. Weis Wave Box’ın Başlıca Özellikleri: Kişiselleştirilebilir Hacim Dalgaları: Ticaret stratejilerinize uygun olarak hacim dalgalarını tik bazında ayarlayın.
Swing Point Volume
Thalles Nascimento De Carvalho
Swing Point Volume, the indicator that signals weakness and strength at the tops and bottoms. This indicador can be for used the Wyckoff Method. Information provided; - Swing on customized ticks. - Volume and points in each balance sheet. - Percentage of Displacement. - Sound alert option on top and bottom breaks. - Volume in ticks and Real Volume. - Volume HL (extreme) or (opening and closing) - Customized volume shapes.
Atr Projection
Thalles Nascimento De Carvalho
ATR Projeksiyon Göstergesi, finansal piyasalardaki fiyat hareketlerinin potansiyel sınırları konusunda keskin görüşler sunmak amacıyla tasarlanmış teknik analizde güçlü bir araç olarak öne çıkıyor. Esnek yaklaşımı, kullanıcıların analiz ölçümlerini sezgisel bir şekilde özelleştirmelerine, her işlem yapılan varlığın özel ihtiyaçlarına uyarlamalarına izin verir. Özelleştirilebilir İşleyiş: Varsayılan olarak, ATR Projeke 100 mumun ortalamasının %30'unu göz önünde bulundurarak çalışır. Bu esne
Long Short Pro
Thalles Nascimento De Carvalho
Long & Short Göstergesi - Pro Versiyon: Pazar Analizinizi Sınırsız Olanaklarla Güçlendirin! Tüm Varlıklar İçin Sınırsız Kullanım Long & Short göstergesinin Pro versiyonu, herhangi bir finansal varlık üzerinde tam özgürlük sunar. Artık sınırlama olmadan aynı göstergiyi tüm tercih ettiğiniz varlıklara uygulayabilirsiniz! Sınırsız Erişim Göstergeyi hiçbir kısıtlama olmadan kullanmanın tadını çıkarın. Pro versiyonu, size tam ve sınırsız bir deneyim sunarak her piyasa fırsatını en üst
Didi Index Volume
Thalles Nascimento De Carvalho
Sunuyoruz, Didi Index Volume adlı bir teknik analiz göstergesi. Bu gösterge, Brezilyalı trader Odir Aguiar tarafından geliştirilmiştir ve finansal piyasalardaki fırsatları tespit etmede ileri ve güçlü bir yaklaşımıyla öne çıkmaktadır. Çeşitli platformlarda mevcut olan Didi Index Volume, kesin bilgilere ve değerli bilgilere ihtiyaç duyan işlemciler için vazgeçilmez bir araç haline gelmiştir. Gösterge, Odir Aguiar tarafından oluşturulan saygın Didi Index ile işlem hacminin akıllı bir şekilde ku
Smart Binary Volume
Thalles Nascimento De Carvalho
Smart Binary Volume göstergesi, ticaret hacmi analizini makine öğrenimi ile birleştiren çok yönlü bir araçtır. Scalping ve diğer kısa vadeli ticaret stratejileri de dahil olmak üzere çeşitli piyasalarda ve stratejilerde kullanılabilir. Gelişmiş makine öğrenimi algoritmalarını kullanarak, gösterge karmaşık desenleri tanımlar ve daha hassas alım satım sinyalleri üretir. Buffer to Create EA. Buffer Line Gold = 0. Buffer Line Red = 2 Buffer   AI  =  3 AI Buffer  >=  0  ("SIGNAL BUY") AI Buffer 
TimeChannel
Thalles Nascimento De Carvalho
The "Timechannel" is a powerful technical analysis tool designed specifically for traders who want to gain deeper and more accurate insights into price movements across multiple timeframes (multi-timeframe). This indicator is an essential addition to the toolbox of any serious trader seeking to make informed and data-driven trading decisions. Key Features: Advanced Multi-Timeframe Analysis : Timechannel allows traders to analyze price movements on different timeframes simultaneously. This is cr
Big Player Range
Thalles Nascimento De Carvalho
5 (2)
"BigPlayerRange"ın Gücünü Keşfedin: Pazar Teknik Analizinde Sizin Müttefikiniz BigPlayerRange 'ı tanıtıyoruz, piyasalarda kurumsal yatırımcıların ilgi alanlarını ortaya çıkaran gelişmiş bir teknik analiz aracıdır. Bu araç sayesinde, büyük oyuncuların aktif olduğu alanları hassas bir şekilde belirleyebilir ve bunun ticaret stratejilerinizi nasıl etkileyebileceğini anlayabilirsiniz. Ana Özellikler: Kurumsal İlgi Alanlarının Haritalanması : BigPlayerRange , kurumsal yatırımcıların yüksek etk
Master OBV
Thalles Nascimento De Carvalho
MasterOBV: Pazar Trendlerini Hassasiyetle Yönetin! MasterOBV , hacim , pozitif korelasyon ve Hareketli Ortalama (MA) kombinasyonunu kullanarak finansal piyasalarda trendleri tanımlama yeteneğini artıran bir teknik analiz göstergesi dir. Ana Özellikler: Akıllı Hacim: Ticaret hacmini analiz ederek trend gücündeki önemli değişimleri belirler. Pozitif Korelasyon: Korele olmuş varlıkları dahil ederek daha geniş ve doğru bir bakış açısı sağlar, çiftlerin hacmine dayalı olarak fiyat kayması
Smart Delta Volume
Thalles Nascimento De Carvalho
Smart Delta Volume: Dinamik Pazar Koşullarına Uyarlanabilir ve Hassas Araç Smart Delta Volume , sürekli değişen bir piyasa ortamında hassas ve uyarlanabilir analizler sunmak için tasarlanmış gelişmiş bir teknik göstergedir. Bu gösterge, volatiliteye göre otomatik olarak ayarlanan dinamik seviyeleri kullanarak, hacim akışı ile fiyat hareketleri arasındaki etkileşim hakkında daha kapsamlı ve güvenilir bir görüş sağlar. Bu uyarlanabilirlik, özellikle değişken piyasalarda hızlı ve doğru bilgiler
VolaMetrics VSA
Thalles Nascimento De Carvalho
VolaMetrics VSA | Teknik Analizde Güçlü Bir Yardımcı VolaMetrics VSA , Volume Spread Analysis (VSA) metodolojisini ayrıntılı işlem hacmi analizi ile birleştiren bir teknik analiz göstergesidir. Önemli fiyat hareketlerini belirlemek ve izlemek için tasarlanan bu araç, hacim ve fiyat yayılması arasındaki etkileşimi kullanarak, ticaret kararlarına yardımcı olabilecek değerli içgörüler sağlar. Volume Spread Analysis (VSA) Temelleri Volume Spread Analysis (VSA) , teknik analizde saygı gören bir
CVD SmoothFlow Pro
Thalles Nascimento De Carvalho
CVD SmoothFlow Pro - Her Varlık İçin Sınırsız Hacim Analizi! CVD SmoothFlow Pro , hassas ve sınırsız bir hacim analizi arayan trader'lar için nihai çözümüdür. Cumulative Volume Delta (CVD) hesaplamasını ve gelişmiş gürültü filtrelemesini kullanarak, Pro sürümü herhangi bir finansal varlık için gereken esneklik ve doğruluğu sağlar. CVD SmoothFlow Pro Neler Sunar? Açık Analiz : Pazar gürültüsünü filtreler ve her finansal varlıkta önemli hacim hareketlerini vurgular. ️ Kesin Hesaplama : Alım
Imbalance DOM Pro
Thalles Nascimento De Carvalho
Imbalance DOM Pro: Emir Defterindeki Dengesizlikle İşlemlerinizi Güçlendirin Küçük Fiyat Hareketlerinde Fırsatlar Imbalance DOM Pro , emir akışı ile işlem yapan analistler için temel bir araçtır. Scalper lar için mükemmel olan bu araç, küçük fiyat hareketlerinden yüksek doğrulukla yararlanmak isteyenler için tasarlanmıştır. İleri düzey hesaplamalarla, emir defterindeki dengesizlikleri tanımlar ve hızlı giriş ve çıkışlar için değerli sinyaller sağlar. ÖNEMLİ: MT5'te Emir Defteri Eriş
Cumulative Vol Bands
Thalles Nascimento De Carvalho
CVB Cumulative Volume Bands: Birikmiş Hacim ile İşlemlerinizi Güçlendirin! CVB Cumulative Volume Bands , birikmiş hacme dayalı kesin sinyaller arayan traderlar için tasarlanmış ileri düzey bir göstergedir. Birikmiş hacim bantlarını kullanarak, bu gösterge piyasanın alım ve satım baskılarının net okumasını sağlar ve dönüşleri ve güçlü fiyat hareketlerini tanımlamada yardımcı olur. Temel Özellikler: Birikmiş Hacim Analizi : Hacme dayalı baskı noktalarını tespit edin. Açık Giriş/
ZigWave Oscillator
Thalles Nascimento De Carvalho
ZigWave Oscillator: Osilatörler ve ZigZag ile İşlemlerinizi Güçlendirin! ZigWave Oscillator, finansal piyasalarda doğruluk ve netlik arayan traderlar için mükemmel bir araçtır. Bu gösterge, osilatörlerin gücünü ZigZag’ın görsel sadeliğiyle birleştirir ve en iyi alım ve satım fırsatlarını hızlı ve etkili bir şekilde tanımlamanıza yardımcı olur. Neden ZigWave Oscillator'ı Seçmelisiniz? Doğru Osilatör Analizi : RSI, Williams %R veya CCI’yi entegre ederek piyasanın ana hareketlerini yakala
Filtrele:
Alejandro Perez Gonzalez
225
Alejandro Perez Gonzalez 2024.09.02 20:21 
 

Kullanıcı incelemeye herhangi bir yorum bırakmadı

Thalles Nascimento De Carvalho
6364
Geliştiriciden yanıt Thalles Nascimento De Carvalho 2024.09.02 20:43
Los fractales funcionan como preavisos, que pueden o no activarse, ayudando a mantener al trader atento al mercado. La entrada debe ser validada por la aceleración o desaceleración en el histograma rápido (en un timeframe menor). Además, el histograma rápido ofrece un análisis sobre la absorción de precio basada en el volumen. Los ejemplos están disponibles en las capturas de pantalla, junto con el paso a paso completo. Importante: ¡No opere exclusivamente basándose en las flechas (arrows)! Gracias por su feedback.
İncelemeye yanıt
Sürüm 1.3 2024.09.08
Improved hardware usage
Sürüm 1.2 2024.09.01
Kullanım talimatları eklendi ve gösterge çeşitli araçlara uyum sağladı.