• Genel bakış
  • İncelemeler
  • Yorumlar

FVG for MT5

"Fair Value Gap" (FVG) Göstergesi - Piyasa Dengesizliklerinin Gücünü Keşfedin

Ticaret dünyası, yalnızca doğru araçlara sahip olanların etkili bir şekilde tanımlayıp yararlanabileceği gizli fırsatlarla doludur. FVG Göstergemiz, bunu yapmanıza yardımcı olmak için tasarlanmıştır. Piyasayı okuma yeteneğinizi geliştirmek ve en iyi giriş ve çıkış noktalarını belirlemek isteyen bir tüccarsanız, FVG Göstergesi mükemmel müttefikinizdir.

Fair Value Gap (FVG) Nedir?

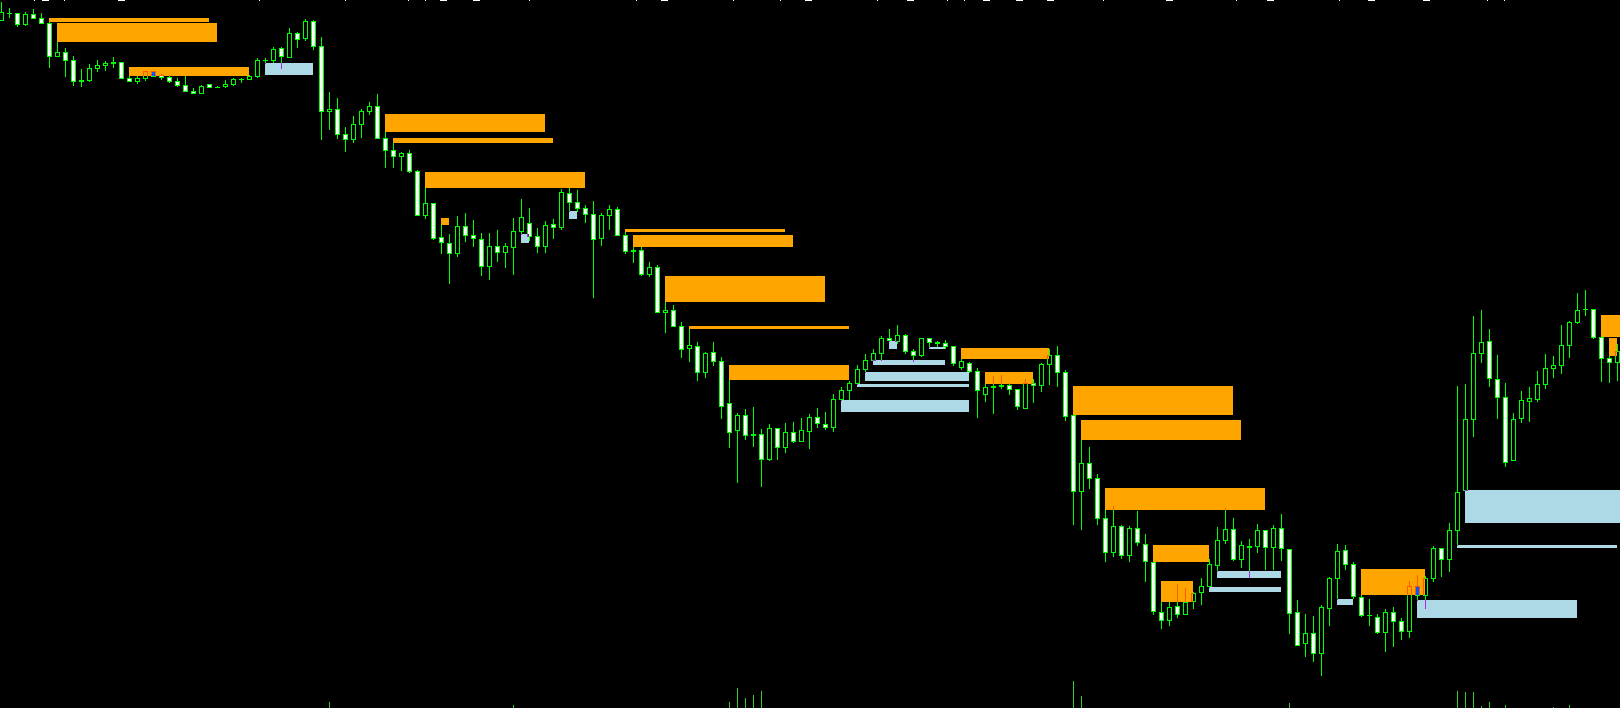
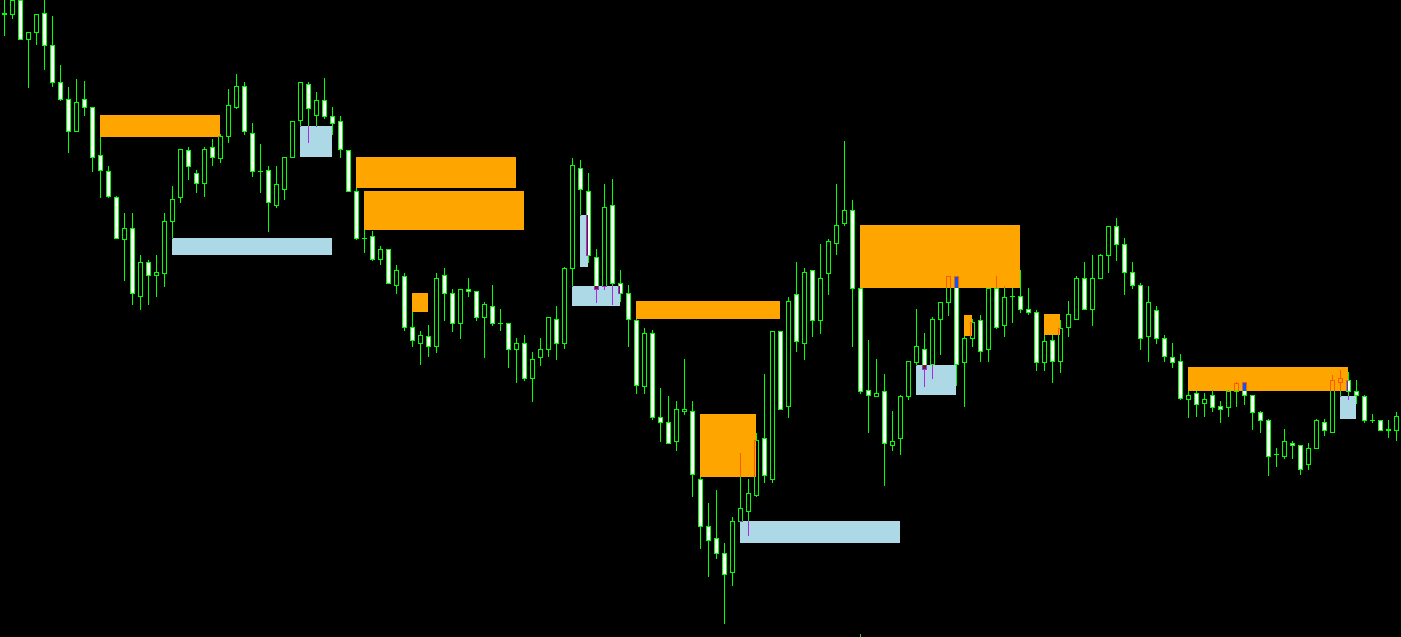
Fair Value Gap kavramı, fiyat grafiğinde bir "gap" oluşturan arz ve talep arasındaki bir uyumsuzluğu ifade eder. Bu boşluk, fiyatın bu dengesizliği doldurmak için geri dönebileceği bir alanı temsil eder ve bu alanlar, ticaret fırsatları için potansiyel olarak değerli olabilir. Bu boşluklar hızlı fiyat hareketleri sırasında oluşur ve gelecekteki piyasa davranışını anlamada bir anahtar olabilir.

FVG Göstergesi Neden Önemlidir?

FVG Göstergesi, grafik üzerinde bu dengesizlik alanlarını kolayca tespit etmenizi sağlar ve fiyatın bu boşluğu doldurmak için geri dönebileceği yerleri vurgular. Bu bilgi, herhangi bir ticaret stratejisi için çok önemlidir, çünkü tüccarlara geri çekilmeler veya hızlanmaların meydana gelebileceği önemli fiyat seviyelerini belirleme yeteneği sağlar.

FVG Göstergesinin Temel Özellikleri

  • Otomatik Gap Tespiti: FVG Göstergesi, Fair Value Gap'leri belirlemek için grafiği otomatik olarak tarar, bu da size zaman kazandırır ve insan hatası olasılığını azaltır.
  • Net Görsel Sinyaller: Boşluk alanları grafik üzerinde belirgin göstergelerle açıkça işaretlenir ve potansiyel ticaret fırsatlarının nerede olduğunu hemen görmenizi sağlar.
  • Tamamen Özelleştirilebilir: Göstergede yer alan parametreleri ayarlayarak ihtiyaçlarınıza göre yapılandırabilirsiniz. İster kısa vadeli ister uzun vadeli ticaret yapmayı tercih edin, FVG Göstergesi gereksinimlerinize uyum sağlar.
  • Tüm Tüccarlar için Uygundur: Başlangıç seviyesinde veya profesyonel olun fark etmez, FVG Göstergesi kullanımı kolaydır ve her ticaret stiline entegre edilebilir.
  • Çoklu Platform Uyumluluğu: FVG Göstergesi, çeşitli ticaret platformlarıyla uyumludur ve bunu birden fazla enstrüman ve piyasada kullanmanıza olanak tanır.

FVG Göstergesini Ticaret Stratejinize Nasıl Entegre Edebilirsiniz?

  1. Kurulum: Seçtiğiniz finansal enstrümanın grafiğine FVG Göstergesi ekleyin.
  2. Yapılandırma: Gösterge parametrelerini tercihlerinize göre ayarlayın. Sinyalleri daha iyi hale getirmek için boşluk hassasiyetini ve diğer kriterleri ayarlayabilirsiniz.
  3. Analiz: Grafiği gözlemleyin ve FVG Göstergesinin boşluk alanlarını belirlediği yerleri not alın. Bunlar, dikkatinizi odaklamanız gereken anahtar noktalardır.
  4. Karar Verme: Piyasaya ne zaman girip çıkacağınıza karar vermek için gösterge tarafından sağlanan bilgileri kullanın. FVG Göstergesi yalnızca en iyi fırsatları bulmanıza yardımcı olmakla kalmaz, aynı zamanda geri çekilme potansiyeli taşıyan bölgeleri belirleyerek risk yönetimi için de kullanılabilir.

FVG Göstergesinin Avantajları

  • Gelişmiş Hassasiyet: FVG Göstergesi ile piyasanın nereye yönlenebileceğini daha net bir şekilde görebilir ve gelecekteki hareketleri tahmin etme yeteneğinizi geliştirebilirsiniz.
  • Risk Azaltma: Dengesizlik alanlarını belirleyerek, yanlış zamanda ticaret yapmaktan kaçınabilir ve risk yönetiminizi iyileştirebilirsiniz.
  • Artan Fırsatlar: Boşlukları tespit ederek daha fazla ticaret fırsatına erişebilir ve en iyi giriş ve çıkış noktalarını daha fazla güvenle seçebilirsiniz.


Önerilen ürünler
1. Why did I develop this series of indicators I found that most traders need to use multiple time frame indicators. They usually switch time frame to see indicators. However, once the timeframe is switched, you cannot see the  corresponding relationship  between  the price in the smaller timeframe  and  the indicator in the larger timeframe . For example: if your price chart is in H1 timeframe, you can see H4, D1 and W1 indicators in H1 timeframe Chart. This is more helpful for you to find th
Plucking Machine I   Plucking Machine I is a trend indicator designed specifically for gold and can also be used on any financial instrument. The indicator does not redraw and does not lag. Recommended time frame H1. The current setting is applicable for all time periods. It shows the current direction of the market based on price movements. Corresponding products of indicators:  https://www.mql5.com/zh/market/product/61388?source=Site+Market+Product+Page#description
Overview In the fast-paced world of forex and financial markets, quick reactions and precise decision-making are crucial. However, the standard MetaTrader 5 terminal only supports a minimum of 1-minute charts, limiting traders' sensitivity to market fluctuations. To address this issue, we introduce the Second-Level Chart Candlestick Indicator , allowing you to effortlessly view and analyze market dynamics from 1 second to 30 seconds on a sub-chart. Key Features Support for Multiple Second-Level
About indicator > The indicator is a function based on one value (open/high prices up to now) and then it is a mathematical representation of the whole function that is totally independent from any else values. So, if you ask yourself will the future be as it is on the graph... I can tell you - as it was the same as the trading function up to the moment "now"... In conclusion, the point of the indicator is  to try to show the future of the trading function into eternity. The graphic is sometime
To get access to MT4 version please click   here . This is the exact conversion from TradingView: QQE MT4 Glaz-modified by JustUncleL This is a light-load processing and non-repaint indicator. All input options are available. This is not a multi time frame indicator. Buffers are available for processing in EAs. You can message in private chat for further changes you need.
Introducing RSIScalperPro - the revolutionary RSI-based indicator for Metatrader 5, specifically designed for scalping in the one-minute chart. With RSIScalperPro, you'll have a powerful toolkit for precise entry and exit signals to take your trading to the next level. RSIScalperPro utilizes two different RSI indicators that provide clear signals for overbought and oversold areas. You can customize the time periods and limit values of the two RSIs according to your preferences to achieve the be
- This is an implementation of OCC ==> open close cross - This indicator applies twelve different averaging methods to open and close prices separately to signal the trend switching. - All MA methods are set as input as well as period and different offsets applied to linear regression and ALMA averaging. - Buffers 16 and 17 can be used in EAs to detect trend direction. - You can message in private chat for further changes you need.
MP Heatmap for MT5
Pierre Ksachikian
5 (2)
A heatmap is a graphical representation of data in two dimensions, using colors to display different factors. Heatmaps are a helpful visual aid for viewers, enabling the quick dissemination of statistical or data-driven information. The MP Heatmap indicator provides a graphical representation of the relative strengths of major currencies compared to others, organizing data from pairs into color-coded results and producing a clear overview of the entire Forex market. The MP Heatmap indicator dis
FREE
The Trap Play MT5
Carl Gustav Johan Ekstrom
5 (1)
You can also access this indicator for FREE on TradingView! Link: The Trap Play Trap Play  refers to a market situation where price initially makes a new high or low, luring traders into believing a strong trend is forming. However, the price quickly reverses and invalidates the breakout, trapping those traders who entered positions based on the initial move. This sudden reversal often results in a rapid exit of positions, leading to significant price movement in the opposite direction.  Trap p
FREE
The Quantitative Qualitative Estimation (QQE) indicator is derived from Wilder’s famous Relative Strength Index (RSI). In essence, the QQE is a heavily smoothed RSI. Modification of this version: ( converted from tradingview script by Mihkell00, original from Glaz) So there are Two QQEs. One that is shown on the chart as columns, and the other "hidden" in the background which also has a 50 MA   bollinger band   acting as a zero line. When both of them agree - you get a blue or a red bar.
【Super Scanner】Indicator Introduction : The color of the Super Scanner which is green and climbing up means that the price trend is going up.The color of the Super Scanner is red and going down means that the price trend is going down. It is very simple to use it to judge the market trend! What's even better is that the open parameters of the indicators allow investors to adjust. You can adjust【Super Scanner】according to your needs. Adjust it faster to be closer to short-term market fluctuatio
Market Ticker Pro MT5
John Louis Fernando Diamante
The only Market Ticker on the market! Add a professional novelty to your workspace, with built in mini-charts A scrolling Market Ticker that displays price changes from all symbols in the Market Watch list. Provides an easy snapshot of symbol prices, and keeps scrolling automatically while you trade and analyse the chart. The ticker color (+/- price changes) are based on either the current or completed candle, and the previous candle. Options include: - MTF, eg choose to show price changes of t
Triple Machine
Thomas Bradley Butler
Build your own model to predict averages of turning points of the Triple Moving Average Oscillator. It is simple.  Rate me with stars. Just load the indicator Triple Moving Average Oscillator in you platform and choose the period.  Scroll through to observe the averages of the highs and lows over a period of time. Add the levels for a buy and a sell on the Triple Machine and this will show the average of highs and lows to look for buys and sell. You can load multiple copies with multiple levels.
Descriptions A point point is a technical analysis indicator, or calculations, used to determine the overall trend of market over different time frames. This indicator calculate the highest or lowest pivots among left x and right y bars and show the high/low level during that period.   From that, you could clearly see the top resistance & bottom support level and how market goes break out. Instructions pivotLeft - pivot left bar count pivotRight - pivot right bar count pivotHighColor - color
TPO Profile MT5
Kyra Nickaline Watson-gordon
Definition : TPO is a Time Price Opportunity. Instead of using bars or candles with an Open, High, Low, and Close price, each "bar" in a Market Profile is represented by horizontal bars against the price It is called Market Profile terminology. In other words time-price-opportunity (TPO) profiles are histograms of how much time was spent at each price within the span of the profile. By using a TPO chart, you are able to analyze the amount of trading activity, based on time, for each price level
Introduction This indicator detects volume spread patterns for buy and sell opportunity. The patterns include demand and supply patterns. You might use each pattern for trading. However, these patterns are best used to detect the demand zone (=accumulation area) and supply zone (=distribution area). Demand pattern indicates generally potential buying opportunity. Supply pattern indicates generally potential selling opportunity. These are the underlying patterns rather than direct price action. T
Bu DYJ sinyali, ATR teknolojisine dayalı bir ticaret sistemidir Bu göstergeler her zaman çerçevesi ve analiz edilen para birimlerinin güç eğilimlerinin geçerli durumunu kaydeder DYJ güç sinyalleri bu verileri değerlendirerek, eğilim yoğunluğu ve giriş noktası sinyallerinin listesini profesyonel olarak oluşturur Eğer herhangi bir çift tam eşleşirse, bu durumu belirten bir uyarı görüntülenir Liste verileri Symbol, M5 MN1, Satın Percent, Satın Percent ve LastEntry LastEntry giriş noktasını (döngü,
Non-lagging VOLATILITY indicator A radical modification of the ATR indicator, which corrected all of its shortcomings (the picture shows the difference with ATR). The indicator shows the swing size of the current market movement. Features: does not have a time window period, i.e. any subjective settings non-delayed, the extremums of the indicator always coincide with the extremum of the price (note the picture) is normalized by means of a color solution, i.e. it has the properties of an oscillat
Hrum
Yvan Musatov
The Hrum indicator was created to neutralize temporary pauses and rollbacks. It analyzes price behavior and, if there is a temporary weakness in the trend, you can notice this from the indicator readings, as in the case of a pronounced change in trend direction. Entering the market is not difficult, but staying in it is much more difficult. With the Giordano Bruno indicator and its unique trend line, staying on trend will become much easier! Every rise and every fall is reflected in your emoti
UR HighsAndLows MT5
Krzysztof Jan Debski
UR Yüksekler ve Düşükler   UR Highs&Lows, fiyat hareketinin ve oynaklığının derinlemesine bir analizini yapar ve fiyatın içinde hareket ettiği bir kanal oluşturur. Bu kanal artık bir osilatör olarak hareket ediyor ve potansiyel tükenmeleri ve olası tersine dönüşleri işaret etmek için fiyat sapması ile kaplanıyor. UR Yüksekler ve Düşükler kullanmanın avantajları: parametre yok Fiyat hareketini tanımlayan 3 çizginiz var - fiyatın ortalaması olan Beyaz Çizgi ve uç noktaları olan Mavi Çizgiler H
Gioteen Volatility Index (GVI) - your ultimate solution to overcoming market unpredictability and maximizing trading opportunities. This revolutionary indicator helps you in lowering your losing trades due to choppy market movements. The GVI is designed to measure market volatility, providing you with valuable insights to identify the most favorable trading prospects. Its intuitive interface consists of a dynamic red line representing the volatility index, accompanied by blue line that indicate
AfriBold Cybernetic Affluence  Your Key to Autonated Trading In the dynamic world of financial markets, navigating the intricate patterns and making informed decisions can be a daunting task. Even seasoned traders face challenges in consistently outperforming the market. This is where the AfriBold Cybernetic Affluence emerges as a powerful tool, designed to automate your trading strategies. Harnessing the Power of AI The AfriBold Cybernetic Wealth Expert Advisor is a cutting-edge trading tool
Bu gösterge, pratik ticaret için mükemmel olan otomatik dalga analizine yönelik bir göstergedir! Dava... Not:   Dalga sınıflandırması için Batılı isimleri kullanmaya alışkın değilim. Tang Lun'un (Tang Zhong Shuo Zen) adlandırma kuralının etkisiyle, temel dalgayı   kalem   , ikincil dalga bandını ise   segment   olarak adlandırdım. aynı zamanda segmentin trend yönü vardır. Adlandırma   esas olarak trend segmentidir   (bu adlandırma yöntemi gelecekteki notlarda kullanılacaktır, öncelikle söyleyey
ToolBox 360 is the swiss knife of all indicators. It is full packed with useful tools to help you with your trading. It can be used to find best entry and exit points and help you to decide if you should open a trade or not. It shows market trends, candlestick formations outside / inside bars and you can sett time based allerts. Main features: Time based Fibonacci lines Choose a start and end time and the indicator shows you Fibonacci lines within the selected time range including range high a
The 4 headed dragon is an indicator that has two functions. 1) Set the background trend. 2) Mark the predominant trend. By combining these two indicator signals, we will be able to trade for or against the trend, adapting the signals to your reading of the market. You can download the demo and test it yourself. 1) Set the background trend.    Define four possibilities of trend that are the four heads of the dragon, marked by colors on the indicator, marking a) Powerful buying trend. b) Weak
The Rocket Trend indicator is trending. The indicator draws two-color points connected by lines along the chart. This is a trend indicator, it is an algorithmic indicator. It is easy to work and understand when a blue circle appears, you need to buy, when a red one appears, sell. The indicator is used for scalping and pipsing, and has proven itself well. Rocket Trend is available for analyzing the direction of the trend for a specific period of time. Ideal for novice traders learning the laws o
Note: If you want to apply this indicators on indicators which are shown in a sub-window, then consider using this indicator instead:  https://www.mql5.com/en/market/product/109066.&nbsp ; AIntel Predict - Your Gateway to Future Trading Success! Unlock the power of predictive analytics with AIntel Predict. Say goodbye to the guesswork and hello to improved forecasting, as AIntel Predict leverages historical data to unveil the future of your trades like never before. Whether you're a seasoned tra
1. Why did I develop this series of indicators I found that most traders need to use multiple time frame indicators. They usually switch time frame to see indicators. However, once the timeframe is switched, you cannot see the  corresponding relationship  between  the price in the smaller timeframe  and  the indicator in the larger timeframe . For example: if your price chart is in H1 timeframe, you can see H4, D1 and W1 indicators in H1 timeframe Chart. This is more helpful for you to find th
Gapless Moving Average  (GMA) Improved version of standard   Moving Average  (MA) from MetaTrader library which provides the possibility to eliminate the 'gaps' between candle sticks which distort the average values mainly during the N ('period') initial candles after market opens due to the spread ('gap') between closing price from previous day and opening price from the next day. The greater these 'gaps' are, the more divergent the standard MA is in order to indicate the current price trend a
Bu ürünün alıcıları ayrıca şunları da satın alıyor
Trend Screener Pro MT5
STE S.S.COMPANY
4.85 (79)
Trend Göstergesi, Trend Alım Satım ve Filtreleme için Çığır Açan Benzersiz Çözüm, Tüm Önemli Trend Özellikleriyle Tek Bir Araç İçinde Yerleştirildi! Forex, emtialar, kripto para birimleri, endeksler ve hisse senetleri gibi tüm sembollerde/araçlarda kullanılabilen %100 yeniden boyamayan çoklu zaman çerçevesi ve Çoklu para birimi göstergesidir. Trend Screener, grafikte noktalarla ok trend sinyalleri sağlayan etkili bir trend trend göstergesidir. Trend analizörü göstergesinde bulunan özellikler: 1.
MONEYTRON – ТВОЙ ЛИЧНЫЙ СИГНАЛ НА УСПЕХ! XAUUSD | AUDUSD | USDJPY | BTCUSD Поддержка таймфреймов: M5, M15, M30, H1 Почему трейдеры выбирают Moneytron? 82% успешных сделок — это не просто цифры, это результат продуманной логики, точного алгоритма и настоящей силы анализа. Автоматические сигналы на вход — не нужно гадать: когда покупать, когда продавать. 3 уровня Take Profit — ты сам выбираешь свой уровень прибыли: безопасный, уверенный или максимум. Четкий Stop Loss — контролируешь риск
Algo Pumping
Ihor Otkydach
5 (7)
PUMPING STATION – Kişisel “her şey dahil” stratejiniz Karşınızda PUMPING STATION — forex dünyasında işlem yapma şeklinizi heyecan verici ve etkili bir sürece dönüştürecek devrim niteliğinde bir gösterge. Bu sadece bir yardımcı değil, güçlü algoritmalarla donatılmış tam teşekküllü bir ticaret sistemidir ve daha istikrarlı işlem yapmanıza yardımcı olur. Bu ürünü satın aldığınızda ŞUNLARI ÜCRETSİZ olarak alırsınız: Özel ayar dosyaları: Otomatik kurulum ve maksimum performans için. Adım adım video e
Golden Trend Indicator MT5
Noha Mohamed Fathy Younes Badr
4.89 (18)
Golden Trend indicator  is The best indicator for predicting trend movement this indicator never lags and never repaints and never back paints    and give  arrow buy and sell    before the candle appear  and it will help you and  will make your trading decisions clearer its work on all currencies and  gold and crypto and all time frame This unique  indicator uses very secret algorithms to catch the  trends, so you can trade using this indicator and see the trend clear on charts  manual guide and
FX Volume MT5
Daniel Stein
4.82 (17)
FX Volume: Bir Broker’ın Perspektifinden Gerçek Piyasa Duyarlılığını Deneyimleyin Kısa Özet Trading yaklaşımınızı bir adım öteye taşımak ister misiniz? FX Volume , perakende traderlar ile brokerların nasıl konumlandığını gerçek zamanlı olarak sunar—COT gibi gecikmeli raporlardan çok daha önce. İster istikrarlı kazançları hedefliyor olun, ister piyasada daha güçlü bir avantaj arayın, FX Volume önemli dengesizlikleri belirlemenize, kırılmaları (breakout) doğrulamanıza ve risk yönetiminizi iyileş
Support And Resistance Screener, MetaTrader için tek bir gösterge içinde birden fazla araç sağlayan tek bir Düzey göstergesindedir. Kullanılabilir araçlar şunlardır: 1. Piyasa Yapısı Eleme Aracı. 2. Geri Çekilme Bölgesi Boğa. 3. Geri Çekilme Bölgesi Ayı. 4. Günlük Pivot Noktaları 5. haftalık Pivot Noktaları 6. aylık Pivot Puanları 7. Harmonik Modele ve hacme dayalı Güçlü Destek ve Direnç. 8. Banka Seviyesi Bölgeleri. SINIRLI SÜRELİ TEKLİF : YG Destek ve Direnç Göstergesi sadece 50 $ ve ömür boyu
FX Power MT5 NG
Daniel Stein
5 (14)
FX Power: Daha Akıllı Ticaret Kararları için Para Birimlerinin Gücünü Analiz Edin Genel Bakış FX Power , her piyasa koşulunda başlıca para birimlerinin ve altının gerçek gücünü anlamak için vazgeçilmez bir araçtır. Güçlü para birimlerini alıp zayıf olanları satarak, FX Power ticaret kararlarınızı basitleştirir ve yüksek olasılıklı fırsatları ortaya çıkarır. İster trendlere sadık kalın ister Delta'nın aşırı değerlerini kullanarak tersine dönüşleri öngörün, bu araç ticaret tarzınıza mükemmel bir
Size mükemmel bir teknik gösterge olan Grabber’ı tanıtıyorum. Bu araç, kullanıma hazır bir “her şey dahil” işlem stratejisi olarak çalışır. Tek bir yazılım kodu içinde güçlü piyasa teknik analiz araçları, işlem sinyalleri (oklar), uyarı işlevleri ve push bildirimleri entegre edilmiştir. Bu göstergeyi satın alan herkes aşağıdaki hediyeleri ücretsiz olarak alır: Açık emirleri otomatik yönetmek için Grabber Yardımcı Aracı Kurulum, yapılandırma ve nasıl işlem yapılacağını adım adım anlatan video kıl
Quantum TrendPulse
Bogdan Ion Puscasu
5 (13)
SuperTrend   ,   RSI   ve   Stochastic'in   gücünü tek bir kapsamlı göstergede birleştirerek işlem potansiyelinizi en üst düzeye çıkaran nihai işlem aracı olan   Quantum TrendPulse'u   tanıtıyoruz. Hassasiyet ve verimlilik arayan yatırımcılar için tasarlanan bu gösterge, piyasa trendlerini, momentum değişimlerini ve en uygun giriş ve çıkış noktalarını güvenle belirlemenize yardımcı olur. Temel Özellikler: SuperTrend Entegrasyonu:   Güncel piyasa trendlerini kolayca takip edin ve karlılık dalgası
TPSproTREND PrO MT5
Roman Podpora
4.72 (18)
VERSION MT4        —        ИНСТРУКЦИЯ RUS           —        INSTRUCTIONS  ENG Ana işlevler: VERME OLMADAN doğru giriş sinyalleri! Bir sinyal belirirse, alakalı kalır! Bu, bir sinyal sağlayıp daha sonra onu değiştirebilen ve mevduatta fon kaybına yol açabilen yeniden çekme göstergelerinden önemli bir farktır. Artık pazara daha büyük bir olasılık ve doğrulukla girebilirsiniz. Ayrıca, ok göründükten sonra hedefe ulaşılıncaya kadar (kar al) veya bir geri dönüş sinyali görünene kadar mumları renkle
Gold Stuff mt5
Vasiliy Strukov
4.93 (178)
Gold Stuff mt5, özellikle altın için tasarlanmış bir trend göstergesidir ve herhangi bir finansal enstrümanda da kullanılabilir. Gösterge yeniden çizilmez ve gecikmez. Önerilen zaman dilimi H1. Ayarları ve kişisel bir bonusu almak için satın alma işleminden hemen sonra benimle iletişime geçin!  Güçlü Destek ve Trend Tarayıcı göstergemizin ücretsiz bir kopyasını pm'den alabilirsiniz. Ben!   AYARLAR Ok Çiz - açık kapalı. grafik üzerinde oklar çizmek. Uyarılar - sesli uyarılar kapalı. E-posta b
FX Levels MT5
Daniel Stein
5 (4)
FX Levels: Tüm Piyasalar İçin Son Derece Hassas Destek ve Direnç Hızlı Bakış Döviz kurları, endeksler, hisseler veya emtialar gibi herhangi bir piyasada güvenilir destek ve direnç seviyeleri belirlemek mi istiyorsunuz? FX Levels geleneksel “Lighthouse” yöntemini ileri düzey bir dinamik yaklaşımla birleştirerek neredeyse evrensel bir doğruluk sağlar. Gerçek broker deneyimimize ve otomatik günlük güncellemeler ile gerçek zamanlı güncellemelerin birleşimine dayalı olarak, FX Levels size dönüş nok
Matrix Arrow Indicator MT5
Juvenille Emperor Limited
5 (13)
Matrix Arrow Indicator MT5 ,   forex ,   emtialar ,   kripto   para birimleri ,   endeksler ,   hisse senetleri   gibi tüm sembollerde/araçlarda kullanılabilen   %100 yeniden boyamayan   çoklu zaman çerçevesi göstergesini izleyen benzersiz bir 10'u 1 arada trenddir.  Matrix Arrow Indicator MT5 , mevcut eğilimi erken aşamalarında belirleyecek ve aşağıdakiler gibi 10'a kadar standart göstergeden bilgi ve veri toplayacaktır: Ortalama Yönlü Hareket Endeksi (ADX) Emtia Kanal Endeksi (CCI) Klasik Hei
IX Power MT5
Daniel Stein
4.86 (7)
IX Power: Endeksler, Emtialar, Kripto Paralar ve Forex Piyasaları için İçgörüler Genel Bakış IX Power , endeksler, emtialar, kripto paralar ve forex sembollerinin gücünü analiz etmek için tasarlanmış çok yönlü bir araçtır. FX Power , tüm kullanılabilir döviz çiftlerinin verilerini kullanarak döviz çiftleri için maksimum doğruluk sağlarken, IX Power yalnızca temel sembolün piyasa verilerine odaklanır. Bu, IX Power 'ı forex dışındaki piyasalar için ideal ve daha basit forex analizleri için güven
TPSpro RFI Levels MT5
Roman Podpora
4.55 (20)
Geri dönüş bölgeleri / Tepe hacimleri / Önemli bir oyuncunun aktif bölgeleri =       TS TPSPROSİSTEMİ TALİMATLAR RUS       /       TALİMATLAR       ENG       /           Sürüm MT4        Bu göstergenin her alıcısı ayrıca ÜCRETSİZ şunları elde eder: RFI SIGNALS servisinden işlem sinyallerine 6 ay erişim - TPSproSYSTEM algoritmasına göre hazır giriş noktaları. Düzenli olarak güncellenen eğitim materyalleri - stratejiye dalın ve profesyonel seviyenizi yükseltin. Hafta içi 7/24 destek ve kapalı ya
Trade smarter, not harder: Empower your trading with Harmonacci Patterns This is arguably the most complete harmonic price formation auto-recognition indicator you can find for the MetaTrader Platform. It detects 19 different patterns, takes fibonacci projections as seriously as you do, displays the Potential Reversal Zone (PRZ) and finds suitable stop-loss and take-profit levels. [ Installation Guide | Update Guide | Troubleshooting | FAQ | All Products ] It detects 19 different harmonic pri
MTF Supply Demand Zones MT5
Georgios Kalomoiropoulos
5 (1)
Yeni Nesil Otomatik Arz ve Talep Bölgeleri. Her Grafikte Çalışan Yeni ve Yenilikçi Algoritma. Tüm Bölgeler Piyasanın Fiyat Hareketine Göre Dinamik Olarak Oluşturulmaktadır. İKİ TÜR UYARI --> 1) FİYAT BİR BÖLGEYE ÇIKTIĞINDA 2) YENİ BİR BÖLGE OLUŞTURDUĞUNDA Bir tane daha işe yaramaz gösterge almazsın. Kanıtlanmış Sonuçlarla eksiksiz bir Ticaret Stratejisi elde edersiniz.     Yeni özellikler:     Fiyat Arz/Talep Bölgesine ulaştığında uyarılar     Yeni bir Arz/Talep Bölgesi oluşturulduğunda
Precision Index Osilatörü (Pi-Osc) - Precision Trading Systems'dan Roger Medcalf Sürüm 2, grafiklerinizde hızlı bir şekilde yüklenmek üzere dikkatle yeniden kodlandı ve deneyimi artırmak için bazı teknik geliştirmeler de içerdi. Pi-Osc, herkesin stoplarını almak için zorlanan pazarların gitmek zorunda kaldığı aşırı yorgunluk noktalarını bulmak için tasarlanmış doğru ticaret zamanlama sinyalleri sunmak amacıyla oluşturuldu. Bu ürün, aşırı noktaların nerede olduğunu bilmek gibi yaşlı bir sorun
The   Time_Price_SQ9_Degree   indicator is based on the 9 Gann square. Using this indicator, you can identify strong time and price zones. The indicator displays the levels as a degree value. The degrees can be set in the settings. After launching, the MENU button appears. If it is highlighted, it can be moved to any point on the graph, and after double-clicking on it, it stops being highlighted and menu buttons appear. To hide the menu, just double-click on the button, it will become highlight
FX Dynamic: Özelleştirilebilir ATR Analiziyle Volatilite ve Trendleri Takip Edin Genel Bakış FX Dynamic , ortalama gerçek aralık (ATR) hesaplamalarını kullanarak günlük ve gün içi volatilite hakkında rakipsiz bilgiler sağlayan güçlü bir araçtır. 80%, 100%, 130% gibi net volatilite eşikleri ayarlayarak, piyasa olağan hareketlerinin ötesine geçtiğinde hızlı şekilde uyarı alabilir ve potansiyel kazanç fırsatlarını süratle tespit edebilirsiniz. FX Dynamic , brokerınızın zaman dilimine uyum sağlaya
Ortalama geri dönüş ticareti için profesyonel ve nicel bir yaklaşım uygulayan benzersiz gösterge. Fiyatın tahmin edilebilir ve ölçülebilir bir şekilde ortalamaya döndüğü ve yön değiştirdiği gerçeğinden yararlanır, bu da nicel olmayan ticaret stratejilerinden büyük ölçüde daha iyi performans gösteren net giriş ve çıkış kurallarına izin verir. [ Installation Guide | Update Guide | Troubleshooting | FAQ | All Products ] Ticaret sinyallerini temizle Ticaret yapmak inanılmaz derecede kolay Özelleşt
Öncelikle, bu Ticaret Aracının Non-Repainting, Non-Redrawing ve Non-Lagging Gösterge olduğunu vurgulamakta fayda var, bu da onu profesyonel ticaret için ideal hale getiriyor. Çevrimiçi kurs, kullanıcı kılavuzu ve demo. Akıllı Fiyat Hareketi Kavramları Göstergesi, hem yeni hem de deneyimli tüccarlar için çok güçlü bir araçtır. İleri ticaret fikirlerini, Inner Circle Trader Analizi ve Smart Money Concepts Ticaret Stratejileri gibi 20'den fazla kullanışlı göstergeyi bir araya getirerek bir araya
Unlock key market insights with automated support and resistance lines Tired of plotting support and resistance lines? This is a multi-timeframe indicator that detects and plots supports and resistance lines in the chart with the same precision as a human eye would. As price levels are tested over time and its importance increases, the lines become thicker and darker, making price leves easy to glance and evaluate. [ Installation Guide | Update Guide | Troubleshooting | FAQ | All Products ] Boos
Legend mt5
Vladyslava Shaviernieva
This is an indicator that includes the best basic forex indicators , without redrawing. Based on this data, a sell or buy signal is generated. It does not disappear anywhere after the signal, which gives us the opportunity to see the results on the history. It can be used on any currency pair, crypto, metals, stocks It is best used on an hourly chart, but other periods are also acceptable. The best results for the period H1,H4,daily If customers have any questions, I will answer them and af
AÇIKLAMA ICSM (Impulse-Correction SCOB Mapper), fiyat hareketini analiz eden ve geçerli impulsları, düzeltmeleri ve SCOB'ları (Single Candle Order Block) tanımlayan göstergedir. Esnek, bilgilendirici, kullanımı kolay olması ve tüccarın en likit ilgi alanlarına yönelik farkındalığını önemli ölçüde artırması nedeniyle her türlü teknik analizle kullanılabilen güçlü bir araçtır. AYARLAR Genel | Görsel Renk teması — ICSM'nin renk temasını tanımlar. SCOB | Görsel SCOB'u göster — SCOB'u etkinleş
Auto Order Block with break of structure based on ICT and Smart Money Concepts (SMC) Futures Break of Structure ( BoS )             Order block ( OB )            Higher time frame Order block / Point of Interest ( POI )    shown on current chart           Fair value Gap ( FVG ) / Imbalance   -  MTF      ( Multi Time Frame )    HH/LL/HL/LH  -  MTF      ( Multi Time Frame )  Choch  MTF      ( Multi Time Frame )  Volume Imbalance     ,  MTF          vIMB Gap’s Power of 3 Equal High / Low’s  
ICT, SMC, SMART MONEY CONCEPTS, SMART MONEY, Smart Money Concept, Support and Resistance, Trend Analysis, Price Action, Market Structure, Order Blocks, BOS/CHoCH,   Breaker Blocks ,  Momentum Shift,   Supply&Demand Zone/Order Blocks , Strong Imbalance,   HH/LL/HL/LH,    Fair Value Gap, FVG,  Premium  &   Discount   Zones, Fibonacci Retracement, OTE, Buy Side Liquidity, Sell Side Liquidity, BSL/SSL Taken, Equal Highs & Lows, MTF Dashboard, Multiple Time Frame, BigBar, HTF OB, HTF Market Structure
Easy Buy Sell is a market indicator for opening and closing positions. It becomes easy to track market entries with alerts. It indicates trend reversal points when a price reaches extreme values ​​and the most favorable time to enter the market. it is as effective as a Fibonacci to find a level but it uses different tools such as an algorithm based on ATR indicators and Stochastic Oscillator. You can modify these two parameters as you wish to adapt the settings to the desired period. It cannot
ATrend
Zaha Feiz
4.77 (13)
ATREND: Nasıl Çalışır ve Nasıl Kullanılır ### Nasıl Çalışır "**ATREND**" göstergesi, MT5 platformu için tasarlanmış olup, traderlara sağlam alım ve satım sinyalleri sağlamak amacıyla teknik analiz metodolojilerinin bir kombinasyonunu kullanır. Bu gösterge, öncelikle volatilite ölçümü için Ortalama Gerçek Aralık (ATR) kullanır ve potansiyel piyasa hareketlerini belirlemek için trend tespit algoritmalarıyla birleştirir. Satın aldıktan sonra bir mesaj bırakın ve özel bir bonus hediyesi kazanın. ##
Advanced Supply Demand MT5
Bernhard Schweigert
4.5 (14)
Herhangi bir Acemi veya Uzman Tüccar için En İyi Çözüm! Bu gösterge benzersiz, yüksek kaliteli ve uygun fiyatlı bir ticaret aracıdır çünkü bir dizi tescilli özelliği ve yeni bir formülü bir araya getirdik. Bu güncelleme ile çift zaman dilimi dilimlerini gösterebileceksiniz. Yalnızca daha yüksek bir TF gösteremeyeceksiniz, aynı zamanda TF grafiğini ve ARTIK daha yüksek TF'yi de gösterebileceksiniz: YUVARLAK BÖLGELERİ GÖSTERMEK. Tüm Arz Talebi tüccarları buna bayılacak. :) Önemli Bilgiler Açıkland
Yazarın diğer ürünleri
Trend Osilatörü: Pürüzsüz ve Güvenilir Piyasa Trend Tanımlaması Trend Osilatörü, yatırımcıların trend yönünü ve potansiyel dönüş noktalarını doğru bir şekilde belirlemelerine yardımcı olmak için tasarlanmış, MT4 için gelişmiş bir göstergedir. Sezgisel bir görsel gösterim ile bu gösterge, piyasanın yukarı veya aşağı trendde olduğunu net bir şekilde gösterir, analizi basitleştirir ve grafiğin okunabilirliğini artırır. Çeşitli piyasalarda ve zaman dilimlerinde kullanılabilir, bu da farklı işlem iht
EA Gold Trader for Prop-Firms Prop Firm zorluklarını hassasiyet ve güvenilirlikle aşmanız için mükemmel bir müttefik! "EA Gold Trader for Prop-Firms", en bilinen Prop Firm'lerin zorluklarını başarıyla tamamlamak ve sonraki aşamalarda işlemlerin kontrolünü ve istikrarını sağlamak amacıyla özel olarak tasarlanmış bir Uzman Danışman (Expert Advisor)dır. Esnek yapılandırması ve optimize edilmiş parametreleri sayesinde, bu EA Prop Firm gereksinimlerini karşılamak için idealdir ve güvenilir, kontrollü
Maximize Your Trading Opportunities with the "Auto Trendlines" Indicator Discover the "Auto Trendlines" Indicator: "Auto Trendlines" is the essential tool for every technical trader. This indicator automatically plots trend lines, pinpointing support and resistance levels with surgical precision. It's ideal for those looking to capitalize on market breakouts and reversals. Key Features: Automatic Trendline Plotting: Identifies and draws crucial trend lines without manual intervention. Advanced C
MetaTrader 5 için Ücretsiz Spread Göstergesi Bu gösterge, MetaTrader 5'te spread hakkında ayrıntılı bir analiz sunar. Spread, bir varlığın alış (Ask) fiyatı ile satış (Bid) fiyatı arasındaki farkı temsil ettiği için, traderlar için en önemli parametrelerden biridir. Gösterge şunları içerir: Ortalama Spread : Gün boyunca gözlemlenen en yüksek ve en düşük spread arasındaki ortalama olarak hesaplanır. Mevcut Spread : Mevcut piyasa spreadini gösterir. Minimum Spread : Gün boyunca ulaşılan en düşük s
FREE
Volume Profile Indicator for MT4 Gain a trading edge with the "Volume Profile" indicator for MetaTrader 4 (MT4). This advanced technical analysis tool allows you to precisely identify key support and resistance levels based on transaction volume. Easily visualize market areas of high interest, where trading volumes are highest, and use this information to make more informed trading decisions. Key Features: Clear and detailed visualization : The indicator displays volume histograms directly on th
Ultimate Follow Line v3 Trendi hassasiyetle takip etmek için nihai gösterge! Ultimate Follow Line v3 ile tanışın. MetaTrader 4 için tasarlanmış bu gösterge, piyasa yönünü net bir şekilde tanımlamanıza yardımcı olur. MQL4'te geliştirilen bu araç, basit ve etkili bir tasarımı ileri teknolojiyle birleştirerek yatırımcılara güçlü ve sezgisel bir araç sunar. Ana özellikler: Sezgisel görselleştirme: Fiyat hareketine uyum sağlayan dinamik çizgiler, önemli dönüş ve trend devam bölgelerini vurgular. Ki
77.90 USD'DEN 37.90 USD'YE DÜŞEN İNDİRİM, 1 EYLÜL PAZAR GÜNÜNE KADAR GEÇERLİDİR "Forex Scanner" Nedir? "Forex Scanner", Forex piyasasında gerçek zamanlı olarak size kapsamlı bir genel bakış sağlamak için tasarlanmış güçlü bir ticaret aracıdır. Bu gelişmiş gösterge, birden fazla teknik göstergeden ve zaman dilimlerinden önemli verileri toplar, böylece ticaret fırsatlarını hızla belirlemenizi sağlar. Çok sayıda varlık ve parametreyi izlemek istiyorsanız, grafikler arasında geçiş yapmadan "Forex Sc
FREE Spread indicator for MetaTrader 4 this indicator includes: -average spread -current spread -minimum spread -maximum spread If you are interested in my products I recommend you visit my page where you can find: Experts Advisors:  https://www.mql5.com/it/market/product/119456?source=Site+Profile indicators:  https://www.mql5.com/it/market/product/120038?source=Site+Profile I hope the spread indicator will be useful to you. https://www.mql5.com/it/users/kappa05
FREE
Presentation of the "Color Range Indicator" The "Color Range Indicator" is a powerful technical analysis tool designed for the MT4 platform, perfect for traders who want a clear and immediate view of market trends. This indicator draws a colored line based on the current trend, making it easier to interpret price movements. Indicator Description: Green line : Indicates an uptrend. Use this signal to consider buying opportunities. Red line : Indicates a downtrend. Use this signal to consider sell
Follow Line göstergesi, piyasa eğilimlerini doğru bir şekilde belirlemek ve izlemek isteyen yatırımcılar için vazgeçilmez bir araçtır. Bu gösterge, fiyat değişimlerine dinamik olarak uyum sağlar ve fiyat hareketlerini düzgün ve sürekli bir şekilde izleyen bir çizgi çizer. Görsel sadeliği ve trend değişimlerini sinyallemede etkinliği ile Follow Line, her yatırımcının stratejisine mükemmel bir katkı sağlar. Ana Özellikler: Trend Takibi: Follow Line, fiyatı yakından takip eder ve yatırımcıların mev
"Real Time MultiIndicator" Nedir? "Real Time MultiIndicator", teknik analizinizi basitleştirmek ve optimize etmek için tasarlanmış gelişmiş bir ticaret aracıdır. Bu devrim niteliğindeki gösterge, birden fazla zaman diliminden ve teknik göstergeden gelen sinyalleri toplar ve bunları tek, net ve okunması kolay bir tabloda görüntüler. Sürekli olarak grafik değiştirmeden veya her göstergesi manuel olarak analiz etmeden piyasayı tam ve ayrıntılı bir şekilde görmek istiyorsanız, "Real Time MultiIndica
Enhanced RSI: Daha Derin Teknik Analiz için Hibrit Bir Gösterge Enhanced RSI, yatırımcılara daha kapsamlı ve doğru bir piyasa analizi sağlamak için tasarlanmış, çok yönlü ve özelleştirilebilir bir teknik göstergedir. Hareketli ortalamalar, RSI ve MACD'nin en iyi özelliklerini birleştirerek, bu gösterge, momentum ve trend gücü hakkında çok boyutlu bir bakış açısı sunar. Ana Özellikler: Mükemmel Hibritleşme: Enhanced RSI, hareketli ortalamalar, RSI ve MACD'nin yeteneklerini birleştirerek fiyat har
Forex Scalper Göstergesi – Finansal Piyasalarda Kazanmak İçin Hassasiyet Aracınız MT4 için Forex Scalper Göstergesi, piyasada maksimum hassasiyetle scalping yapmak isteyen tüm yatırımcılar için mükemmel bir yardımcıdır. Hassas verilere dayalı analiz sayesinde, bu gösterge size hızlı kararlar vermenizi sağlayacak, zamanında ve doğru sinyaller sunar. Özel Hassasiyet Grafikte gösterilen her bir ok titiz hesaplamalarla oluşturulmuştur ve en iyi giriş ve çıkış fırsatlarını sağlar. Bunlar rastgele s
AI Trading Consultant , piyasaları analiz etmek ve anlamak için güvenilir bir teknoloji tabanlı araç arayan yatırımcılar için geliştirilmiş gelişmiş bir göstergedir. Uzun kısa süreli hafıza içeren bir tekrarlayan sinir ağı ( RNN LSTM ) tarafından desteklenen AI Trading Consultant, alım ve satım sinyallerini net bir şekilde sunarak, potansiyel piyasa hareketlerini belirlemeye yardımcı olur ve işlem kararlarını destekler. Temel Özellikler: Gelişmiş Yapay Zeka (RNN LSTM) Bu gösterge, uzun süreli h
BTC Follow Line - Bitcoin Ticaret Rehberiniz BTC Follow Line, yalnızca kripto para piyasaları için tasarlanmış, özellikle Bitcoin’e odaklanan gelişmiş bir göstergedir. Orta ve uzun vadeli güvenilir Al ve Sat sinyalleri arayanlar için mükemmeldir. Bu araç, tüm zaman dilimlerinde çalışır ve ticaret ihtiyaçlarınıza uyum sağlar. Neden BTC Follow Line’ı tercih etmelisiniz? Basit ve sezgisel : Temiz ve kolay okunabilir bir arayüz, zahmetsizce bilinçli kararlar almanıza yardımcı olur. Çok yönlülük : Hı
AI Indicator: Akıllı Ticaretin Geleceği Elinizin Altında Yeni bir ticaret çağrısına hoş geldiniz. AI Indicator , tüm seviyelerdeki traderlar için mükemmel bir yardımcıdır ve güvenilir verilere ve gelişmiş analizlere dayalı kararlar almanıza yardımcı olmak için tasarlanmıştır. Yapay Zeka'nın (AI) gücünden yararlanan bu araç, her piyasada ve her zaman diliminde uyum sağlama yeteneğiyle öne çıkar ve net ve kesin ticaret sinyalleri sunar. Yapay Zeka nedir ve ticarette neden önemlidir? Yapay Zeka (AI
Ultimate Arrow Indicator - Ticaret Başarınız için Araç! Çok şey vaat eden ama az şey sunan araçlardan bıktınız mı? MT4 için Ultimate Arrow Indicator, ticaretinizi bir sonraki seviyeye taşıyan nihai çözümünüzdür. Bu gösterge, size net, güvenilir ve tavizsiz sinyaller sunmak için cerrahi bir hassasiyetle tasarlanmıştır. İşte bu yüzden Ultimate Arrow Indicator, deneyimli trader'lar ve yeni başlayanlar için ideal bir seçimdir: Olağanüstü Performans - Kanıtlanmış Sonuçlar 1 yıl detaylı geri test: %9
Just Trade Indicator – Kesin ve stresiz işlem için en iyi yardımcınız! Just Trade Indicator'ı keşfedin! MetaTrader 5 için geliştirilen bu güçlü gösterge, piyasada net giriş ve çıkış noktalarını belirlemenize yardımcı olur. Gelişmiş algoritmaları sayesinde, işlem sürecinizi kolaylaştıran sezgisel görsel sinyaller sunar. Neden Just Trade Indicator? Net ve doğru sinyaller – Alım ve satım sinyalleri doğrudan grafikte oklarla gösterilir, yorumlama hatalarını ortadan kaldırır. Çoklu zaman dil
IMPORTANT: The indicator will remain at the price of $34.90 until the release of the update scheduled for July 16, 2024. The New Price will be $49.90 (taxes excluded) FVG indicator. If you are an SMC trader this indicator will be very useful to you, it automatically identifies the FVGs on the graph distinguishing them into 2 types: bearish FVGs and bullish FVGs (see the photos to understand better). This indicator works on any Timeframe and on any market you want to use it. If you are interested
Expert Advisor for scalping; This EA was built for monthly profitability. Works on any asset: Forex, Indices, Crypto and Stocks. Perfectly usable in MT5 tester and usable on any TimeFrame. The EA has various inputs available to customize operations: -Lots -Risk% (0 = Fix) -OrderDist (the distance between one order and another, the distance is calculated in points not pips) -TP (in points) -Sl (in points) -TrailingStopTrigger(the trailing stop trigger point in points) -TrailingStop(distance from
Highs, Lows and Bos Indicator for MT5; The indicator works on any type of market and on all TimeFrames. It also works on the MetaTrader5 Tester. the main function of the indicator is to identify the highs and lows by marking them with a point above/below the candle, then with a horizontal line it marks the Bos. It is very simple and intuitive, there are only 2 inputs: -the color of the maximums -the color of the minima For any other information do not hesitate to contact me.
Panel Info Trade For MT5; The indicator has 2 main objects: -An icon chart that you can change Timeframe, zoom, Forex Pair, crypto....the position of the graph can be modified via the (x;y) inputs. The chart is perfectly usable in the MT5 tester. If the graph isn't for you and doesn't help you with anything, you can press the button on the top right to make it smaller. -the second object is a dynamic control panel where you can change plots, place sl and tp, BE, close partial... (if you watch th
Para Birimi Güç Endeksi (Currency Strength Index - CSI) Göstergesi GÖSTERGEYİ ETKİNLEŞTİRMEDEN ÖNCE, PARİTELERİ GÖRÜNTÜLEMEK İÇİN "TRUE" OLARAK AYARLADIĞINIZDAN EMİN OLUN Para Birimi Güç Endeksi (Currency Strength Index - CSI) Göstergesi, forex ticaretinde ana para birimlerinin göreceli gücünü ölçmek için kullanılan güçlü bir araçtır. Bu gösterge, tüccarların belirli bir zamanda en güçlü ve en zayıf para birimlerini belirlemelerine yardımcı olarak daha bilinçli ticaret kararları vermelerini sağl
In the world of trading, the key to success lies in having the right tools at the right time. Our innovative Volume Profile indicator was developed with one goal in mind: to provide traders with unprecedented access to vital market activity information. This cutting-edge tool allows you to not only see where and when volumes are traded but also to understand market depth with clarity never seen before. Main Features: Temporal Flexibility: Set the analysis range up to 1800 minutes to perfectly ma
Optimize Your Trading Decisions with the "autoFibo" Indicator Discover the "autoFibo" Indicator: "autoFibo" is the essential analysis tool for traders who want to fully leverage Fibonacci levels without the hassle of manual plotting. This indicator automates the Fibonacci retracement process, providing instant visual access to key support and resistance zones. Key Features: Automatic Fibonacci Retracement: Automatically plots Fibonacci levels, making it easy to identify support and resistance zo
Enhance Your Trading Performance with the "Better Volume" Indicator Discover the "Better Volume" Indicator: The "Better Volume" is the essential market volume analysis tool for traders aiming to stand out. It analyzes tick volumes with unprecedented accuracy, featuring an advanced moving average function (PERIOD_MA) and customizable buy and sell alerts. Key Features: Advanced Volume Analysis: Recognize volume peaks signaling crucial price movements. Intuitive Buy and Sell Alerts: Stay one step a
Enhance Your Trading Strategies with the "Order Block" Indicator for MT4 Discover the "Order Block" Indicator: The "Order Block" Indicator for MT4 is designed to help you precisely identify order blocks in the market by marking the highs and lows of the order block candles. This powerful tool enables you to understand where large institutions place their orders, improving your ability to predict market movements. Key Features: Precise Order Block Detection: Automatically highlights the highs and
SuperTrend , trend yönünü belirlemek ve giriş-çıkış sinyalleri oluşturmak için ticarette en etkili ve yaygın olarak kullanılan teknik göstergelerden biridir. Volatilite ve trende dayalı olarak, bu gösterge piyasa koşullarına dinamik olarak uyum sağlar ve yatırımcılara net bir görsel referans sunar. Ana Özellikler: Trend Tespiti: SuperTrend piyasa trendini takip eder, düşüş trendinde fiyatın üzerinde, yükseliş trendinde ise fiyatın altında bir çizgi çizer. Kullanım Kolaylığı: Sezgisel grafik göst
Yeni Birleşik Gösterge - 3'ü 1 Arada Piyasa analizlerinizi ve yatırım stratejilerinizi geliştirecek ticaret araçları mı arıyorsunuz? En iyi üç göstergemizi tek bir güçlü ve uygun çözüme birleştirdik, böylece ticaretiniz için en iyi değeri elde etmenizi sağladık. 1. Order Block Göstergesi (daha önce 32,90$'ya satıldı) Order Block Göstergesi, piyasada güçlü kurumsal ilgi alanlarını belirlemek için temel bir araçtır. Bu gösterge, fiyat tersine dönüşlerinin veya trend devamlarının meydana gelebilece
MetaTrader 5 için "Positions Manager" , pozisyonlarını verimli ve otomatik bir şekilde yönetmek isteyen yatırımcılar için vazgeçilmez bir araçtır. Bu gelişmiş araç, yatırımcıların işlemlerini kontrol etmelerine, risk yönetimini iyileştirmelerine ve Break Even ve Trailing Stop gibi özelliklerle potansiyel kazançları maksimize etmelerine yardımcı olmak için tasarlanmıştır. Ana Özellikler: Otomatik Break Even: Break Even'i etkinleştirme seçeneğiyle "Positions Manager", piyasa lehinize hareket ettiğ
Filtrele:
İnceleme yok
İncelemeye yanıt