• Genel bakış
  • İncelemeler
  • Yorumlar

Going Arrows

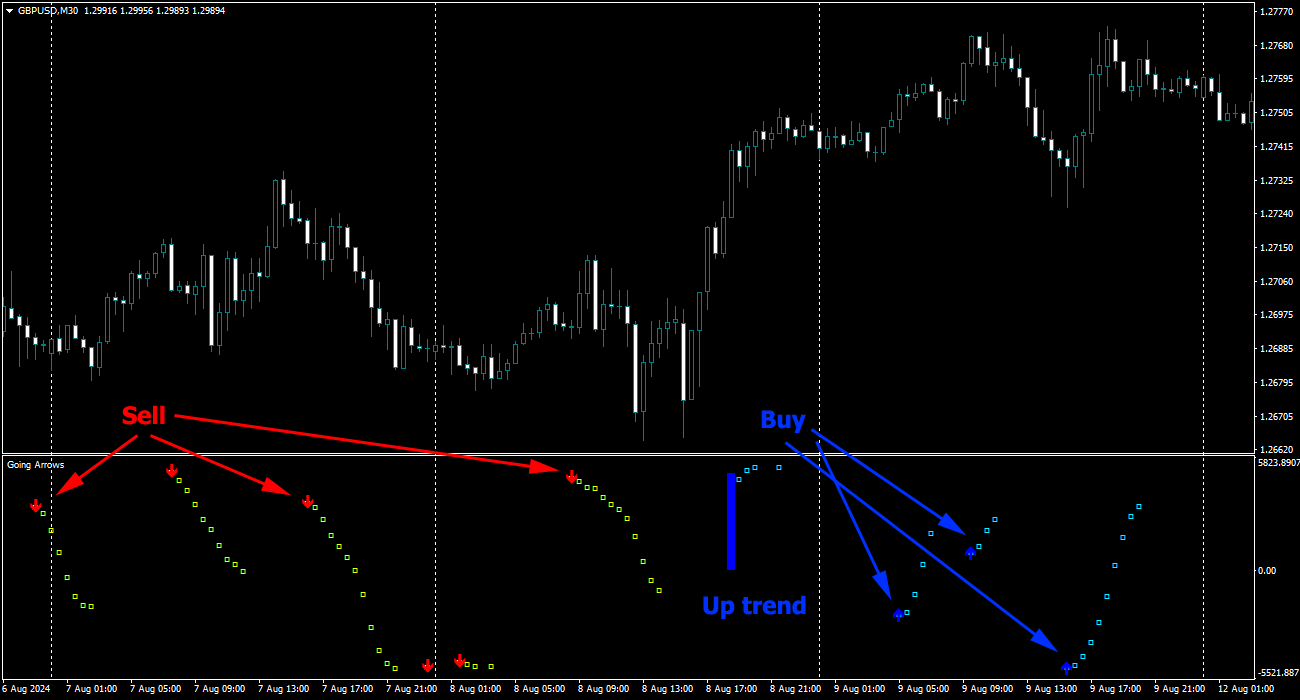
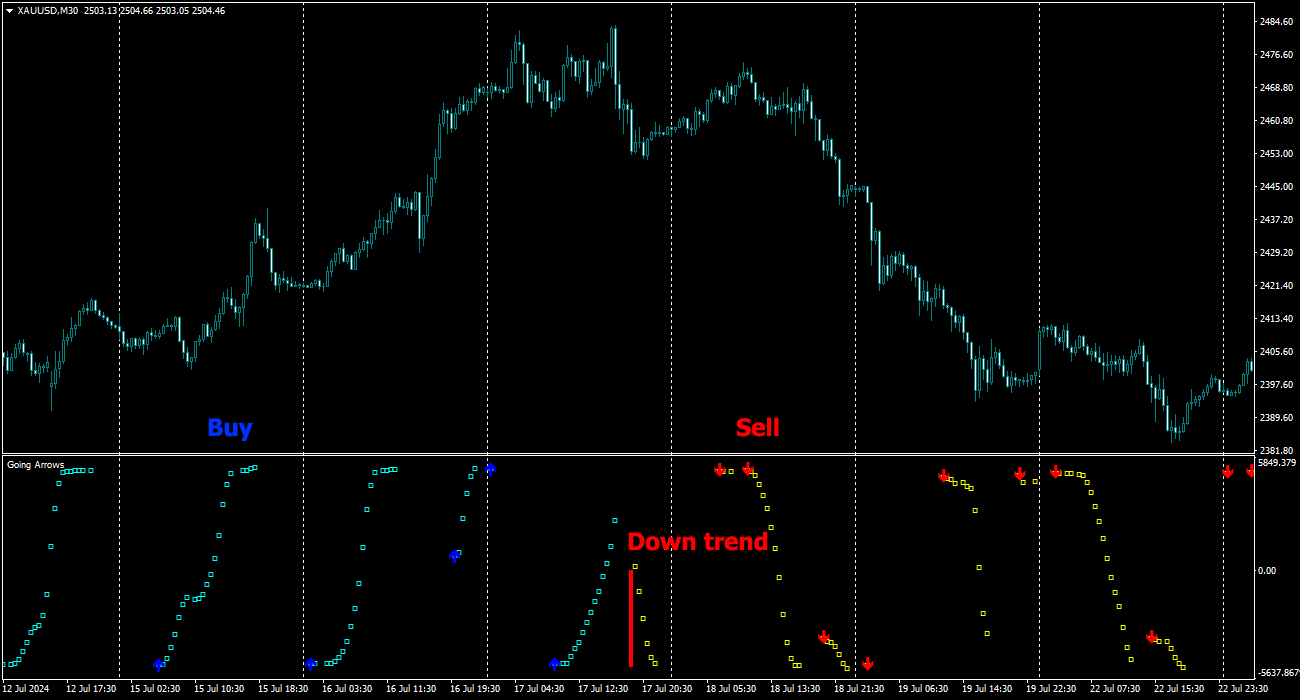
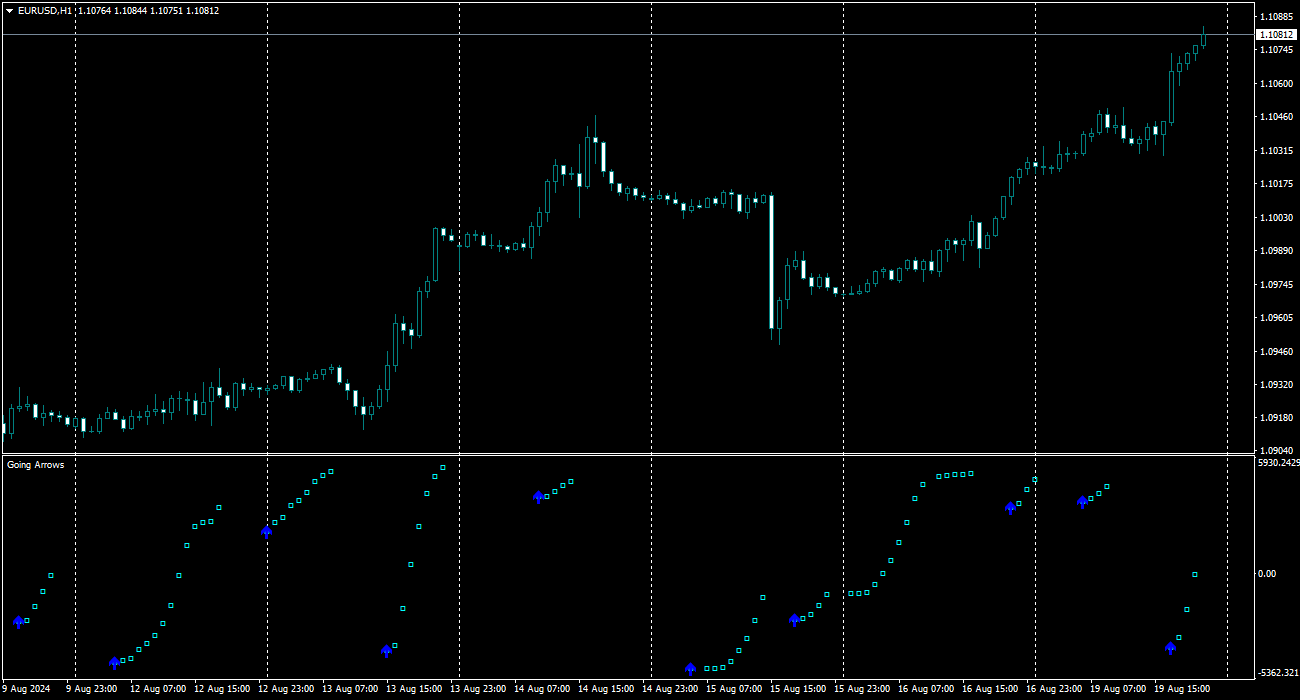
Özellikle scalping için tasarlanmış, volatilite dürtülerini tanımlayabilen ve sürelerini gösterebilen teknik bir gösterge.
Göstergenin işlevselliğini herhangi bir ticaret aracına uygulamanıza olanak tanıyan, manuel ayarlar için esnek parametrelere sahiptir.
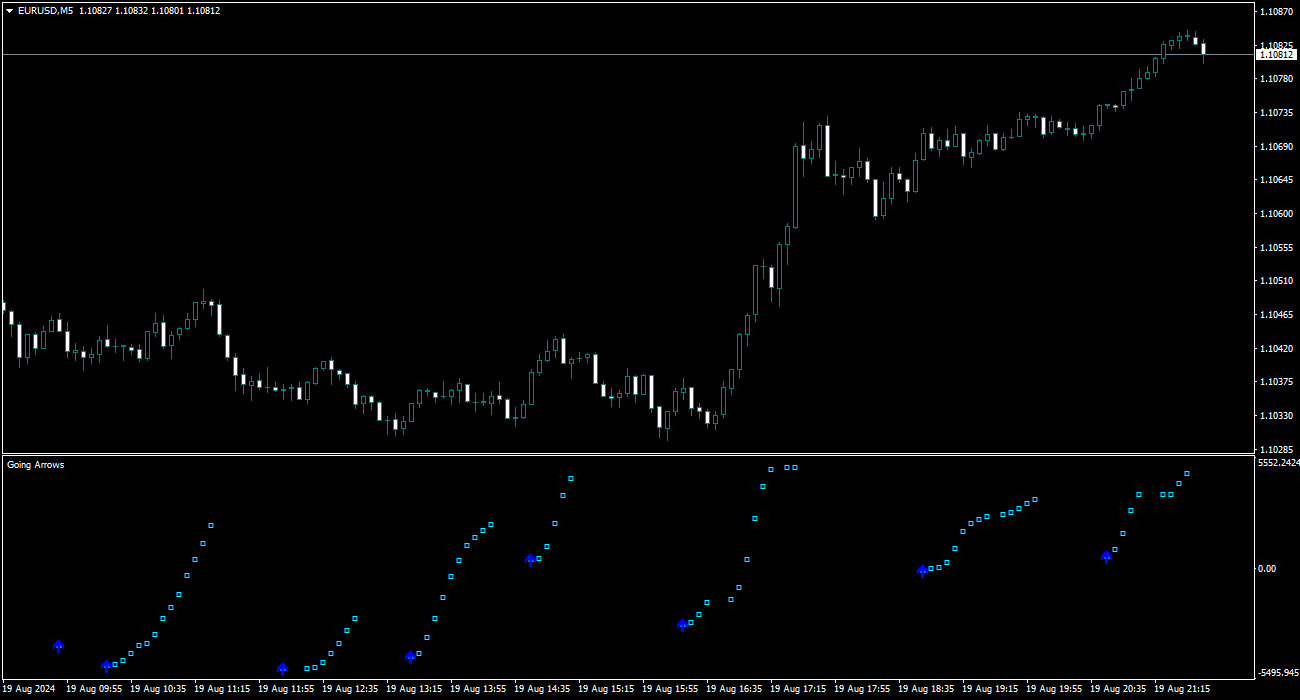
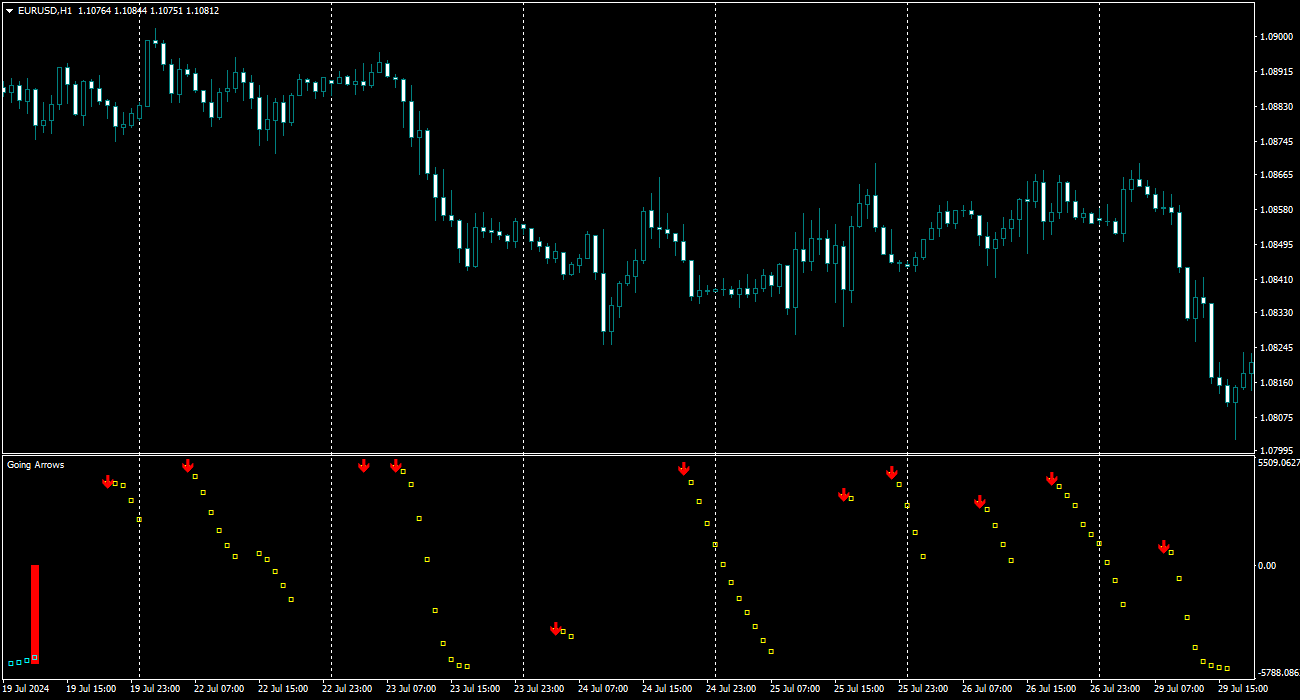
Kullanılması Önerilen Zaman Çerçeveleri M5, M15, M30, H1 ve H4'tür.
Birkaç tür uyarı vardır.
Mumun kapanışında tüm sinyaller asla değişmez veya yeniden renklenmez.

Gösterge yukarıdan aşağıya parametrelerle yapılandırılır.
  • Trend Length - Aşağıdaki hesaplamaların işe yaradığı trend uzunluğunu belirtir.
  • Duration of arrows - Volatilite momentumunu hesaplamak için çubuk sayısı (TF arttıkça azalır).
  • Accuracy - Sinyalin başlangıcının doğruluğunu belirler.
  • Smoothing - Gürültüyü gidermek için filtreleme uygular.
Önerilen ürünler
Liquidity Buy Sell Signal Indicator is a no-nonsense, no delay, no repaint indicator ! Liquidity pools together with a trend filter is the most powerful and reliable signal according to me (with the correct parameters depending on the timeframe used) It selects buy/sell entry signals based on liquidity in the market. The time range to scan for liquidity can be set in the parameters. Liquidity is an important aspect in the market, especially for institutional investors, as they need lots of liqu
Trend Scanner looks at the Market watchlist and Checks to see if there are trending cases between three (3) timeframes selected by the user. The analysis can assist in finding pairs to focus on for a particular session where a trader may need to have a bias in terms of direction to place trades for a particular system which requires multiple timeframe filtration of bar momentum. 3 Main indicators are involved: Moving Average, MACD and Heiken Ashi. User is able to select timeframes available on
Doonchian
Andriy Sydoruk
The Doonchian channel consists of two channel displays. Channel lines are determined by a simple and reliable algorithm. The channel is preferably used for trading inside the channel. The indicator does not redraw and does not lag; simple algorithms are the basis of the work. It works on all currency pairs and on all timeframes. As always a warning, we must not forget that the approach must be comprehensive, the indicator signals require additional information to enter the market.
DS Arrow
Dmitriy Sychev
DS Arrow is a simple indicator for buying/selling in MetaTrader 4, This straightforward indicator shows the market entry points. Perfect for both beginners and professionals. Designed for working only with the H1 timeframe, the indicator will not be displayed on other timeframes. Recommended currency pairs: GBP-USD, EUR-USD, USD-CAD, AUD-USD, USD-JPY, NZD-USD. Works with both4-digit and 5-digit quotes. This indicator does not redraw its signals. Features The entry is made when the hourly candl
This indicator shows the levels and signal dots of the Doji pattern. The indicator allows traders to easily determine possible location of a price rebound. Doji is a candlestick with Open and Close price equal, or almost equal. It should also have shadows of approximately the same size on both sides. Doji denotes the balance between buyers and sellers, or the absence of major players, or level testing. This pattern can mean both a reversal and a continuation of the trend. Indicator Parameters
This indicator Master XR indicator.Indicator displays trend movement. Indicator calculates automatically line. Features FiltPer - displays indicator period. deviation - displays indicator deviation. deviation2 - displays indicator deviation. How to understand the status: If (Timeframe M1-H1) FiltPer = 100; If ( Timeframe H4-MN) FiltPer = 5-20; ////////////////////////////////////////////////////////////////////////////////////////////////////////////////////////////////////////////////////// /
Fractal Trend AM
Andriy Matviyevs'kyy
The presented indicator is essentially a separate trading system. The indicator independently determines entry points and points for setting protective stop orders. This product can be useful for both beginners and experienced traders, since it is developed on the basis of solutions proven by time and by professional traders. On fully formed bars the indicator is not redrawn. The indicator has the ability to send notifications to the terminal and email. Technically, the indicator is a system of
FREE
TMoney OrderBLockWeek
Moises Orlando Urbina Sojo
The indicator is activated at the beginning of each week and detects both bullish and bearish ORDERBLOCK potentials. These levels are of high operational probability, being able to use a minimum ratio of 3 to 1 to maximize profits. It is recommended to use pending orders at the OB levels of the chart and place the SL up to a maximum of 20 pips from the entry price. Submit the indicator to Backtesting to become familiar with its performance and complement it with other trend or oscillation typ
Trading Indicator Lab's Volume by Price is a volume-based indicator for MT4 that reveals price levels with the most and least volume for each bar within a given period. How It Works You can think of the indicator as a running volume profile that displays the most voluminous price level and the price level that has the least volume. For each bar, the indicator calculates the volume vertically in the price axis. As this is calculated, the indicator creates 2 signals: (1) a large red dot which repr
Supply and Demand Indicator + FREE Currency Strength Meter ADD-ON Looking for a powerful tool that can help you identify the most reactive zones in the forex market? Our supply and demand indicator for MetaTrader 4 and 5 is exactly what you need. With its advanced algorithms and real-time analysis, this indicator helps traders of all experience levels make informed trading decisions. The supply and demand indicator is a cutting-edge tool that helps traders identify areas where buyers and seller
The Levels indicator has been created to simplify the process of plotting support and resistance levels and zones on selected timeframes. The indicator plots the nearest levels of the selected timeframes, which are highlighted in different colors. It significantly reduces the time needed to plot them on the chart and simplifies the market analysis process. Horizontal support and resistance levels are used to identify price zones where the market movement can slow down or a price reversal is lik
Diamond PRO
Fanur Galamov
4.84 (19)
Diamond PRO is enhanced powerful version of Diamond for advanced traders. Pro version includes optimized cores, new impoved entry points filters, new multistage profit closure algorithm and сontains number of external control parameter that allows build and fine tune own tradind decisions and algorithms. The system provides more accurate market entries, analyzes and filters upcoming economic news, contains spread protection and an advanced position management algorithm. Main goal of Diamond PRO
The indicator allows you to trade binary options. The recommended time frame is М1 and the expiration time is 1 minutes. The indicator suitable for auto and manual trading. A possible signal is specified as a arrows above/under a candle. You should wait until the candle closes! Arrows are not re-painted Trade sessions: London and New York section Currency pairs: AUD/CAD Working time frame: M1 Expiration time: 1 minute The indicator also shows good results when using the martingale strategy - "Ma
FREE
Bu göstergenin amacı, tüm zaman dilimlerinde Murray seviyelerini bulmak ve bunları güçlü Murray seviyelerine (+2, +1, 8, 4, 0, -1, -2) dayalı sinyal seviyelerini içeren birleşik seviyeler halinde birleştirmektir. Zaman dilimi ne kadar küçük olursa, birleşik seviyeyi hemen görme şansınız o kadar artar. Renkli olarak vurgulanacaktır. İmleci herhangi bir sayının üzerine getirirseniz, seviyenin hangi zaman dilimine ait olduğuna dair bir araç ipucu görünecektir. Ancak her zaman en solda geçerli zaman
KT Horizontal Lines MT4
KEENBASE SOFTWARE SOLUTIONS
In MetaTrader, plotting multiple   horizontal lines   and then tracking their respective price levels can be a hassle. This indicator automatically plots multiple horizontal lines at equal intervals for setting price alerts, plotting support and resistance levels, and other manual purposes. This indicator is suitable for Forex traders who are new and looking for chances to make quick profits from buying and selling. Horizontal lines can help traders find possible areas to start trading when the
CycleIdentifier
Amyr Shryf Mhmd Salh
The Cycle Identifier MT4 indicator is a great choice of custom indicator for both short-term and long-term traders. The Cycle Identifier MT4 generates filtered price action signals to assist traders to identify when the conditions are right to open buy and sell positions. How it works The Cycle Identifier MT4 indicator displays on a separate indicator chart below the main chart where it draws an oscillating gray line. This gray line is characterized by upward and downward spikes that are accompa
/// Hell Dog Pro /// This Expert Working 5 day a week 12 month of years                                                      Live     unique strategy where it continuously splits a single trade into seven smaller trades. This means that each time the EA executes a trade, it automatically divides it into seven smaller positions. Hell Dog Pro   stands out from other expert advisors due to its remarkable approach to handling losing trades. Unlike traditional methods that solely rely on Stop
Please follow the "How To Trade" instructions exactly for best results Wycoff theory is vastly used by institutional traders but when it comes to retail traders the concept isn't well understood by most. It is even more difficult to implement in intraday & swing trading. This No REPAINT indicator helps you in analyzing the market cycles and plots buy/sell signals at the start of trending phase. It studies the market strength of bulls and bears and does a effort Vs reward matrix calculation befor
Volatility Trend System - girişler için sinyaller veren bir ticaret sistemi. Oynaklık sistemi, trend yönünde doğrusal ve noktasal sinyaller ve ayrıca yeniden çizme ve gecikme olmaksızın trendden çıkmak için sinyaller verir. Trend göstergesi, orta vadeli trendin yönünü izler, yönünü ve değişimini gösterir. Sinyal göstergesi volatilitedeki değişikliklere dayalıdır ve piyasa girişlerini gösterir. Gösterge, çeşitli uyarı türleri ile donatılmıştır. Çeşitli alım satım araçlarına ve zaman dilimler
TrendWave Oscillator is an advanced MT4 oscillator that not only identifies the trend direction but also provides visual and audio alerts to enhance trading strategies. Key Features: - Color-coded trend indication:   - Blue : Indicates an uptrend, signaling potential price growth.   - Orange : Indicates a downtrend, suggesting possible price decline.   - Gray : Represents a flat market or lack of clear entry signals. - Graphical signals on the chart :   - Aqua : Highlights an uptrend, empha
Chart Analyzer
Innovicient Limited
The Chart Analyzer is an MT4 indicator that provides visual arrow signals without redrawing them. In addition, we have included trendlines to validate your entries. This indicator has been fine-tuned to work with all timeframes and instruments.  The Chart Analyzer has a number of advantages Does not fade or remove arrows when drawn Sends both email and phone alerts. It is light on computer resources Easy to install. Default setting works just fine.  If price opens above the trendline, open
Ska ZigZag BuySell
NKATEKO VUKOSI LEROY MASANGO
Ska ZigZag BuySell indicator determines the overbought and oversold regions within a trend. The indicator determines the overbought region by the candlestick high and the oversold region by the candlestick low. This indicator only gives signals with arrow and audible alerts each and every time when a new candlestick appear. To utilize the full strategy i recommend using "Ska ZigZag BuySell" together with "Ska ZigZag Line". The Ska ZigZag Line indicator is available for free. NOTE: Indicator is h
This indicator draws Horizontal Support and Resistance automatically. It works with any symbol and any timeframe. Stronger Support Lines are displayed in thicker green horizontal lines. In the same way, Stronger Resistance lines are displayed with thicker red lines. Change the timeframe to display the Support and Resistance Lines of various timeframes.
PDP indicator is used for: defining price probability distributions. This allows for a detailed representation of the channel and its borders and forecast the probability of a price appearing at each segment of its fluctuations; defining the channel change moment. Operation principles and features PDP analyzes a quote history on lower timeframes and calculates a price probability distribution on higher ones. Forecast algorithms allow the indicator to calculate probability distributions and m
In the world of trading, one of the main concerns is finding a reliable trading system. Meet the TrendEdge Channel indicator - your reliable companion in this search. Developed based on complex mathematical calculations, this indicator predicts the most likely short-term price movements. TrendEdge Channel is designed specifically to identify trends in price movements. Thanks to it, you can quickly determine not only the direction of the trend, but also the levels of interaction between buyers
LR Candles AM
Andriy Matviyevs'kyy
This indicator displays candle prices on the chart, colored according to the data of a linear regression of various prices (at the user's choice) for a selected period of time. The user has the option to select two different price types and two different time periods. The indicator will display the moments of coincidence of the directions of the linear regression. Usage: After the full formation of a candle colored in the opposite color to the previous candle, place a stop order at the high /
FREE
Candle EA MT4
Mansour Babasafary
4.43 (49)
This expert is based on patterns The main patterns of this specialist are candlestick patterns Detects trends with candlestick patterns It has a profit limit and a loss limit, so it has a low risk The best time frame to use this expert is M30 time frame The best currency pairs to use with this expert is the EURUSD, GBPUSD, AUDUSD, USDCAD currency pairs Attributes: Can be used in the EURUSD, GBPUSD, AUDUSD, USDCAD  currency pairs Can be used in M30, H1, H4 time frames Has profit limit an
Forex Indicator "   Stochastic   for 8 Symbols" for MT4. Stochastic oscillator is one of the best indicators on the market - perfect tool for many traders. OverBought zone - above 80; OverSold one - below 20 It is great to take   Sell   entries from   above 80 zone   and  Buy   entries from   below 20 "S tochastic   for 8 Symbols" gives opportunity to control  S tochastic  values of up to   8 different symbols just on 1 chart This indicator is excellent to combine   with Price Action entries a
VisualTics
Dariusz Grywaczewski
A real rarity for scalpers. Are you looking for TFs lower than M1 ? Do you want to see the price dynamics inside the candle? This is a tool for you. Visual Ticks is an indicator that shows the tick chart in a separate window. He does it in real time waiting for changing ticks. Thanks to Visual Ticks, we can look inside the traditional candle and see the dynamics of the moving price. By setting "period_of_model" we can shape a chart made of candles. "period_of_model" defines how many c
Bu ürünün alıcıları ayrıca şunları da satın alıyor
Gold Stuff
Vasiliy Strukov
4.9 (270)
Gold Stuff, özellikle altın için tasarlanmış bir trend göstergesidir ve herhangi bir finansal enstrümanda da kullanılabilir. Gösterge yeniden çizilmez ve gecikmez. Önerilen zaman dilimi H1. Bu göstergede tam otomatik Uzman Danışman EA Gold Stuff çalışır. Profilimde bulabilirsiniz. Ayarları ve kişisel bir bonusu almak için satın alma işleminden hemen sonra benimle iletişime geçin!  Güçlü Destek ve Trend Tarayıcı göstergemizin ücretsiz bir kopyasını pm'den alabilirsiniz. Ben! AYARLAR Ok Ç
ÜRÜNÜ SATIN ALMADAN ÖNCE LÜTFEN AŞAĞIDAKİ BİLGİLERİ OKUYUNUZ! Apollo Pips PLUS SP benzersiz bir üründür! YENİ "APOLLO PIPS" GÖSTERGEMİ ARTI TÜM İŞLEM GÖSTERGELERİME ERİŞİM İLE "SÜPER PAKET" BONUSUNU ALMAK İSTEYENLER İÇİN! Apollo Pips PLUS SP ürününü satın alarak aslında Apollo Pips göstergemin tamamen yeni bir versiyonunu satın almış oluyorsunuz. Göstergenin bu sürümü, geliştirilmiş bir algoritmaya ve kullanımı kolay bir parametreye sahiptir; bu, size göstergeyi herhangi bir piyasada ve herhangi
Scalper Inside PRO
Alexey Minkov
4.75 (60)
An exclusive indicator that utilizes an innovative algorithm to swiftly and accurately determine the market trend. The indicator automatically calculates opening, closing, and profit levels, providing detailed trading statistics. With these features, you can choose the most appropriate trading instrument for the current market conditions. Additionally, you can easily integrate your own arrow indicators into Scalper Inside Pro to quickly evaluate their statistics and profitability. Scalper Inside
TPSproTREND PrO
Roman Podpora
4.79 (19)
TPSpro TREND PRO,   piyasayı otomatik olarak analiz eden, trend ve değişimlerinin her biri hakkında bilgi sağlayan, ayrıca yeniden çizmeden işlemlere girme sinyalleri veren bir trend göstergesidir! Gösterge her mumu ayrı ayrı analiz ederek kullanır. farklı dürtülere atıfta bulunur - yukarı veya aşağı dürtü. Para birimleri, kripto paralar, metaller, hisse senetleri ve endeksler için işlemlere tam giriş noktaları! Sürüm MT5                   GÖSTERGENİN TAM AÇIKLAMASI       Bunu -   RFI SEVİYELER
Atomic Analyst
Issam Kassas
5 (3)
Öncelikle belirtmek gerekir ki bu Ticaret Göstergesi Yeniden Çizim Yapmaz, Gecikmez ve Gecikme Göstermez, bu da hem manuel hem de robot ticareti için ideal hale getirir. Kullanıcı kılavuzu: ayarlar, girişler ve strateji. Atom Analisti, Piyasada Daha İyi Bir Avantaj Bulmak İçin Fiyatın Gücünü ve Momentumunu Kullanan PA Fiyat Hareketi Göstergesidir. Gürültüleri ve Yanlış Sinyalleri Kaldırmaya ve Ticaret Potansiyelini Artırmaya Yardımcı Olan Gelişmiş Filtrelerle Donatılmıştır. Birden fazla katma
Gold Channel is a volatility-based indicator, developed with a specific timing algorithm for the XAUUSD pair, which consists of finding possible corrections in the market. This indicator shows two outer lines, an inner line (retracement line) and an arrow sign, where the theory of the channel is to help identify overbought and oversold conditions in the market. The market price will generally fall between the boundaries of the channel. If prices touch or move outside the channel it is a tra
Şu anda %20 İNDİRİMLİ! Herhangi bir Acemi veya Uzman Tüccar için En İyi Çözüm! Bu gösterge paneli yazılımı 28 döviz çifti üzerinde çalışıyor. Ana göstergelerimizden 2'sine (Gelişmiş Para Birimi Gücü 28 ve Gelişmiş Para Birimi Dürtüsü) dayanmaktadır. Tüm Forex piyasasına harika bir genel bakış sağlar. Gelişmiş Para Birimi Gücü değerlerini, para birimi hareket hızını ve tüm (9) zaman dilimlerinde 28 Forex çifti için sinyalleri gösterir. Trendleri ve / veya scalping fırsatlarını belirlemek içi
PZ Day Trading
PZ TRADING SLU
3.67 (3)
Effortless trading: non-repainting indicator for accurate price reversals Special Offer: Purchase now to receive free bonuses worth $189! (Read more for details) This indicator detects price reversals in a zig-zag fashion, using only price action analysis and a donchian channel. It has been specifically designed for short-term trading, without repainting or backpainting at all. It is a fantastic tool for shrewd traders aiming to increase the timing of their operations. [ Installation Guide | Up
NAM Order Blocks
NAM TECH GROUP, CORP.
5 (1)
MT4 Multi-timeframe Order Blocks detection indicator. Features - Fully customizable on chart control panel, provides complete interaction. - Hide and show control panel wherever you want. - Detect OBs on multiple timeframes. - Select OBs quantity to display. - Different OBs user interface. - Different filters on OBs. - OB proximity alert. - ADR High and Low lines. - Notification service (Screen alerts | Push notifications). Summary Order block is a market behavior that indicates order collection
Enigmera
Ivan Stefanov
5 (4)
ENIGMERA: Pazarın çekirdeği https://www.enigmera.com Giriş Bu gösterge ve ticaret sistemi, finansal piyasalar için dikkate değer bir yaklaşımdır. ENIGMERA, destek ve direnç seviyelerini doğru bir şekilde hesaplamak için fraktal döngüleri kullanır. Gerçek birikim aşamasını gösterir ve yön ve hedefler verir.  İster bir trendde ister bir düzeltmede olalım çalışan bir sistem.  Nasıl çalışır? ENIGMERA üç çizgiden oluşur: destek/direnç çizgisi, hedef çizgisi ve sapma çizgisi. Sistem, geçmiş veril
PZ Trend Trading
PZ TRADING SLU
4.8 (5)
Capture every opportunity: your go-to indicator for profitable trend trading Special Offer: Purchase now to receive free bonuses worth $159! (Read more for details) Trend Trading is an indicator designed to profit as much as possible from trends taking place in the market, by timing pullbacks and breakouts. It finds trading opportunities by analyzing what the price is doing during established trends. [ Installation Guide | Update Guide | Troubleshooting | FAQ | All Products ] Trade financial
TPSpro RFI Levels
Roman Podpora
4.83 (24)
Reversal First Impulse levels (RFI)    INSTRUCTIONS        RUS       -       ENG              R ecommended to use with an indicator   -   TPSpro  TREND PRO -  Version MT5 A key element in trading is zones or levels from which decisions to buy or sell a trading instrument are made. Despite attempts by major players to conceal their presence in the market, they inevitably leave traces. Our task was to learn how to identify these traces and interpret them correctly. Main functions: Displaying activ
Order Block Hunter
Noha Mohamed Fathy Younes Badr
5 (2)
Order block hunter indicator is the best indicator for  hunt the order blocks that area where there has been a large concentration of limit orders waiting to be executed Order blocks are identified on a chart by observing previous price action and looking for areas where the price experienced significant movement or sudden changes in direction .This indicator does that for you by using very complicated codes and helps you to take the best areas To buy and sell because it make marks at the best a
Connect Indicator
Sukunthakan Ngernbamrung
Connect Indicator is a tool used for connecting indicators between the MQL market and MT4. The connected indicators are made by our group and can be used for other applications, such as sending messages to the Line application or Telegram application. If you have any questions, please don't hesitate to ask us to receive support. Function and indicator buffer Buffer one is the high price of the previous candle. Buffer two is the high price of the previous candle. Usage To connect indicators to fu
Entry Points Pro
Yury Orlov
4.7 (226)
Yeniden boyamadan bir ticarete girmek için doğru sinyaller sağlayan MT5 için en iyi gösterge! Herhangi bir finansal varlığa uygulanabilir: forex, kripto para birimleri, metaller, hisse senetleri, endeksler. MT5 versiyonu burada Oldukça doğru alım satım sinyalleri sağlayacak ve bir alım satımı açıp kapatmanın en iyi zamanını size söyleyecektir. Göstergeyi ödeyen yalnızca bir sinyali işleme örneğiyle videoyu (6:22) izleyin! Çoğu tüccar, Giriş Noktaları Pro göstergesinin yardımıyla ilk işl
TPA True Price Action indicator reveals the true price action of the market makers through 100% non-repainting signals (except early signals mode) strictly at the close of a candle! TPA shows entries and re-entries, every time the bulls are definitely stronger than the bears and vice versa. Not to confuse with red/green candles. The shift of power gets confirmed at the earliest stage and is ONE exit strategy of several. There are available now two free parts of the TPA User Guide for our custo
Currency Strength Exotics
Bernhard Schweigert
4.88 (33)
ŞU ANDA %20 INDIRIMLI! Herhangi bir Acemi veya Uzman Tüccar için En İyi Çözüm! Bu Gösterge, Egzotik Çiftler Emtialar, Endeksler veya Vadeli İşlemler gibi herhangi bir sembol için para birimi gücünü göstermek için uzmanlaşmıştır. Türünün ilk örneğidir, Altın, Gümüş, Petrol, DAX, US30, MXN, TRY, CNH vb. gerçek para birimi gücünü göstermek için 9. satıra herhangi bir sembol eklenebilir. Bu benzersiz, yüksek kaliteli ve uygun fiyatlı bir ticaret aracıdır çünkü bir dizi tescilli özelliği ve yeni
Gösterge en uygun giriş ve çıkış noktalarını gösterir. Ayrıca, ticaretin daha iyi analiz edilmesi için tüm sinyaller hakkında istatistiksel veriler görüntüler. Bu göstergenin yardımıyla piyasayı daha iyi anlayabileceksiniz. Trendin gücü zayıflamaya başlar başlamaz (bu panelde gösterilecektir), trend çizgisi yatay konuma gelecektir - bu ticaretten çıkma sinyalidir. Ya da ortalama/medyan kâr seviyesine ulaşıldığında çıkabilirsiniz. Gösterge, 2010'dan beri edindiğim ticaret deneyimimin sonuc
RelicusRoad Pro
Relicus LLC
4.73 (141)
Şimdi 147 $ (birkaç güncellemeden sonra 499 $ 'a yükseliyor) - Sınırsız Hesaplar (PC'ler veya Mac'ler) RelicusRoad Kullanım Kılavuzu + Eğitim Videoları + Özel Discord Grubuna Erişim + VIP Durumu PİYASAYA BAKMAK İÇİN YENİ BİR YOL RelicusRoad, forex, vadeli işlemler, kripto para birimleri, hisse senetleri ve endeksler için dünyanın en güçlü ticaret göstergesidir ve yatırımcılara kârlı kalmaları için ihtiyaç duydukları tüm bilgileri ve araçları sağlar. Başlangıç ​​seviyesinden ileri seviyey
Tanıtım       Kuantum Trend Keskin Nişancı Göstergesi   , trend tersine dönmeleri belirleme ve ticaret yapma şeklinizi değiştiren çığır açan MQL5 Göstergesi! 13 yılı aşkın ticaret tecrübesine sahip deneyimli tüccarlardan oluşan bir ekip tarafından geliştirilmiştir.       Kuantum Trend Keskin Nişancı Göstergesi       trend dönüşlerini son derece yüksek doğrulukla belirlemenin yenilikçi yolu ile ticaret yolculuğunuzu yeni zirvelere taşımak için tasarlanmıştır. ***Kuantum Trend Keskin Nişancı Gö
FX Volume
Daniel Stein
4.61 (36)
Sabah Brifingimiz aracılığıyla ayrıntılar ve ekran görüntüleri ile günlük piyasa güncellemenizi alın burada mql5 ve on Telegram ! FX Volume, bir brokerin bakış açısından piyasa duyarlılığı hakkında GERÇEK bir fikir veren İLK ve TEK hacim göstergesidir. COT raporlarından çok daha hızlı bir şekilde, brokerlar gibi kurumsal piyasa katılımcılarının Forex piyasasında nasıl konumlandıklarına dair harika bilgiler sağlar. Bu bilgileri doğrudan grafiğinizde görmek, ticaretiniz için gerçek oyun değiştir
XQ Indicator MetaTrader 4
Marzena Maria Szmit
3.67 (3)
Step into the realm of Forex trading with confidence and precision using XQ, a cutting-edge Forex indicator designed to elevate your trading game to unprecedented heights. Whether you're a seasoned trader or just stepping into the world of currency exchange,   XQ Forex Indicator   empowers you with the insights and signals needed to make informed trading decisions. The signal conditions are a combination of three indicators, and XQ Forex Indicator only display  medium and long-term trends . The
Gann Time Clusters
Martin Eshleman
2.5 (2)
Gann Time Clusters Indicator This indicator is based on W. D. Gann's Square of 9 method for the time axis. It uses past market reversal points and applies the mathematical formula for Gann's Square of 9 and then makes projections into the future. A date/time where future projections line up is called a 'time cluster'. These time clusters are drawn as vertical lines on the right side of the chart where the market has not advanced to yet. A time cluster will result in a market reversal point (ex.
Ultimate Sniper Dashboard
Hispraise Chinedum Abraham
4.85 (27)
İndirimli fiyatı 299$! Fiyatlar gelecekte artabilir! Aşağıdaki açıklamayı okuyun! Ultimate Sniper Dashboard için En İyi Giriş Sistemi: NIHAI DINAMIK SEVIYELER. (Lütfen Ürünlerimi Kontrol Edin) Ultimate Sniper Dashboard, MT4 çoklu para birimi test limitleri nedeniyle SADECE canlı piyasalarda çalışır. Ultimate-Sniper Dashboard ile tanışın! Hem HA-Sniper hem de MA-Sniper içeren en iyimiz. ve birçok özel mod. Ultimate Sniper Dashboard mutlak bir canavar! Herhangi bir Acemi veya Uzman Tüccar
Indicator : RealValueIndicator Description : RealValueIndicator is a powerful tool designed specifically for trading on the EURUSD pair. This indicator analyzes all EUR and USD pairs, calculates their real currency strength values, and displays them as a single realistic value to give you a head start on price. This indicator will tell you moves before they happen if you use it right. RealValueIndicator allows you to get a quick and accurate overview of the EURUSD currency pair tops and bottoms,
Gioteen Volatility Index (GVI)   - your ultimate solution to overcoming market unpredictability and maximizing trading opportunities. This revolutionary indicator helps you in lowering your losing trades due to choppy market movements. The GVI is designed to measure market volatility, providing you with valuable insights to identify the most favorable trading prospects. Its intuitive interface consists of a dynamic red line representing the volatility index, accompanied by blue line that indicat
GOLD Impulse with Alert
Bernhard Schweigert
4.56 (9)
Bu gösterge, 2 ürünümüz Advanced Currency IMPULSE with ALERT  +   Currency Strength Exotics  'in süper bir kombinasyonudur. Tüm zaman dilimleri için çalışır ve 8 ana para birimi artı bir Sembol için grafiksel olarak güç veya zayıflık dürtüsünü gösterir! Bu Gösterge, Altın, Egzotik Çiftler, Emtialar, Endeksler veya Vadeli İşlemler gibi herhangi bir sembol için para birimi gücü ivmesini göstermek için uzmanlaşmıştır. Türünün ilk örneğidir, Altın, Gümüş, Petrol, DAX, US30, MXN, TRY, CNH vb.
Cycle Sniper
Elmira Memish
4.41 (39)
NEW YEAR SALE PRICE FOR LIMITED TIME!!! Please contact us after your purchase and we will send you the complimentary indicators to complete the system Cycle Sniper is not a holy grail but when you use it in a system which is explained in the videos, you will feel the difference. If you are not willing to focus on the charts designed with Cycle Sniper and other free tools we provide, we recommend not buying this indicator. We recommend watching the videos about the indiactor and system before pu
Best Currency Strength Indicator
Tumelo Patrick Rakotsoane
4.6 (48)
Advanced Currency Strength Indicator The Advanced Divergence Currency Strength Indicator. Not only it breaks down all 28 forex currency pairs and calculates the strength of individual currencies across all timeframes , but, You'll be analyzing the WHOLE forex market in 1 window (In just 1 minute) . This indicator is very powerful because it reveals the true movements of the market.  It is highly recommended to  analyze charts knowing the performance of individual currencies or the countries ec
How to use Pair Trading Station Pair Trading Station is recommended for H1 time frame and you can use it for any currency pairs. To generate buy and sell signal, follow few steps below to apply Pair Trading Station to your MetaTrader terminal. When you load Pair Trading Station on your chart, Pair Trading station will assess available historical data in your MetaTrader platforms for each currency pair. On your chart, the amount of historical data available will be displayed for each currency pai
Yazarın diğer ürünleri
Volatility Trend System , girişler için sinyaller sağlayan bir ticaret sistemidir. Volatilite sistemi, trend yönünde doğrusal ve nokta sinyallerinin yanı sıra, yeniden çizme veya gecikme olmadan trendden çıkış sinyallerini de verir. Trend göstergesi orta vadeli trendin yönünü izler, yönünü ve değişimini gösterir. Sinyal göstergesi oynaklıktaki değişikliklere dayanır ve piyasaya girişleri gösterir. Gösterge çeşitli uyarı türleri ile donatılmıştır. Çeşitli ticaret araçlarına ve zaman diliml
Volatility Trend System - girişler için sinyaller veren bir ticaret sistemi. Oynaklık sistemi, trend yönünde doğrusal ve noktasal sinyaller ve ayrıca yeniden çizme ve gecikme olmaksızın trendden çıkmak için sinyaller verir. Trend göstergesi, orta vadeli trendin yönünü izler, yönünü ve değişimini gösterir. Sinyal göstergesi volatilitedeki değişikliklere dayalıdır ve piyasa girişlerini gösterir. Gösterge, çeşitli uyarı türleri ile donatılmıştır. Çeşitli alım satım araçlarına ve zaman dilimler
" ZigZag on Trend " göstergesi, fiyat hareketinin yönünü belirlemenin yanı sıra bir çubuk ve pip hesaplayıcıdır. Zikzak şeklinde sunulan bir trend çizgisi ile fiyatın yönünü izleyen bir trend göstergesi ve trend yönünde geçen çubuk sayısını ve dikey ölçekteki nokta sayısını hesaplayan bir sayaçtan oluşur. (Hesaplamalar çubuğun açılmasıyla yapılır) Gösterge yeniden çizilmez. Kolaylık sağlamak için renkli çubuklar veya çizgiler şeklinde tasarlanmıştır. Tüm TF'lerde kullanılabilir, ancak en iyisi M
Dönüm noktalarını tanıyan bir dizi gösterge. İki MA'dan çıkarıldıktan sonra mum çubuğu kombinasyonlarının üst ve alt seviyelerini tespit eder. Erken girişlerin kullanıldığı ticaret sistemleri için geçerlidir. Ölçeklendirme ve gün içi ticaret için trend boyunca kullanılabilir ve erken aşamalarda trendin tersine döndüğünü tespit etmek için kullanılabilir. Olasılıklar Parametreler, herhangi bir zaman dilimi ve ticaret aracı için esnek ayarlar sağlar. Sinyaller için çeşitli uyarı türleri vard
Candle Binary Scalper , forex ve ikili opsiyonlar için teknik analiz ürünüdür. Bir ticaret sisteminde birleştirilmiş birkaç teknik gösterge içerir. Ölçeklendirme ve ikili opsiyonlar için bir trend içinde manuel ticaret için uygundur. Tüm zaman dilimlerinde ve ticaret enstrümanlarında çalışır. Yüksek volatilite durumunda M15, M30, H1 ve H4, M5 ve M1 ticareti için Önerilen Zaman Çerçeveleri kullanılmalıdır. Birkaç uyarı türü vardır. ürün nasıl kullanılır Her Zaman Çerçevesi için en uygun ay
Forex için manuel ticaret ve teknik analiz göstergesi. İşlem gününün açılış seviyesini gösteren bir trend göstergesi ve giriş noktalarını belirlemek için bir ok göstergesinden oluşur. Gösterge yeniden renklenmez; mum kapandığında çalışır. Sinyal okları için çeşitli uyarı türleri içerir. Herhangi bir grafikte, alım satım aracında veya zaman diliminde çalışacak şekilde yapılandırılabilir. Çalışma stratejisi trend boyunca fiyat hareketlerini aramaya dayanmaktadır.  " Buy " işlemleri ya
Scalping and Binary Signal Detector - Trend boyunca pozisyon açmak için yön sinyalleri veren Scalping göstergesi. Gösterge, Forex ve ikili opsiyonlar için kullanılabilecek eksiksiz bir ticaret sistemidir. Algoritma sistemi, birbirini takip eden birkaç çubuktaki yoğun fiyat hareketlerini tanımanıza olanak tanır. Gösterge, oklar için çeşitli uyarı türleri sağlar. Tüm alım satım enstrümanları ve zaman dilimleri üzerinde çalışır (M5 veya Üzeri önerilir). Ticaret için nasıl kullanılır Sarı b
Wave Reversal Indicator - determines the direction of trend waves and price reversals. The indicator shows wave movements and trend directions. It gives recommendations where to follow the trader, helps to follow the trading strategy. It is an addition to an intraday or medium-term strategy. Almost all parameters are selected for each time frame and are changed automatically, the only parameter for manual adjustment is the wavelength. Works on various trading instruments and timeframes, rec
FREE
Dönüm noktalarını tanıyan bir dizi gösterge. İki MA'dan çıkarıldıktan sonra mum çubuğu kombinasyonlarının üst ve alt seviyelerini tespit eder. Erken girişlerin kullanıldığı ticaret sistemleri için geçerlidir. Ölçeklendirme ve gün içi ticaret için trend boyunca kullanılabilir ve erken aşamalarda trendin tersine döndüğünü tespit etmek için kullanılabilir. Olasılıklar Parametreler, herhangi bir zaman dilimi ve ticaret aracı için esnek ayarlar sağlar. Sinyaller için çeşitli uyarı türleri vard
BB Reversal Arrows Teknik Ticaret Sistemi, perakende kararları almak için ters noktaları tahmin etmek için geliştirilmiştir. Mevcut pazar durumu gösterge ile analiz edilir ve çeşitli kriterler için yapılandırılır: ters anlar beklentisi, potansiyel dönüm noktaları, satın alma ve satış sinyalleri. Gösterge fazla bilgi içermez, tüccarların makul kararlar vermesine izin veren görsel anlaşılabilir bir arayüze sahiptir. Tüm oklar mumu kapatıyor gibi görünüyor, yeniden çizim yapmadan, birkaç uyarı
Ticaret ve piyasa yönünü tahmin etmek için döngüsel gösterge. Fiyatın döngüsel davranışını osilatör biçiminde gösterir. Osilatörün üst ve alt sınırlarından bir geri dönüş olduğunda, işlem açılmasına yönelik sinyaller verir. Histogram biçiminde trendin yumuşatılmış gücünü gösterir.  Ölçeklendirmeden gün içi işlemlere kadar her türlü ticaret stratejisini tamamlayacak.  Gösterge yeniden çizilmez.  Tüm sembollerde/aletlerde kullanıma uygundur.  Kısa vadeli işlemler için uygun zaman dilimleri M5,
Scalping Entry Points - fiyat hareketlerine uyum sağlayabilen ve yeniden çizmeden alım satımları açmak için sinyaller verebilen manuel bir alım satım sistemidir. Gösterge, merkezi destek ve direnç seviyesine göre trendin yönünü belirler. Nokta göstergesi, girişler ve çıkışlar için sinyaller sağlar. Manuel gün içi ticaret, ölçeklendirme ve ikili opsiyonlar için uygundur. Tüm zaman dilimlerinde ve ticaret enstrümanlarında çalışır. Gösterge birkaç türde uyarı verir. ürün nasıl kullanılır Mavi
Candle Power Signals , ticaret kararları vermek için potansiyel değişken sinyalleri arama stratejisini kullanan bir trend göstergesidir. Gösterge, piyasayı analiz ederek, yönlü trend hareketi içinde artan ve azalan volatilite bölgelerini tanımlar. Ana sinyal oluşturma parametreleri halihazırda yapılandırılmıştır; geri kalan ayarlar ve periyotlar, manuel yapılandırma için 2 parametreye endekslenmiştir: 1. "Candle calculation method" - 2 sinyal oluşturma modu, zaman dilimlerinde normal olanın
Level Breakout Indicato r , üst ve alt sınırlardan çalışan, trendin yönünü belirleyebilen bir teknik analiz ürünüdür. Yeniden çizim veya gecikme olmadan mum 0 üzerinde çalışır. Çalışmasında, parametreleri önceden yapılandırılmış ve dönemlerin derecelendirmesini gerçekleştiren tek bir parametre olan " Scale " halinde birleştirilmiş farklı göstergelerden oluşan bir sistem kullanır. Göstergenin kullanımı kolaydır, herhangi bir hesaplama gerektirmez; tek bir parametre kullanarak, seçilen zaman dil
Max Min Reversal Arrows MT5 - an arrow reversal indicator for predicting price movement. The indicator is built on the support and resistance levels at the local lows and highs of the price. Product features Arrows appear on the current candle. The indicator does not redraw. Can be used on all time frames and trading instruments. Recommended timeframes to use M30, H1, H4. The dotted lines are the support and resistance levels within the signal. Price movement from these levels means a reve
Fiyat kanalının göstergesi ve içindeki kesme noktası oluşturucu. Kullanım süresine göre fiyatın konumu hakkında fikir verir. Giriş ve çıkış anlarını belirleyen kanal sınırları ve sıçrama noktaları boyunca oluşturulmuş düzleştirilmiş trend sıçrama çizgileri içerir. Çeşitli ticaret enstrümanları ve zaman dilimleri üzerinde çalışır. gösterge ile nasıl çalışılır Kanal kesme çizgisini takip edin, mavi çizgi yukarı girişler, pembe çizgi aşağı girişler. Giriş noktaları mevcut mum üzerinde oluşt
A trend indicator showing the strength of bulls and bears in a trading range. Consists of two lines: The green line is a balanced overbought/oversold condition. The red line is the direction of trading activity. Does not redraw calculations. Can be used on all Symbols/Instruments/Time Frames. Easy to use and set up. How to use the indicator and what it determines. The basic rule is to follow the direction of the red line: if it crosses the green line from the bottom up, the market i
FREE
Smoothed oscillator based on basic DeMarker indicators. Shows the volatility of the price direction. Can be used to determine intraday entry and exit points from the market. Suitable for use on all time frames and trading instruments. It is recommended to use on M5, M15 and M30. The green line shows the price direction up, the blue line shows the price direction down. The red line is a smoothed representation of the price. Input parameters      Period - Period of the main indicator DeMarker
FREE
Zig-Zag indicator with additional signals for inputs. Visually easy to use: The red zig-zag line is an uptrend. The blue zig-zag line is a downward trend. Arrows in the form of additional signals. Works on any trading pairs. On any timeframe. Not redrawn. Input parameters Zig-Zag Period - Zig-zag period (from 5) Signal Period - period of signal arrows (from 3) Alerts for signals Play sound - Sound alert Display pop-up message - Notification by message on the screen Send push not
FREE
Lines Channel Pro
Vitalyi Belyh
5 (1)
The "Lines Channel Pro" indicator determines price reversals from the High/Low channel. Contains a built-in trend finder, signal lines, entry and exit points. The recommended timeframe for M15 to work is D1. For each timeframe and trading instrument, depending on the volatility, it is necessary to select individual settings. Does not redraw calculations. Input parameters Use Channel trend filter - Turn on/off the trend filter Channel trend period - Trend filter period (from 8 and abov
Arrow indicator with trend filter. Generates trend input without delays or delays - on the emerging candle. Suitable for use on any trading tools and timeframes. Easy to use, contains the direction of the trend in the form of a histogram lines and signal generator. Input parameters Period Trend Line - Period of the Histogram Line Signal Generator Period - If the period is longer, then the arrows are less Play sound Display pop-up message Send push notification Send email Sound file signal -
An indicator that determines the point levels of price resistance. The arrows indicate price bounces in the indicated directions. Arrows are not redrawn formed on the current candle, shown on the previous candle for convenience.      It has one setting - the formation intensity: If the parameter is smaller, most of the signals are formed in a wide trend. If the parameter is larger, signals are formed in a narrower trend. Input parameters Formation Intensity - Arrow Formation Intensity Num
Channel Cluster
Vitalyi Belyh
5 (2)
Cluster indicator working in the price channel. For operation, the indicator builds a channel line - (dashed line). Inside the channel, cluster sections are determined that determine the direction of the price movement - (histograms in two directions), start with large arrows. Small arrows are plotted above / below each histogram - indicator increase volatility. The indicator does not redraw the values. Works on any tools and timeframes. Entrances are made when large arrows appear, inside s
A technical indicator that calculates its readings based on trading volumes. It has an oscillatory line that follows the change in volumes. Large arrows on the line indicate reversal values. A channel is built around the line with small arrows showing the strengthening of price movement in the direction of increasing volumes. The indicator does not redraw values. Works on any instrument and timeframe. It can complement any trading strategy by finding a trend or make entries in the direction of
Max Min Reversal Arrows - an arrow reversal indicator for predicting price movement. The indicator is built on the support and resistance levels at the local lows and highs of the price. Product features Arrows appear on the current candle. The indicator does not redraw. Can be used on all time frames and trading instruments. Recommended timeframes to use M30, H1, H4. The dotted lines are the support and resistance levels within the signal. Price movement from these levels means a reversal.
Scalping Entry Points - fiyat hareketlerine uyum sağlayabilen ve yeniden çizmeden alım satımları açmak için sinyaller verebilen manuel bir alım satım sistemidir. Gösterge, merkezi destek ve direnç seviyesine göre trendin yönünü belirler. Nokta göstergesi, girişler ve çıkışlar için sinyaller sağlar. Manuel gün içi ticaret, ölçeklendirme ve ikili opsiyonlar için uygundur. Tüm zaman dilimlerinde ve ticaret enstrümanlarında çalışır. Gösterge birkaç türde uyarı verir. ürün nasıl kullanılır Mavi
Binary Lines , para birimleri, emtialar, kripto para birimleri, hisse senetleri, endeksler ve herhangi bir finansal araç için teknik bir analiz göstergesidir. İkili opsiyonlar veya Forex ölçeklendirme için kullanılabilir. Giriş ve çıkış noktalarını sabit aralıklarla gösterir ve tüccarlar olası işlemlerin sonuçları hakkında gerekli bilgileri. Giriş noktaları, mumun en başında, MA çizgisi yönünde, süre boyunca oluşturulur. çubuklardaki işlemler manuel olarak ayarlanabilir ve herhangi bir finansal
İşlem hacimlerine ilişkin okumaları hesaplayan teknik bir gösterge. Histogram biçiminde, ticaret enstrümanının hareket gücünün birikimini gösterir. Yükseliş ve düşüş yönleri için bağımsız hesaplama sistemlerine sahiptir. Herhangi bir ticaret enstrümanı ve zaman dilimi üzerinde çalışır. Herhangi bir ticaret sistemini tamamlayabilir. Gösterge değerlerini yeniden çizmez, sinyaller mevcut mum üzerinde görünür. Kullanımı kolaydır ve grafiği yüklemez, ek parametre hesaplamaları gerektirmez. Değiştir
Line Breakouts - Trend ticareti için sistem. Dönem ve düzeltme işlevi kullanılarak herhangi bir grafiğe ve ticaret aracına uyarlanabilecek bir trend tanımlayıcı içerir. Ve destek ve direnç seviyelerinin belirleyicisi. Fiyat direnç çizgisinin altında olduğunda Satış işlemlerini açın ve fiyat destek çizgisinin üzerinde olduğunda Alım işlemlerini açın. Zararı durdur çizgilerden birkaç noktaya yerleştirilmelidir, Kâr Al zaman dilimine göre birkaç mumdan (3-10-15) sonra sabitlenmelidir. Gösterge y
Point Trend Indicator - Trendin yönünü belirleyebilen ve güçlendiğini gösterebilen, trendin üst ve alt seviyelerinin göstergesi. Trend yönü yuvarlak noktalarla belirlenir; noktalar sıfır çizgisinin üzerindeyse trend yükseliş, altındaysa trend düşüş yönündedir. Yön hareketindeki artış oklarla gösterilmiştir. Manuel ayarlama için tek parametreye sahiptir - Trend yönünün süresi.   Olasılıklar Tüm zaman dilimlerinde çalışır Her türlü finansal araca uyum sağlar (Forex, Hisse Senetleri, Metaller,
Filtrele:
İnceleme yok
İncelemeye yanıt