• Genel bakış
  • İncelemeler
  • Yorumlar

Bank Moving Average MT4

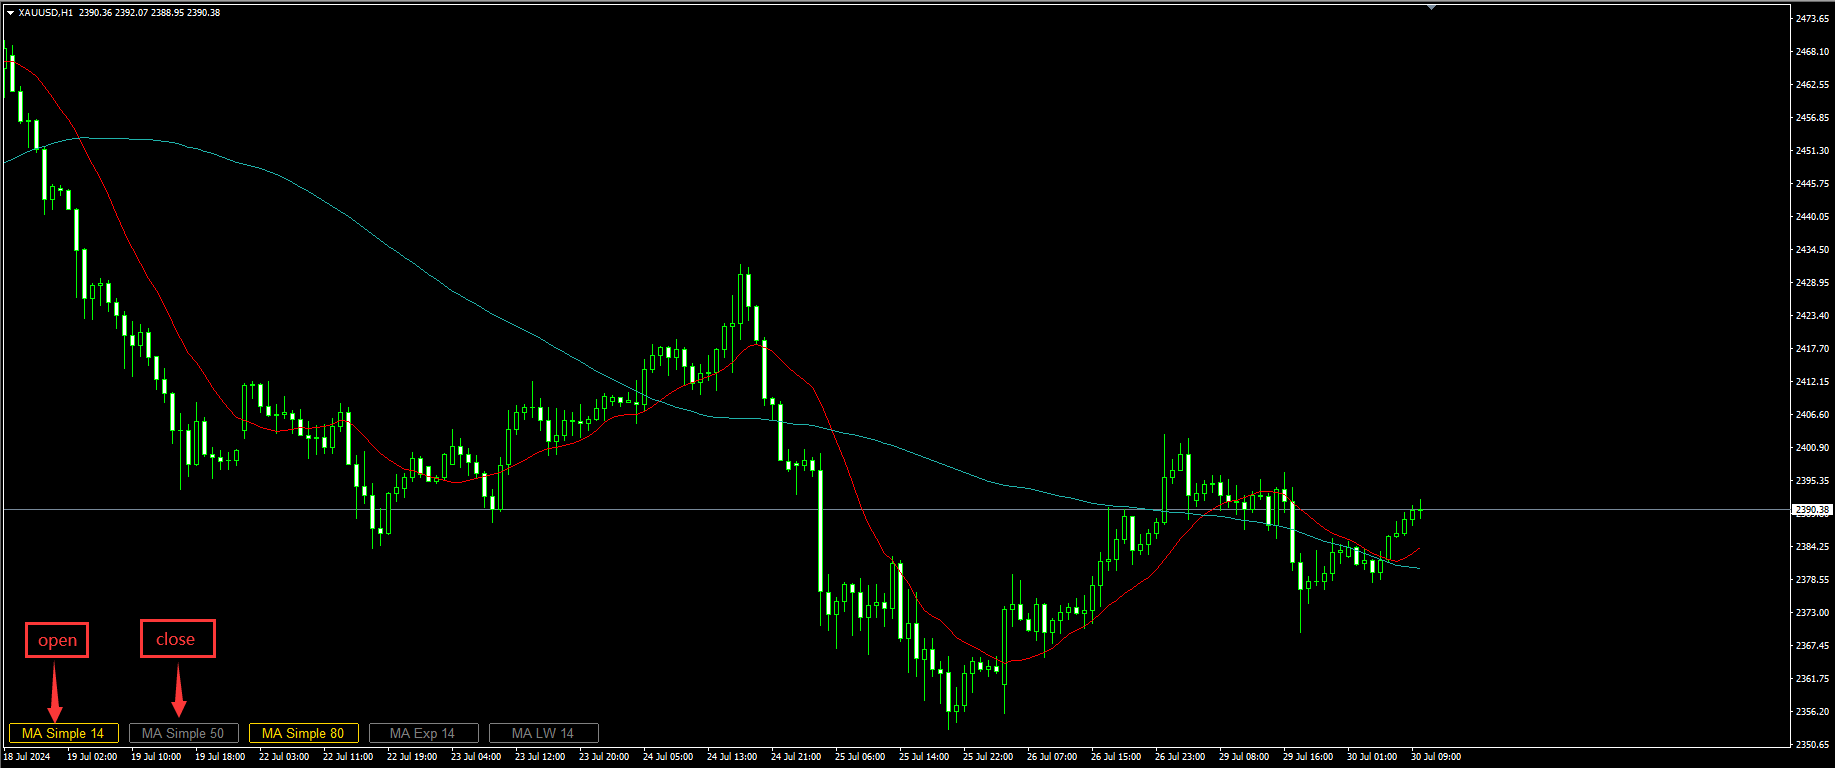
This is a standard moving average indicator.

I have added a quick control panel in the bottom left corner for it. When multiple different parameters of this indicator are simultaneously enabled, the control panel can quickly switch between different parameters of the indicator, making it easier to observe multiple indicators simultaneously

Parameter description:

Indicator ID: The unique ID of the indicator. When starting multiple instances, this ID must be unique and cannot be duplicated.
Control Panel Pos X: Position X of the Indicator Control Panel.
Control Panel Pos Y: Position Y of the Indicator Control Panel.
Control Panel Disappay Name: The text content displayed in the indicator control panel.

Period: Calculate the average period of the moving average line.
Shift: Indicator line offset by chart time.
Method: Method for calculating moving averages.
Applied Price: The price used to calculate the moving average.


Önerilen ürünler
The   Volume Weighted ATR indicator   is a helpful tool for measuring market activity. It is based on the idea of the Volume-Weighted ATR. Combining these two elements helps identify potential turning points or breakout opportunities. The indicator for the classification of the activity of the market uses the moving average and its multiples. Accordingly, where the VWATR bar is located (relative to the moving average), it is labelled as ultra-low, low, average, high, very high or ultra high. Th
FREE
The Tokyo Stock Exchange Session's Hours This indicator facilitates observing the currency pair's quotations during subsequent parts of the stock exchange session live. Before the session starts, a rectangle is drawn on the chart but not filled in with color. It means the extent of the session duration. Before the first bar enters the rectangle of the session, a sound signal or pop-up window will notify us that the session will just start. When the price graph crosses the edge of the session
FREE
InstantTrendLine
Sivakumar Subbaiya
Instant Trend Line  this indicator has been designed for multi time frame Buy Call: When the Blue Moving average (MA) line crossed above the Red Moving average (MA) . Sell Call: When the Blue Moving average (MA) line crossed below the Red Moving average (MA) . Happy and profitable trade for ever!!! this indicator is suitable for all time frame, but our recommended time frame is above 15 min chart. Suitable to all the forex chart
FREE
Highly configurable Average True Range (ATR) indicator. Features: Highly customizable alert functions (at levels, crosses, direction changes via email, push, sound, popup) Multi timeframe ability Color customization (at levels, crosses, direction changes) Linear interpolation and histogram mode options Works on strategy tester in multi timeframe mode (at weekend without ticks also) Adjustable Levels Parameters: ATR Timeframe: You can set the lower/higher timeframes for ATR. ATR Bar Shift: y
FREE
THE_____ IIIREX_CLAW_vs_CLUSTER_EAIII______ Set1: Price Offset 100, Stopp Loss 100-1000, Take Profit 2000  Set2: Price Offset 200, Stopp Loss 100-1000, Take Profit 2000 Set3: Price Offset 100, Stopp Loss 100-1000, Take Profit 1000 Set4: Price Offset 200, Stopp Loss 100-1000,  Take Profit 1000 Set5: PriceOffset 100-1000 (Recomment 200) higher is lower Risk, Stopp Loss  500  Take Profit  1000, 2000, or 3000 it is the same Target Set it to your Moneymanagement  Indize: DE40  “IC Market” Rec
FREE
Easily Identify
Khurram Mustafa
4.2 (20)
As per name  Easily Identify,  This Indicator is a  affordable trading tool  because with the help of  Popular Developers & Support of M Q L Platform  I have programmed this strategy. I tried to input 4 types and 3 periods of Calculation regarding Support Resistance, Furthermore, I have also care about Trend lines  that Trader can easily get in touch with market in another way also. What is in for Trader? Trading Modes:  This selection is for activate whole strategy  "Easily Identify" Support_
FREE
HMA grid EA
Dorian Baranes
3.67 (12)
HMA Grid EA is a grid system which analyzes trend based on the Hull Moving Average (HMA) indicator. Unlike the Simple Moving Average (SMA) the curve of HMA attempts to give an accurate signal by minimizing lags and improving the smoothness. This EA proposes two trading strategies which combine a slow period HMA to identify the main trend and a short period HMA to identify short trend reversal movement. This combination make usually sell and buy signals accurate and in case if the trend reverse w
FREE
Super trend is one of the best trend indicators in metatrader 4 (MT4). Triple SuperTrend indicator is an indicator that consist of three super trend indicator that can be aranged. This indicator is built by mql4 language and doesn't provided by MT4 platform. Highly recommended using EMA SuperTrend Strategy Indicator if you want to get better result in here: https://www.mql5.com/en/market/product/91664 This indicator is easy to use, power full and has many benefits, there are: Using three ind
FREE
Индикатор отображает скользящие средние на заданном количестве баров ( Count bar for show MA ). Данный способ отображения упрощает анализ, так как график не загромождён лишними линиями. Так же имеется текстовая метка с отображением текущей цены скользящей средней и периода графика. Горячие клавиши служат для упрощения использования индикатора.  Настройки индикатора: Moving average #1 - скользящая средняя #1 Period - период усреднения Mode - метод сглаживания Price - используемая цена для расч
FREE
The Toronto Stock Exchange Session's Hours This indicator facilitates observing the currency pair's quotations during subsequent parts of the stock exchange session live. Before the session starts, a rectangle is drawn on the chart but not filled in with color. It means the extent of the session duration. Before the first bar enters the rectangle of the session, a sound signal or pop-up window will notify us that the session will just start. When the price graph crosses the edge of the sessio
FREE
The Shenzhen Stock Exchange Session's Hours This indicator facilitates observing the currency pair's quotations during subsequent parts of the stock exchange session live. Before the session starts, a rectangle is drawn on the chart but not filled in with color. It means the extent of the session duration. Before the first bar enters the rectangle of the session, a sound signal or pop-up window will notify us that the session will just start. When the price graph crosses the edge of the sessi
FREE
The Bombay Stock Exchange Session's Hours This indicator facilitates observing the currency pair's quotations during subsequent parts of the stock exchange session live. Before the session starts, a rectangle is drawn on the chart but not filled in with color. It means the extent of the session duration. Before the first bar enters the rectangle of the session, a sound signal or pop-up window will notify us that the session will just start. When the price graph crosses the edge of the session
FREE
The Shanghai Stock Exchange Session's Hours This indicator facilitates observing the currency pair's quotations during subsequent parts of the stock exchange session live. Before the session starts, a rectangle is drawn on the chart but not filled in with color. It means the extent of the session duration. Before the first bar enters the rectangle of the session, a sound signal or pop-up window will notify us that the session will just start. When the price graph crosses the edge of the sessi
FREE
Features: 1- Get OB/OS Levels from Golden MA Levels 2- Wait for Buy/Sell Start Level Cross 3- Optional: Should price cross Mid Level in earlier bars 4- Optional: Crossing bar High/Medium Volume 5- Optional: MA Stacked to check up/down trend for current TF 6- Optional: NRTR higher timeframes aligned Check Detailed blog post explained: https://www.mql5.com/en/blogs/post/758457 Levels with Buffers available here: Golden MA Levels Indicator: https://www.mql5.com/en/market/product/119515
FREE
Market Line Price Color
Rodolfo Leonardo De Morais
Simple Market Line Price Color This indicator allows you to see the market's aggregation by buying or selling on the price line. when it is attacked the sale turns into a color when it is attacked the purchase takes on another color Indicator Parameters indicator_colorUP - Color of UP price  aggregation   indicator_colorDown - Color of Down    price    aggregation   indicator_WIDTH - WIDTH Line in chart Good Trades 
FREE
This is a utility to allow you to quickly add and remove Elliot Wave numbers and letters to your charts allowing you to plot the main and sub Elliot waves for easy chart analysis. Please note, this is not an Indicator that adds the characters automatically, it is a utility to manually add them yourself with ease.   Elliot Characters and Buttons on screen:   0,1,2,3,4,5 A,B,C i,ii,iii,iv,v a,b,c Delete Input Parameters: Colors Font Size Font Type This is a free utility for MT4 only Check out
FREE
Parabolic SAR extreme When the Parabolic SAR value indicates an uptrend or downtrend, the EA will open a buy or sell trade respectively, given that all other criteria are met This EA allows you to set up to 21 separate Parabolic SAR  criteria for the EA to work on  There are 3 input parameter sets (SAR1, SAR2, and SAR3) Each set allows you to determine the parameters (such as the step and max step) for each set And within each set, you get to indicate up to 7 timeframe for the EA to operate in
FREE
Unfortunately I have had the experience that when the MT5 terminal updates or the PC, server or MT5 terminal crashes, updates or restarts, many of the global variables are reset to the state at which the terminal was last closed "normally". So I developed this utility to automatically save global variables from the terminal in a specific time interval, and if something happens, you have the option to reset all global variables to the last saved value with just a few clicks.
FREE
MASi Wave Histogram
Aleksey Terentev
5 (1)
This is an implementation of the market cycle indicator described by Raghee Horner in the book "Forex Trading for Maximum Profit" . The current state of the market can be determined by analyzing the inclination angle of the exponential moving average (EMA) running on a period of 34 bars. If the EMA inclination is defined as the direction of the hour hand on the dial from 12 to 2 hours, then an uptrend is considered to be present; from 2 to 4 hours, the market consolidates; from 4 to 6 hours, a d
FREE
This adviser trades by volume, analyzing candles. It is a free version of Volume candlex master . Differences from the paid ones are that there are not some functions here: working on 2 timeframes, using Moving average, dynamic stop-loss and take-profit, and also the maximum lot is limited (no more than 0.10). Recommended timeframes: M5, M15, M30. Before trading, optimize the parameters of the advisor for your account. Input parameters Lots -  lot size; MaxSpread -  the maximum spread for the op
FREE
BrokerInfo
Nikolaos Pantzos
5 (2)
'BrokerInfo' is an indicator to show some information of account on the chart. You can to see on chart information about: GMT time. Broker time. Maximum simultaneously open orders. Leverage. Maximum lot size. Minimum lot size. Lot step. Stop level in pips. Symbol spread in pips. You can to get source code from here . Parameters SizeBackground – background size. PositionUpDn – position to show info on the chart.
FREE
Entry logic The EA, called EA_BreakTheBox, creates a rectangle BOX based on the highest and lowest price within a certain time period. Once the BOX is formed, the EA is ready for entry. It allows you to input the time period for forming the BOX, and you can set a time filter for the EA. The default setting for EntryPips is 2 pips, but this can be changed. If the price breaks the upper price of the BOX by 2 pips, then a BUY Entry is placed (if Reverse mode=true). If the price breaks the lower pri
FREE
Voorloper MT4
Pradana Novan Rianto
4.38 (13)
Voorloper Expert Advisor: Revolutionizing Trading with DDR System Introducing Voorloper, an innovative Expert Advisor that blends Moving Average (MA) and Relative Strength Index (RSI) indicators to redefine your trading experience. Voorloper stands out from the crowd with its unique feature: the Drawdown Reduction (DDR) System. Key Features: MA and RSI Integration:   Voorloper utilizes a powerful combination of Moving Average and Relative Strength Index indicators to identify optimal entry and
FREE
çalışma mantığı Stop Out yardımcı programı, Stop Out seviyesine kaç puan kaldığını gösteren basit ama çok kullanışlı bir göstergedir / Avantajı, birçok tüccarın kâr peşinde alım satım yaparken riski kasıtlı olarak fazla tahmin etmesi, mevcut marjı maksimumda kullanması ve bu durumda komisyoncunun pozisyonlarınızı zorla nerede kapatabileceğini bilmek çok önemlidir. Sadece göstergeyi grafiğe yerleştirin ve Al veya Sat'taki açık pozisyona bağlı olarak, bu işlem için fiyatın sınır işaretini g
FREE
BidAskLine
Isaac Montesinos Valdes
4.4 (5)
Description:   -   BidAskLine Indicator is very simple and easy, but each utility can be important in the probability that we will win in our trade. This utility Indicator shows lines and prices of the Bid, Ask and Spread. Input Parameters:   -   Visual Aspect Options : Select between 2 options with Box or Simple Style.   -   Parameters Bid Price : Select between show or hide line or box objects, change color, style or width line.   -   Parameters Ask Price : Select between show or hide line or
FREE
NATS (Niguru Automatic Trailing Stop) will help you achieve more profits, by setting the trailing stop automatically. Pair this NATS application with EA, or can also be used as a complement to manual trading. A trailing stop is a powerful tool in trading that combines risk management and profit optimization.  A trailing stop is a type of market order that sets a stop-loss at a percentage below the market price of an asset, rather than a fixed number. It dynamically adjusts as the asset’s pric
FREE
Psychology
Tais Miranda Hoffmann
5 (3)
The most different product of the site: This tool is an auxiliary tool aimed at managing your trades and psychological discussions. As you probably know, more than 70% of the reason for the success of big traders is psychological issues. Only 30% is related to your strategy. So it is better to strengthen this big part with a tool. With a free tool, I allow you to become a better trader   This tool consists of several rules. In version 1.0, we have 7 rules. In later versions, we will add more ru
FREE
MT4 Sürümü : https://www.mql5.com/en/market/product/121289 MT5 Sürümü : https://www.mql5.com/en/market/product/121290 "Logo" betiği, MetaTrader 4'te (MT4) bir işlem grafiğinde arka plan olarak özel bir logo veya resim görüntülemek için tasarlanmıştır. Bu betik, yatırımcıların grafiklerini logolar veya istedikleri diğer resimlerle kişiselleştirmelerine olanak tanır. Nasıl Çalışır: Resim Hazırlama: Grafikte logo olarak görüntülemek istediğiniz resmi seçerek başlayın. Herhangi bir resi
FREE
I Compass
Nikolaos Pantzos
5 (1)
This indicator uses Moving Average to detect markets trend. It's a very useful tool for manual trading. If line is Midnight Blue, indicator detect up trend. If line is Dark Violet, indicator detect down trend. The readings are very simple to use and understand. Indicator works best on H1 timeframe. You can use this indicator with FollowLine to have more accurate signals. You can to get source code from here . Parameters BarsCount —How many bars used to show the line. MAperiods —Period of Mov
FREE
Contact me for any queries or custom orders, if you want to use this in an EA. Key Features: Pattern Recognition : Identifies Fair Value Gaps (FVGs) Spots Break of Structure (BOS) points Detects Change of Character (CHoCH) patterns Versatile Application : Optimized for candlestick charts Compatible with any chart type and financial instrument Real-Time and Historical Analysis : Works seamlessly with both real-time and historical data Allows for backtesting strategies and live market analysis V
FREE
Bu ürünün alıcıları ayrıca şunları da satın alıyor
Gann Made Easy
Oleg Rodin
4.85 (81)
Gann Made Easy , bay teorisini kullanarak ticaretin en iyi ilkelerine dayanan, profesyonel ve kullanımı kolay bir Forex ticaret sistemidir. WD Gann. Gösterge, Zararı Durdur ve Kâr Al Seviyeleri dahil olmak üzere doğru SATIN AL ve SAT sinyalleri sağlar. PUSH bildirimlerini kullanarak hareket halindeyken bile işlem yapabilirsiniz. Lütfen satın aldıktan sonra benimle iletişime geçin! Alım satım ipuçlarımı ve harika bonus göstergelerini ücretsiz olarak sizinle paylaşacağım! Muhtemelen Gann ticaret y
TPSpro RFI Levels
Roman Podpora
4.82 (22)
Reversal First Impulse levels (RFI)    INSTRUCTIONS        RUS       -       ENG              R ecommended to use with an indicator   -   TPSpro  TREND PRO -  Version MT5 A key element in trading is zones or levels from which decisions to buy or sell a trading instrument are made. Despite attempts by major players to conceal their presence in the market, they inevitably leave traces. Our task was to learn how to identify these traces and interpret them correctly. Main functions: Displaying activ
Atomic Analyst
Issam Kassas
5 (2)
Öncelikle belirtmek gerekir ki bu Ticaret Göstergesi Yeniden Çizim Yapmaz, Gecikmez ve Gecikme Göstermez, bu da hem manuel hem de robot ticareti için ideal hale getirir. Kullanıcı kılavuzu: ayarlar, girişler ve strateji. Atom Analisti, Piyasada Daha İyi Bir Avantaj Bulmak İçin Fiyatın Gücünü ve Momentumunu Kullanan PA Fiyat Hareketi Göstergesidir. Gürültüleri ve Yanlış Sinyalleri Kaldırmaya ve Ticaret Potansiyelini Artırmaya Yardımcı Olan Gelişmiş Filtrelerle Donatılmıştır. Birden fazla katma
Gold Stuff
Vasiliy Strukov
4.89 (238)
Gold Stuff, özellikle altın için tasarlanmış bir trend göstergesidir ve herhangi bir finansal enstrümanda da kullanılabilir. Gösterge yeniden çizilmez ve gecikmez. Önerilen zaman dilimi H1. Bu göstergede tam otomatik Uzman Danışman EA Gold Stuff çalışır. Profilimde bulabilirsiniz. Ayarları ve kişisel bir bonusu almak için satın alma işleminden hemen sonra benimle iletişime geçin!  Güçlü Destek ve Trend Tarayıcı göstergemizin ücretsiz bir kopyasını pm'den alabilirsiniz. Ben! AYARLAR Ok Ç
Trend Punch
Mohamed Hassan
4.95 (19)
This indicator is unstoppable when combined with our other indicator called  Support & Resistance . After purchase, send us a message and you will get it   for  FREE as a BONUS! Introducing Trend Punch , the revolutionary forex trend indicator that will transform the way you trade! Trend Punch is uniquely designed to provide precise buy and sell arrows during strong market trends, making your trading decisions clearer and more confident. Whether you're trading major currency pairs or exotic sym
Scalper Inside PRO
Alexey Minkov
4.73 (56)
An exclusive indicator that utilizes an innovative algorithm to swiftly and accurately determine the market trend. The indicator automatically calculates opening, closing, and profit levels, providing detailed trading statistics. With these features, you can choose the most appropriate trading instrument for the current market conditions. Additionally, you can easily integrate your own arrow indicators into Scalper Inside Pro to quickly evaluate their statistics and profitability. Scalper Inside
TPSproTREND PrO
Roman Podpora
4.79 (19)
TPSpro TREND PRO,   piyasayı otomatik olarak analiz eden, trend ve değişimlerinin her biri hakkında bilgi sağlayan, ayrıca yeniden çizmeden işlemlere girme sinyalleri veren bir trend göstergesidir! Gösterge her mumu ayrı ayrı analiz ederek kullanır. farklı dürtülere atıfta bulunur - yukarı veya aşağı dürtü. Para birimleri, kripto paralar, metaller, hisse senetleri ve endeksler için işlemlere tam giriş noktaları! Sürüm MT5                   GÖSTERGENİN TAM AÇIKLAMASI       Bunu -   RFI SEVİYELER
FX Power MT4 NG
Daniel Stein
5 (12)
Sabah Brifingimiz burada mql5 ve on Telegram! FX Power MT4 NG , uzun zamandır çok popüler olan döviz gücü ölçerimiz FX Power'ın yeni neslidir. Peki bu yeni nesil güç ölçer ne sunuyor? Orijinal FX Power hakkında sevdiğiniz her şey PLUS GOLD/XAU güç analizi Daha da hassas hesaplama sonuçları Ayrı ayrı yapılandırılabilir analiz dönemleri Daha da iyi performans için özelleştirilebilir hesaplama limiti Özel çokluDaha fazlasını görmek isteyenler için örnek ayarlar Her grafikte en sevdiğiniz renkler i
Şu anda %20 İNDİRİMLİ! Herhangi bir Acemi veya Uzman Tüccar için En İyi Çözüm! Bu gösterge paneli yazılımı 28 döviz çifti üzerinde çalışıyor. Ana göstergelerimizden 2'sine (Gelişmiş Para Birimi Gücü 28 ve Gelişmiş Para Birimi Dürtüsü) dayanmaktadır. Tüm Forex piyasasına harika bir genel bakış sağlar. Gelişmiş Para Birimi Gücü değerlerini, para birimi hareket hızını ve tüm (9) zaman dilimlerinde 28 Forex çifti için sinyalleri gösterir. Trendleri ve / veya scalping fırsatlarını belirlemek içi
Chart Patterns All-in-One göstergesi, traderların teknik analizde yaygın olarak kullanılan çeşitli grafik desenlerini görselleştirmelerine yardımcı olur. Bu gösterge, potansiyel piyasa hareketlerini belirlemeye yardımcı olur ancak kârlılığı garanti etmez. Satın almadan önce göstergeyi demo modunda test etmeniz önerilir. Mevcut Teklif : "Chart Patterns All in One" göstergesinde %50 indirim. Dahil Edilen Desenler : 1-2-3 Deseni : Üç önemli nokta (yüksekler veya düşükler) kullanarak piyasa tersine
Trend Screener
STE S.S.COMPANY
4.8 (87)
Trend Göstergesi, Trend Alım Satım ve Filtreleme için Çığır Açan Benzersiz Çözüm, Tüm Önemli Trend Özellikleriyle Tek Bir Araç İçinde Yerleştirildi! Forex, emtialar, kripto para birimleri, endeksler ve hisse senetleri gibi tüm sembollerde/araçlarda kullanılabilen %100 yeniden boyamayan çoklu zaman çerçevesi ve Çoklu para birimi göstergesidir. SINIRLI SÜRELİ TEKLİF: Destek ve Direnç Tarama Göstergesi sadece 50$ ve ömür boyu mevcuttur. (Orijinal fiyat 250$) (teklif uzatıldı) Trend Screener, grafik
FX Volume
Daniel Stein
4.58 (33)
Sabah Brifingimiz aracılığıyla ayrıntılar ve ekran görüntüleri ile günlük piyasa güncellemenizi alın burada mql5 ve on Telegram ! FX Volume, bir brokerin bakış açısından piyasa duyarlılığı hakkında GERÇEK bir fikir veren İLK ve TEK hacim göstergesidir. COT raporlarından çok daha hızlı bir şekilde, brokerlar gibi kurumsal piyasa katılımcılarının Forex piyasasında nasıl konumlandıklarına dair harika bilgiler sağlar. Bu bilgileri doğrudan grafiğinizde görmek, ticaretiniz için gerçek oyun değiştir
- Real price is 80$ - 40% Discount ( It is 49$ now ) Contact me for instruction, add group and any questions! Related EA Product: Bitcoin Expert Introduction The breakout and retest strategy is traded support and resistance levels. it involves price breaking through a previous level.  The break and retest strategy is designed to help traders do two main things, the first is to avoid false breakouts. Many false breakouts start with a candlestick that breaks out of a level but ends with an immedi
ŞU ANDA %31 INDIRIMLI !!! Yeni Başlayanlar veya Uzman Tüccarlar için En İyi Çözüm! Bu gösterge benzersiz, yüksek kaliteli ve uygun fiyatlı bir ticaret aracıdır çünkü bir dizi tescilli özellik ve gizli bir formül ekledik. Yalnızca BİR grafikle 28 döviz çiftinin tümü için Uyarılar verir. Yeni bir trendin veya scalping fırsatının tam tetik noktasını belirleyebildiğiniz için ticaretinizin nasıl gelişeceğini hayal edin! Yeni temel algoritmalar üzerine inşa edilen bu sistem, potansiyel işlemler
Enigmera
Ivan Stefanov
5 (3)
ENIGMERA: Pazarın çekirdeği https://www.enigmera.com Giriş Bu gösterge ve ticaret sistemi, finansal piyasalar için dikkate değer bir yaklaşımdır. ENIGMERA, destek ve direnç seviyelerini doğru bir şekilde hesaplamak için fraktal döngüleri kullanır. Gerçek birikim aşamasını gösterir ve yön ve hedefler verir.  İster bir trendde ister bir düzeltmede olalım çalışan bir sistem.  Nasıl çalışır? ENIGMERA üç çizgiden oluşur: destek/direnç çizgisi, hedef çizgisi ve sapma çizgisi. Sistem, geçmiş veril
Trend Cutter
Oleg Rodin
5 (2)
Trend Cutter, M1 ve M5 gibi daha düşük zaman dilimleri de dahil olmak üzere herhangi bir zaman diliminde kullanılabilen bir trend göstergesidir. Gösterge, gün içi ticareti tercih eden yatırımcılar için idealdir ve uzun vadeli ticareti tercih edenlere de yardımcı olacaktır. Bu göstergeyi ticaret sisteminiz için bir temel olarak veya bağımsız bir ticaret çözümü olarak kullanabilirsiniz. Gösterge, PUSH bildirimleri de dahil olmak üzere her türlü uyarıyı sağlar. Göstergenin kullanımı çok kolaydır. S
PRO Renko Sistemi, RENKO grafikleri ticareti için özel olarak tasarlanmış son derece hassas bir ticaret sistemidir. Bu, çeşitli ticaret araçlarına uygulanabilen evrensel bir sistemdir. Sistemi etkin piyasa sana doğru ters sinyallerine erişim hakkı denilen ses nötralize eder. Göstergenin kullanımı çok kolaydır ve sinyal üretiminden sorumlu tek bir parametreye sahiptir. Aracı, seçtiğiniz herhangi bir ticaret aracına ve renko çubuğunun boyutuna kolayca uyarlayabilirsiniz. Yazılımımla karlı b
ŞU ANDA %26 INDIRIMLI Yeni Başlayanlar veya Uzman Tüccarlar için En İyi Çözüm! Bu Gösterge benzersiz, yüksek kaliteli ve uygun fiyatlı bir ticaret aracıdır çünkü bir dizi tescilli özellik ve yeni bir formül ekledik. Sadece BİR grafik ile 28 Forex çifti için Döviz Gücünü okuyabilirsiniz! Yeni bir trendin veya scalping fırsatının tam tetik noktasını belirleyebildiğiniz için ticaretinizin nasıl gelişeceğini hayal edin? Kullanım kılavuzu: buraya tıklayın Bu ilk olan, orijinal! Değersiz bir
Fiyat tersine döndükçe ve geri çekildikçe piyasa yapısından elde edilen kâr değişir. Piyasa yapısını tersine çevirme uyarısı göstergesi, bir trendin veya fiyat hareketinin ne zaman tükenmeye yaklaştığını ve tersine dönmeye hazır olduğunu tanımlar. Genellikle bir geri dönüş veya büyük bir geri çekilme meydana gelmek üzereyken meydana gelen piyasa yapısındaki değişiklikler konusunda sizi uyarır. Gösterge, olası bir tükenme noktasının yakınında her yeni yüksek veya düşük oluştuğunda, başlangıçta
TakePropips Donchian Trend Pro
Eric John Pajarillaga Aldana
4.44 (16)
TakePropips Donchian Trend Pro   (MT4), Donchian Kanalı'nı kullanarak trendin yönünü otomatik olarak tespit eden ve size ticarete giriş ve çıkış sinyalleri sağlayan güçlü ve etkili bir araçtır! Bu çok işlevli gösterge, bir trend tarayıcı, ticaret sinyalleri, istatistiksel panel, tarayıcı, ticaret oturumları ve uyarı geçmişi panosu içerir. Size ticaret sinyalleri sağlamak ve çizelgeleri analiz ederek saatlerce tasarruf etmenizi sağlamak için tasarlanmıştır! Kullanım kılavuzunu ve kurulum kılavuzu
Grafiğinizde otomatik olarak destek ve direnç seviyeleri PLUS itici mum boşlukları çizin, böylece fiyatın nereye gidebileceğini ve / veya potansiyel olarak tersine dönebileceğini görebilirsiniz. Bu gösterge, web sitemde (The Market Structure Trader) öğretilen pozisyon ticareti metodolojisinin bir parçası olarak kullanılmak üzere tasarlanmıştır ve hedefleme ve potansiyel girişler için temel bilgileri görüntüler. Göstergede 2 TEMEL özellik ve 4 ek özellik bulunmaktadır: TEMEL ÖZELLİK 1 - Günl
Currency Strength Wizard , başarılı ticaret için size hepsi bir arada çözüm sağlayan çok güçlü bir göstergedir. Gösterge, birden çok zaman dilimindeki tüm para birimlerinin verilerini kullanarak şu veya bu forex çiftinin gücünü hesaplar. Bu veriler, şu veya bu para biriminin gücünü görmek için kullanabileceğiniz, kullanımı kolay para birimi endeksi ve para birimi güç hatları biçiminde temsil edilir. İhtiyacınız olan tek şey, işlem yapmak istediğiniz tabloya göstergeyi eklemektir ve gösterge size
IX Power MT4
Daniel Stein
5 (5)
IX Power nihayet FX Power'ın rakipsiz hassasiyetini Forex dışı sembollere getiriyor. En sevdiğiniz endeksler, hisse senetleri, emtialar, ETF'ler ve hatta kripto para birimlerindeki kısa, orta ve uzun vadeli eğilimlerin yoğunluğunu doğru bir şekilde belirler. Terminalinizin sunduğu her şeyi analiz edebilirsiniz. Deneyin ve işlem yaparken zamanlamanızın nasıl önemli ölçüde iyileştiğini deneyimleyin. IX Power Temel Özellikler 100 hassas, yeniden boyanmayan hesaplama sonuçları - terminalini
ADR Ters Çevirme Göstergesi, normal ortalama günlük aralığına göre fiyatın şu anda nerede işlem gördüğünü bir bakışta size gösterir. Fiyat, ortalama aralığı ve seçtiğiniz seviyenin üzerindeki seviyeleri aştığında, açılır pencere, e-posta veya push yoluyla anında uyarılar alacaksınız, böylece hızlı bir şekilde geri çekilmelere ve geri dönüşlere atlayabilirsiniz. Gösterge, grafikte ortalama günlük aralık uç noktalarında yatay çizgiler ve ayrıca fiyatları aşan matematiksel olasılıkları olan seviye
Trend Pulse
Mohamed Hassan
5 (4)
Please contact me after purchase to immediately get your PDF strategy + documentation for Trend Pulse !  Introducing Trend Pulse , a unique and robust indicator capable of detecting bullish, bearish, and even ranging trends! Trend Pulse uses a special algorithm to filter out market noise with real precision. If the current symbol is moving sideways, Trend Pulse will send you a ranging signal, letting you know that it's not a good time to enter a trade. This excellent system makes Trend Pulse
RSI / TDI uyarı panosu, ticaret yaptığınız her büyük çiftte RSI'leri (sizin tarafınızdan seçilebilir) bir kerede izlemenize olanak tanır. İki şekilde kullanabilirsiniz: 1. Birden fazla zaman çerçevesi seçin ve çizgi, normal ticaret koşullarının ötesine geçen birden fazla zaman çerçevesi olduğunda size gösterecektir. Birden fazla zaman diliminde aşırı alım veya aşırı satım seviyesine ulaştığı için fiyatın son zamanlarda sert bir şekilde yükseldiğinin harika bir göstergesi, bu nedenle yakın
Stratos Pali Indicator   is a revolutionary tool designed to enhance your trading strategy by accurately identifying market trends. This sophisticated indicator uses a unique algorithm to generate a complete histogram, which records when the trend is Long or Short. When a trend reversal occurs, an arrow appears, indicating the new direction of the trend. Important Information Revealed Leave a review and contact me via mql5 message to receive My Top 5 set files for Stratos Pali at no cost! D
Gold Channel is a volatility-based indicator, developed with a specific timing algorithm for the XAUUSD pair, which consists of finding possible corrections in the market. This indicator shows two outer lines, an inner line (retracement line) and an arrow sign, where the theory of the channel is to help identify overbought and oversold conditions in the market. The market price will generally fall between the boundaries of the channel. If prices touch or move outside the channel it is a tra
M1 Arrow
Oleg Rodin
4.73 (15)
Piyasanın iki temel ilkesine dayanan bir gün içi stratejisi. Algoritma, ek filtreler kullanarak hacimlerin ve fiyat dalgalarının analizine dayanmaktadır. Göstergenin akıllı algoritması, yalnızca iki piyasa faktörü bir araya geldiğinde bir sinyal verir. Gösterge, daha yüksek zaman çerçevesinin verilerini kullanarak M1 grafiğinde belirli bir aralıktaki dalgaları hesaplar. Ve dalgayı doğrulamak için gösterge, hacme göre analizi kullanır. Bu gösterge hazır bir ticaret sistemidir. Bir tüccarın ihtiya
Bomb Bank Signal
Igor Pereira Calil
5 (1)
Bomb Bank Signal: Your Trusted Indicator for MetaTrader 4 The Bomb Bank Signal is a powerful indicator for MetaTrader 4, designed to identify the most relevant trends in the financial market. If you are looking for a tool that accurately anticipates movements, Bomb Bank is the ally you need. How it Works: This indicator combines three distinct methods – volume analysis, candle closes and symmetrical trend – to detect and signal buying and selling opportunities. Bomb Bank is like a "bomb"
Yazarın diğer ürünleri
This indicator can display the remaining time of the current K-line closing in real time Supports any time period Automatically and dynamically follow the current K-line position Automatically calculate days, hours, minutes, and seconds I have added a quick control panel in the bottom left corner for it. When multiple different Bank series indicators are enabled at the same time, the control panel can quickly switch between displaying/hiding each indicator, so that the chart does not display
FREE
This is a standard Bollinger Bands indicator. I have added a quick control panel in the bottom left corner for it. When multiple different parameters of this indicator are simultaneously enabled, the control panel can quickly switch between different parameters of the indicator, making it easier to observe multiple indicators simultaneously. For example, it is possible to quickly switch observations while combining a period of 20 and a period of 30. Parameter description: Indicator ID: The uniqu
FREE
This is a dashboard indicator that can display daily volatility, making it convenient for traders to quickly view. The following information can be displayed: Yesterday's high, low, and closing prices. Today's high point, low point, opening price. Dynamically display the number of points up and down from today's opening to the current level. Calculate and display the daily rise and fall points for today, yesterday, 5 days, 10 days, 20 days, 30 days, and 90 days. Current real-time spread. Curre
The Zigzag indicator can help traders identify and confirm the main trends and reversal points in price movements. By connecting significant high and low points, the Zigzag indicator can clearly display the overall trend of the market, helping traders make wiser decisions when analyzing price behavior. Supports any time period. I have added a quick control panel in the bottom left corner for it. When multiple different Bank series indicators are enabled at the same time, the control panel can qu
PinBar is a common candlestick chart form, often used as a reversal signal. This indicator will be marked with an arrow at the PinBar position after its formation. Supports any time period. At present, this indicator is only calculated and judged based on the upper and lower shadows of the K-line and the values of the entity. In the future, intelligent judgment based on other factors of the market will be added. I have added a quick control panel in the bottom left corner for it. When multip
EngulfingPattern is a common candlestick chart form, often used as a reversal signal. This indicator will be marked with double arrow at the EngulfingPattern position after its formation. Supports any time period. At present, this indicator is only calculated and judged based on the upper and lower shadows of the K-line and the values of the entity. In the future, intelligent judgment based on other factors of the market will be added. I have added a quick control panel in the bottom left co
Filtrele:
İnceleme yok
İncelemeye yanıt