• Genel bakış
  • İncelemeler
  • Yorumlar

Separated Volume

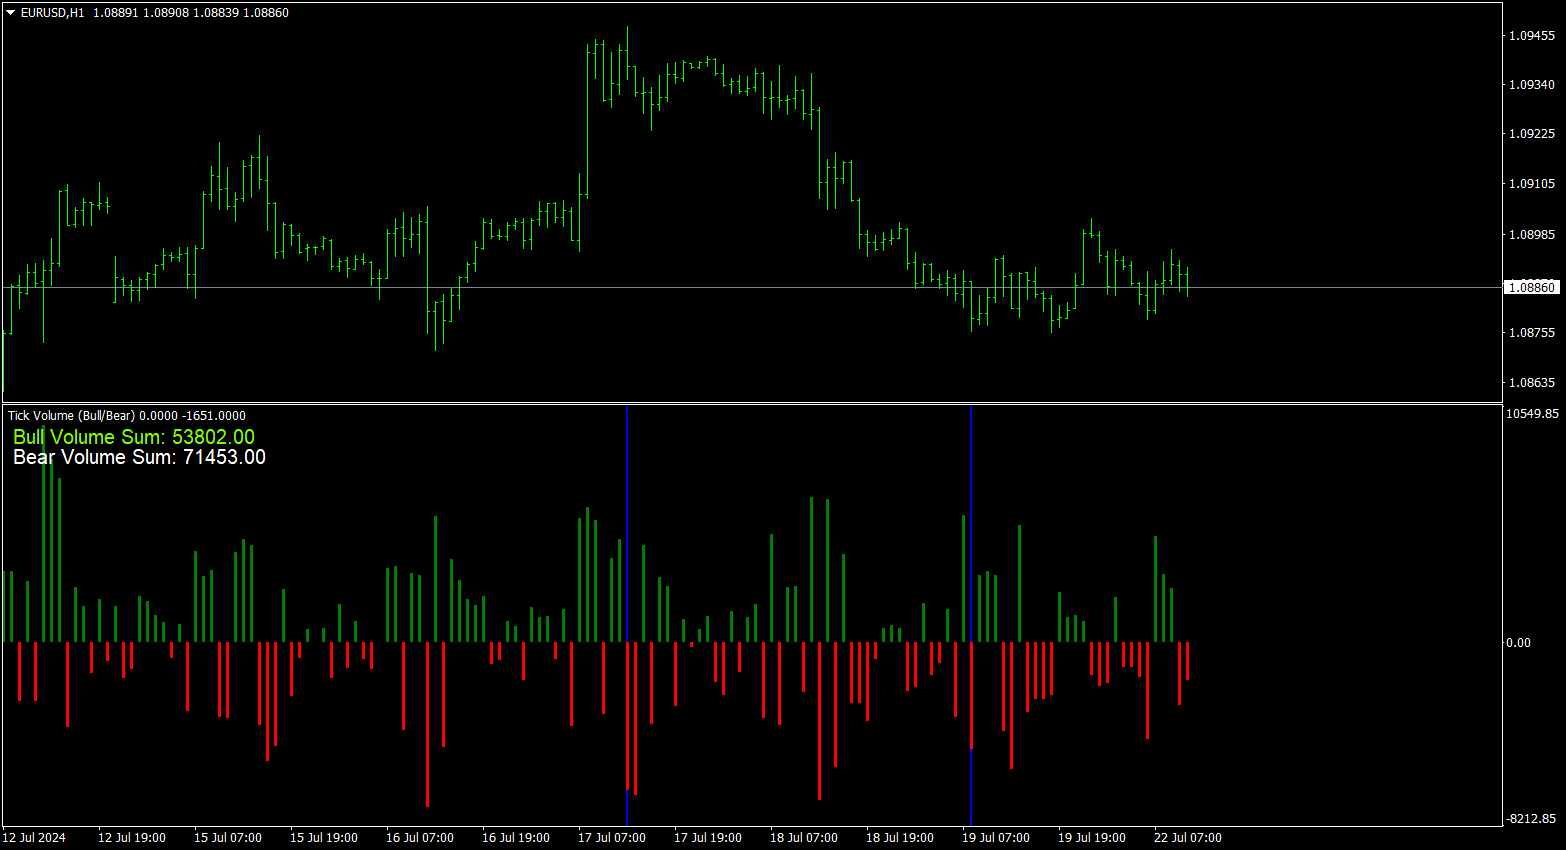
Bu gösterge, forex piyasasındaki tik hacmini etkin bir şekilde yükseliş ve düşüş kategorilerine ayırır.

Ek olarak, seçtiğiniz herhangi bir dönem için yükseliş ve düşüş kene hacimlerinin toplamını hesaplama ve görüntüleme işlevselliği sağlar.

Grafikteki iki mavi çizgiyi hareket ettirerek dönemi kolayca ayarlayabilir, ticaret ihtiyaçlarınıza göre özelleştirilebilir ve hassas hacim analizine izin verebilirsiniz.

Eğer faydalı bulursanız yorumlarınız takdir edilecektir!

Mutlu ticaretler!


Önerilen ürünler
This indicator is a visual combination of 2 classical indicators: Bears and MACD. Usage of this indicator  could be the same as both classical indicators separately or combine.  Input parameters: input int BearsPeriod = 9;  input ENUM_MA_METHOD maMethod = MODE_SMA; input ENUM_APPLIED_PRICE maPrice = PRICE_CLOSE; input int SignalPeriod = 5.
Introducing Momentum Jurik—an innovative indicator designed to optimize your forex trading strategy by incorporating custom moving averages based on the Momentum indicator with the MetaTrader 4 indicator, Momentum. Jurik moving averages are renowned for their precision and reliability in analyzing price movements in the forex market. They provide traders with smoother representations of price action, reducing noise and offering clearer signals for identifying trends and potential reversals.
FREE
FATL wpr AM
Andriy Matviyevs'kyy
The product combines the best features of the standard WPR oscillator with the adaptive digital filter. The indicator allows entering and exiting the market at the very beginning and end of a trend. The indicator generates high-probability signals while retaining high sensitivity. The indicator does not repaint on fully formed bars. Options: Ind_Price - price used for the indicator calculation; Ind_Period - indicator period. Application rules: A big red dot - a strong bearish trend, if the price
FREE
RSI Jurik
Augustine Kamatu
Introducing RSI Jurik—an innovative indicator designed to revolutionize your forex trading strategy by combining custom moving averages based on the Relative Strength Index (RSI) with the MetaTrader 4 indicator, RSI. Jurik moving averages are renowned for their accuracy and reliability in analyzing price movements in the forex market. They provide traders with smoother representations of price action, reducing noise and offering clearer signals for identifying trends and potential reversals.
FREE
Gösterge, dürtü mumlarını arar ve bunları grafikte görüntüler. Bir gölge filtresi içerir. Ayrıca Bollinger Bantlarının koparma seviyelerini de bulur. Ayarlarda çoklu para birimi gösterge tablosunu etkinleştirebilirsiniz. Uyarı, mevcut grafik veya tüm liste arasında seçim yapar. Blog-Link -  Retest and Fake Breakout with UPD1 Ticaret modelleri: Trend yeniden testi. Yanlış Kopuş. Diğerleri. EURUSD, GBPUSD, XAUUSD, ... M15, M30, H1. Giriş parametreleri. Temel. Bars Count - göstergenin üzer
WMA Alert
Santi Dankamjad
Indicator overview   Trend indicator usage Moving averages. Highest quality alerts that need no introduction. It is completely loyal to the original algorithm and uses other useful features. Easy to trade Carry out all kinds of notifications It's not a new paint and it's not a back paint. Setting Indicator WMA50 in Time frame H1 for any pair currency and Gold Spot. EMA200 in Time frame H1 for any pair currency and more than EMA250 for Gold spot. Using it for maximum benefit Set up notificatio
FREE
FIBO Trend PRO mt4
Evgenii Aksenov
5 (8)
The indicator allows you to instantly determine the current trend by color and FIBO levels. Higher Timeframe the panel shows the current trend of higher periods, helping to determine the strength of the trend Trade according to the trend when changing the color of candles or trade against the trend when the price hit the extreme levels of the   FIBO Trend PRO  indicator     Advantages of the FIBO Trend PRO Indicator never repaint and does not change their values Very easy to use and intuitive
AW Classic MACD
AW Trading Software Limited
4.67 (6)
Modified oscillator MACD. A classic indicator that combines a trend indicator with an oscillator to detect entry points. Has a multi-timeframe panel and 3 types of notifications Benefits: Works on all instruments and timeseries Trend indicator with   oscillator for inputs Multi-period panel on all timeframes Pluggable arrows when signals appear Three types of notifications: push, email, alert MT5 version ->  HERE  / Our news ->  HERE   How the indicator works: AW Classic MACD - Indicato
FREE
USA Indexes Quant Indicator MT4
Thunder Investment Group Limited
Property of Vertical Capital Edition:  Gugol_Quants   About USA INDEXES QUANT_INDICATOR: This is a indicator created by math modulation to be used as a trading tool, which was developed in MQL. (MT4) This indicator is for use only with US500(S&P500), NAS100(Nasdaq Composite) and US30(Dow Jones). Signals are activated on "Open" Candle. It’s based on Intraday/Swing Trades whose main timeframe is H1, H2, H3 and H4. However you can use it with other assets by testing with the appropriate settings. *
FREE
Pro Trader mt4
Natasha Diedericks
This indicator takes input from the RSI and a trend filter, and presents the output in a separate indicator window as a histogram. Great for scalping. Settings: No need to set up the indicator. Features Alerts. How to use: Simply attach to any chart Zoom chart in to get a better view of the histo color. Buy:  Blue histo color on multiple timeframes. (e.g,. M30-H1-H4) Sell: Red histo color  across on multiple timeframes. Or backtest and use as you see fit for your strategy. Best results on Majo
Rung
Iurii Tokman
Trend indicator. The indicator identifies the major price movement trends and market them with different colors. It filters out and ignores the noise and short-term movements of the price against the main trend. This indicator is a tool that identifies the current trend in the market. With the default settings, the ascending ("bullish") trends are marked with green lines and the descending ("bearish") trends are marked with red lines. The indicator ignored sideways or flat movements, when the pr
FREE
BBandsEx
Andrej Nikitin
Advanced Bollinger Bands (BB) indicator. The standard Bands.mq4 indicator was complemented with a range of upper/lower band and signal of possible reverses. Parameters: BandsPeriod - indicator period. BandsRange - period of determining a range. BandsDeviations - number of standard deviations. Averaging Fast Period - fast period of averaging. Averaging Slow Period - slow period of averaging. Buffer indexes: 0 - Middle line, 1 - Upper line, 2 - Lower line, 3 - Upper range, 4 - Lower range, 5
Summary This indicator is based on RSI and Momentum indicators. It also considers moving averages of these two indicators. The three indicators have adjustable settings. The arrows do not repaint since the indicator only uses confirmed values and waits for the candle to close before painting an arrow. The indicator is also able to alert when arrows appear. There are 3 types of alerts - Popup, Email and Mobile Push Notifications. The arrows can be used in the EA and the inputs can also be optimiz
FREE
RSI Divergence Scanner
Reza Aghajanpour
4.5 (14)
** All Symbols x All Timeframes scan just by pressing scanner button ** ***Contact me after purchase to send you instructions and add you in "RSI scanner group" for sharing or seeing experiences with other users. Introduction RSI divergence is a main technique used to determine trend reversing when it’s time to sell or buy because prices are likely to drop or pick in the charts. The RSI Divergence indicator can help you locate the top and bottom of the market. This indicator finds Regular div
Description Keltner's colored channel indicator,also called STARC band, drawn in the main chart window. The indicator uses the calculation technique of the three drawing options: basic, improved and modified . The first two were proposed by Keltner, the third one - by a successful trader L. Rakshe. You can also search for your own best parameters of the indicator. The upper, middle and lower bands can be colored. The indicator includes the basic analytical tool of the market moods by Keltner. Th
SFO Trend Racer
Tevin Marshall
5 (1)
SFO Trend Racer system is a trend indicator created by the CEO and Founder of " Simple Forex Options ", Tevin Marshall . It serves 6 different functions all in one. It shows the trader the entry signals as well as exit signals, whether it is a take profit or a stop loss. It also uses trend filters and signal confirmations so that the trader is able to make the most logically fit decision. Trend Racer uses various filters and specific settings from a plethora of indicators. The beauty in this ind
Precision Pivot Points Yuri Congia Description: Precision Pivot Points is a sophisticated indicator designed to identify potential market reversal points with accuracy and precision. Utilizing advanced algorithms, this indicator automatically calculates key support and resistance levels based on pivot point analysis. Pivot points are essential tools used by traders worldwide to make informed trading decisions and optimize their trading strategies. Join me in the exciting world of financial trad
FREE
OBV Trend mt4
Natasha Diedericks
This indicator takes input from the OBV and a trend filter, and presents the output in a separate indicator window as a histogram. Great for scalping. Settings: TrendPeriod Features Alerts. How to use: Simply attach to any chart with default setting, or set the TrendPeriod to your preference. Zoom chart in to get a better view of the histo color. Buy:  Blue histo color on multiple timeframes. (e.g., M15-M30-H1-H4) Sell: Red histo color  on multiple timeframes. Or backtest and use as you see fi
IVolX 2 DPOC
Denis Chebatarev
Vol 2 DPOC volume vol 2 DOC-dynamic horizontal volume indicator for any time periods Main settings of the indicator: Volume Source -selecting data for volumes (tick or real) DPOCOn -enabling / disabling the indicator DPOCFrom -calculation start date DPOCTo -settlement end date The indicator allows you to manually select areas on the chart to analyze changes in the maximum volume over time. You can do this by using vertical lines and moving them along the chart. Or by setting specific dates
Dragon Trend
Marco Fornero Monia
5 (1)
Trend indicator with Multi-level Take Profit indication. Possibility to setting in normal or Aggressive mode. Fully customizable in color and alarm. Very useful to understand the trend and where price could go No need to explain, see the images. You'll se the trend, 3 possibly target and stop loss (or other take profit) when the trend change. You can adopt various strategy, for example. 1) Open trade and try to close it at target 1 2) Open 2 trade, close 1 at target 1, stop in profit for 2 and t
EMA Separation
Libertas LLC
2.5 (2)
EMA Separation plots 2 exponential moving averages, and a fill between them. The fill is colored differently according to an uptrend (short period EMA above long period EMA), or a downtrend (short period EMA below long period EMA). This is a small tool to help visualize the difference between long and short period averages. We hope you enjoy! EMA Separation can also be paired with our free EMA Separation Coefficient Parameters Short period (Default=10): # bars used to calculate short period EM
FREE
Sarangani Venom
Sherwin Dennis Tava Ruiz
sarangani venom is 100% profitable, easy to use indicator, a chart without indicator is stressful and will lead you to many losses, this indicator is pleasing to the eye that will gives you more confident to trade when there is signal, your computer will gives sound and the spider will animate, it can be used to all time frame and to all currency, you have many options, when the candlestick touches to upper line it is buy, when it touches to lower line it is sell, when the rope is pull to buy ar
Candle close countdown indicator. Almost all indicators work by ticks and therefore stop counting when the price stops in moments of little volatility. This indicator does not stop and remains synchronized with the broker's clock. It also has other functions that can help the trader. All features are configurable and you can choose if you want to use it or not: - Volume control:                         the counter changes color when the current candle has a higher volume of contracts than the pr
Forex Indicator "Trend Correction Histogram" for MT4 Trend Correction Histogram can be in 2 colors: red for bearish trend and blue for bullish one 7 consecutive histogram columns of the same color means beginning of new trend Trend Correction Histogram indicator designed with the main purpose - to minimize losses and maximize profit It has parameter - "Period", responsible for indicator's sensitivity Built-in Mobile and PC alerts  Trend Correction Histogram can be use as a simple but profitable
BeST TEMA
Eleni Koulocheri
Triple Exponential Moving Average ( TEMA ) is a  moving   average (MA) that gives the  most weight to recent price data. TEMA is more reactive to  all price fluctuations than  a Simple Moving Average (SMA) or an Exponential Moving Average (EMA) or even a Double Moving Average (DEMA) and surely can help traders to spot reversals sooner because it responds very fast to any changes in market activity.  TEMA was developed by Patrick Mulloy in an attempt to reduce the amount of lag time found in trad
FREE
Ultimate Trend Trader Indicator
Thibauld Charles Ghislain Robin
Embrace the Power With Ultimate Trend Trader Indicator. Facing the reality of individual traders, we are far from harnessing the capabilities of AI and high-frequency trading algorithms that dominate today's markets. Without access to massive data centers or infrastructure to compete on microseconds, the battle seems skewed. Yet, the true advantage lies not in technological arms but in leveraging human intellect to outsmart the competition. The Ultimate Trend Trader Indicator embodies this appr
https://c.mql5.com/31/761/best-trend-indicator-logo-200x200-8493.png The indicator uses a solid line of red and green to reflect the myriad changes in market prices. The green line indicates a period of rising market prices and the red line indicates a period of falling market prices. Solid line color change indicates that the market has changed and the market is likely to reverse! It is recommended that you use this indicator on your daily K-chart.   This indicator is not suitable for you to do
FATL rsi AM
Andriy Matviyevs'kyy
The product combines the best features of the standard RSI oscillator with the adaptive digital filter. The indicator allows entering and exiting the market at the very beginning and end of a trend. The indicator generates high-probability signals while retaining high sensitivity. The indicator does not repaint on fully formed bars. Options: Ind_Price - price used for the indicator calculation; Ind_Period - indicator period. Application rules: A big red dot - a strong bearish trend, if the price
FREE
Ceiling MT4
Zbigniew Mirowski
The "Ceiling MT4" indicator has been designed to determine the exit point from the market and it is based on a moving average set in parameters and shows 3 lines. 1. Ceiling lines, that is the highest / lowest value currently achieved on the chart in the horizon set in the "Plafon Horyzon" parameter. 2. The "Signal" line that shows the line shifted to the part specified in the "Signal_Part" parameter is set by default to 2, which means that it is halfway between the moving average and the plafon
FREE
Smart trends view
Maria Cristina Sabatini
Clear trend filter   This is a filter-trend indicator.  From the settings you can select to use more filter or less. The very interesting part of the indicator comes out using with all the filter. In this way you can follow the trend easily even when the market is without a strong trend, but is instead more flat. I personally use it on 1 minutue timeframe with  MORE FILTER (you can select it from the input setting) in order to have an overlook of trend in the market.   Added: - Sound Notificatio
Bu ürünün alıcıları ayrıca şunları da satın alıyor
Gann Made Easy
Oleg Rodin
4.88 (96)
Gann Made Easy , bay teorisini kullanarak ticaretin en iyi ilkelerine dayanan, profesyonel ve kullanımı kolay bir Forex ticaret sistemidir. WD Gann. Gösterge, Zararı Durdur ve Kâr Al Seviyeleri dahil olmak üzere doğru SATIN AL ve SAT sinyalleri sağlar. PUSH bildirimlerini kullanarak hareket halindeyken bile işlem yapabilirsiniz. Lütfen satın aldıktan sonra benimle iletişime geçin! Alım satım ipuçlarımı ve harika bonus göstergelerini ücretsiz olarak sizinle paylaşacağım! Muhtemelen Gann ticaret y
Trend Pulse
Mohamed Hassan
5 (4)
Please contact me after purchase to immediately get your PDF strategy + documentation for Trend Pulse !  Official release price of $89  ( 3 /50 copies left). Next price is $199 . Introducing Trend Pulse , a unique and robust indicator capable of detecting bullish, bearish, and even ranging trends! Trend Pulse uses a special algorithm to filter out market noise with real precision. If the current symbol is moving sideways, Trend Pulse will send you a ranging signal, letting you know that it
Scalper Inside PRO
Alexey Minkov
4.75 (60)
An exclusive indicator that utilizes an innovative algorithm to swiftly and accurately determine the market trend. The indicator automatically calculates opening, closing, and profit levels, providing detailed trading statistics. With these features, you can choose the most appropriate trading instrument for the current market conditions. Additionally, you can easily integrate your own arrow indicators into Scalper Inside Pro to quickly evaluate their statistics and profitability. Scalper Inside
Atomic Analyst
Issam Kassas
5 (3)
Öncelikle belirtmek gerekir ki bu Ticaret Göstergesi Yeniden Çizim Yapmaz, Gecikmez ve Gecikme Göstermez, bu da hem manuel hem de robot ticareti için ideal hale getirir. Kullanıcı kılavuzu: ayarlar, girişler ve strateji. Atom Analisti, Piyasada Daha İyi Bir Avantaj Bulmak İçin Fiyatın Gücünü ve Momentumunu Kullanan PA Fiyat Hareketi Göstergesidir. Gürültüleri ve Yanlış Sinyalleri Kaldırmaya ve Ticaret Potansiyelini Artırmaya Yardımcı Olan Gelişmiş Filtrelerle Donatılmıştır. Birden fazla katma
Gold Stuff
Vasiliy Strukov
4.9 (269)
Gold Stuff, özellikle altın için tasarlanmış bir trend göstergesidir ve herhangi bir finansal enstrümanda da kullanılabilir. Gösterge yeniden çizilmez ve gecikmez. Önerilen zaman dilimi H1. Bu göstergede tam otomatik Uzman Danışman EA Gold Stuff çalışır. Profilimde bulabilirsiniz. Ayarları ve kişisel bir bonusu almak için satın alma işleminden hemen sonra benimle iletişime geçin!  Güçlü Destek ve Trend Tarayıcı göstergemizin ücretsiz bir kopyasını pm'den alabilirsiniz. Ben! AYARLAR Ok Ç
Trend Punch
Mohamed Hassan
4.91 (22)
This indicator is unstoppable when combined with our other indicator called  Support & Resistance . After purchase, send us a message and you will get it   for  FREE as a BONUS! Introducing Trend Punch , the revolutionary forex trend indicator that will transform the way you trade! Trend Punch is uniquely designed to provide precise buy and sell arrows during strong market trends, making your trading decisions clearer and more confident. Whether you're trading major currency pairs or exotic sym
ŞU ANDA %26 INDIRIMLI Yeni Başlayanlar veya Uzman Tüccarlar için En İyi Çözüm! Bu Gösterge benzersiz, yüksek kaliteli ve uygun fiyatlı bir ticaret aracıdır çünkü bir dizi tescilli özellik ve yeni bir formül ekledik. Sadece BİR grafik ile 28 Forex çifti için Döviz Gücünü okuyabilirsiniz! Yeni bir trendin veya scalping fırsatının tam tetik noktasını belirleyebildiğiniz için ticaretinizin nasıl gelişeceğini hayal edin? Kullanım kılavuzu: buraya tıklayın Bu ilk olan, orijinal! Değersiz bir
FX Power MT4 NG
Daniel Stein
5 (12)
Sabah Brifingimiz burada mql5 ve on Telegram! FX Power MT4 NG , uzun zamandır çok popüler olan döviz gücü ölçerimiz FX Power'ın yeni neslidir. Peki bu yeni nesil güç ölçer ne sunuyor? Orijinal FX Power hakkında sevdiğiniz her şey PLUS GOLD/XAU güç analizi Daha da hassas hesaplama sonuçları Ayrı ayrı yapılandırılabilir analiz dönemleri Daha da iyi performans için özelleştirilebilir hesaplama limiti Özel çokluDaha fazlasını görmek isteyenler için örnek ayarlar Her grafikte en sevdiğiniz renkler i
Currency Strength Wizard , başarılı ticaret için size hepsi bir arada çözüm sağlayan çok güçlü bir göstergedir. Gösterge, birden çok zaman dilimindeki tüm para birimlerinin verilerini kullanarak şu veya bu forex çiftinin gücünü hesaplar. Bu veriler, şu veya bu para biriminin gücünü görmek için kullanabileceğiniz, kullanımı kolay para birimi endeksi ve para birimi güç hatları biçiminde temsil edilir. İhtiyacınız olan tek şey, işlem yapmak istediğiniz tabloya göstergeyi eklemektir ve gösterge size
ŞU ANDA %31 INDIRIMLI !!! Yeni Başlayanlar veya Uzman Tüccarlar için En İyi Çözüm! Bu gösterge benzersiz, yüksek kaliteli ve uygun fiyatlı bir ticaret aracıdır çünkü bir dizi tescilli özellik ve gizli bir formül ekledik. Yalnızca BİR grafikle 28 döviz çiftinin tümü için Uyarılar verir. Yeni bir trendin veya scalping fırsatının tam tetik noktasını belirleyebildiğiniz için ticaretinizin nasıl gelişeceğini hayal edin! Yeni temel algoritmalar üzerine inşa edilen bu sistem, potansiyel işlemler
Şu anda %20 İNDİRİMLİ! Herhangi bir Acemi veya Uzman Tüccar için En İyi Çözüm! Bu gösterge paneli yazılımı 28 döviz çifti üzerinde çalışıyor. Ana göstergelerimizden 2'sine (Gelişmiş Para Birimi Gücü 28 ve Gelişmiş Para Birimi Dürtüsü) dayanmaktadır. Tüm Forex piyasasına harika bir genel bakış sağlar. Gelişmiş Para Birimi Gücü değerlerini, para birimi hareket hızını ve tüm (9) zaman dilimlerinde 28 Forex çifti için sinyalleri gösterir. Trendleri ve / veya scalping fırsatlarını belirlemek içi
Scalper Vault
Oleg Rodin
5 (29)
Scalper Vault , başarılı bir scalping için ihtiyacınız olan her şeyi size sağlayan profesyonel bir scalping sistemidir. Bu gösterge, forex ve ikili opsiyon tüccarları tarafından kullanılabilecek eksiksiz bir ticaret sistemidir. Önerilen zaman çerçevesi M5'tir. Sistem size trend yönünde doğru ok sinyalleri sağlar. Ayrıca size üst ve alt sinyaller ve Gann piyasa seviyeleri sağlar. Göstergeler, PUSH bildirimleri dahil her türlü uyarıyı sağlar. Göstergeyi satın aldıktan sonra lütfen benimle iletişim
Öncelikle, bu Ticaret Aracının Non-Repainting, Non-Redrawing ve Non-Lagging Gösterge olduğunu vurgulamakta fayda var, bu da onu profesyonel ticaret için ideal hale getiriyor. Çevrimiçi kurs, kullanıcı kılavuzu ve demo. Akıllı Fiyat Hareketi Kavramları Göstergesi, hem yeni hem de deneyimli tüccarlar için çok güçlü bir araçtır. İleri ticaret fikirlerini, Inner Circle Trader Analizi ve Smart Money Concepts Ticaret Stratejileri gibi 20'den fazla kullanışlı göstergeyi bir araya getirerek bir araya g
Order Block Hunter
Noha Mohamed Fathy Younes Badr
5 (1)
Order block hunter indicator is the best indicator for  hunt the order blocks that area where there has been a large concentration of limit orders waiting to be executed Order blocks are identified on a chart by observing previous price action and looking for areas where the price experienced significant movement or sudden changes in direction .This indicator does that for you by using very complicated codes and helps you to take the best areas To buy and sell because it make marks at the best a
Enigmera
Ivan Stefanov
5 (4)
ENIGMERA: Pazarın çekirdeği https://www.enigmera.com Giriş Bu gösterge ve ticaret sistemi, finansal piyasalar için dikkate değer bir yaklaşımdır. ENIGMERA, destek ve direnç seviyelerini doğru bir şekilde hesaplamak için fraktal döngüleri kullanır. Gerçek birikim aşamasını gösterir ve yön ve hedefler verir.  İster bir trendde ister bir düzeltmede olalım çalışan bir sistem.  Nasıl çalışır? ENIGMERA üç çizgiden oluşur: destek/direnç çizgisi, hedef çizgisi ve sapma çizgisi. Sistem, geçmiş veril
- Real price is 80$ - 50% Discount ( It is 39$ now ) Contact me for instruction, any questions! Introduction The breakout and retest strategy is traded support and resistance levels. it involves price breaking through a previous level.  The break and retest strategy is designed to help traders do two main things, the first is to avoid false breakouts. Many false breakouts start with a candlestick that breaks out of a level but ends with an immediate candlestick that brings the price back into t
Trend Screener
STE S.S.COMPANY
4.82 (93)
Trend Göstergesi, Trend Alım Satım ve Filtreleme için Çığır Açan Benzersiz Çözüm, Tüm Önemli Trend Özellikleriyle Tek Bir Araç İçinde Yerleştirildi! Forex, emtialar, kripto para birimleri, endeksler ve hisse senetleri gibi tüm sembollerde/araçlarda kullanılabilen %100 yeniden boyamayan çoklu zaman çerçevesi ve Çoklu para birimi göstergesidir. Trend Screener, grafikte noktalarla ok trend sinyalleri sağlayan etkili bir trend trend göstergesidir. Trend analizörü göstergesinde bulunan özellikler: 1.
Gold Channel is a volatility-based indicator, developed with a specific timing algorithm for the XAUUSD pair, which consists of finding possible corrections in the market. This indicator shows two outer lines, an inner line (retracement line) and an arrow sign, where the theory of the channel is to help identify overbought and oversold conditions in the market. The market price will generally fall between the boundaries of the channel. If prices touch or move outside the channel it is a tra
Özel MT4 göstergemizle başarılı forex ticaretinin sırrını keşfedin! Forex piyasasında nasıl başarıya ulaşacağınızı hiç merak ettiniz, riski en aza indirirken sürekli olarak kar kazandınız mı? İşte aradığınız cevap! Ticaret yaklaşımınızda devrim yaratacak tescilli MT4 göstergimizi tanıtmamıza izin verin. Benzersiz çok yönlülük Göstergemiz, Renko ve RangeBar Mum oluşumlarını tercih eden kullanıcılar için özel olarak tasarlanmıştır. Bu grafik türlerinin birçok deneyimli tüccar tarafından ter
Automated Trendlines
Georgios Kalomoiropoulos
5 (17)
Trend çizgileri, forex ticaretinde en önemli teknik analiz aracıdır. Ne yazık ki, çoğu tüccar onları doğru şekilde çizmez. Otomatik Trend Çizgileri göstergesi, piyasaların trend hareketini görselleştirmenize yardımcı olan ciddi tüccarlar için profesyonel bir araçtır. İki tür Trend Çizgisi, Boğa Trend Çizgisi ve Ayı Trend Çizgisi vardır. Yükseliş trendinde, Forex trend çizgisi, fiyat hareketinin en düşük salınım noktalarından geçer. En az iki "en düşük düşük"ü birleştirmek, bir trend çiz
Advanced Supply Demand
Bernhard Schweigert
4.9 (314)
CURRENTLY 26% OFF !! Best Solution for any Newbie or Expert Trader! This indicator is a unique, high quality and affordable trading tool because we have incorporated a number of proprietary features and a new formula. With this update, you will be able to show double timeframe zones. You will not only be able to show a higher TF but to show both, the chart TF, PLUS the higher TF: SHOWING NESTED ZONES. All Supply Demand traders will love it. :) Important Information Revealed Maximize the potenti
ÜRÜNÜ SATIN ALMADAN ÖNCE LÜTFEN AŞAĞIDAKİ BİLGİLERİ OKUYUNUZ! Apollo Pips PLUS SP benzersiz bir üründür! YENİ "APOLLO PIPS" GÖSTERGEMİ ARTI TÜM İŞLEM GÖSTERGELERİME ERİŞİM İLE "SÜPER PAKET" BONUSUNU ALMAK İSTEYENLER İÇİN! Apollo Pips PLUS SP ürününü satın alarak aslında Apollo Pips göstergemin tamamen yeni bir versiyonunu satın almış oluyorsunuz. Göstergenin bu sürümü, geliştirilmiş bir algoritmaya ve kullanımı kolay bir parametreye sahiptir; bu, size göstergeyi herhangi bir piyasada ve herhangi
PZ Day Trading
PZ TRADING SLU
3.67 (3)
Effortless trading: non-repainting indicator for accurate price reversals Special Offer: Purchase now to receive free bonuses worth $189! (Read more for details) This indicator detects price reversals in a zig-zag fashion, using only price action analysis and a donchian channel. It has been specifically designed for short-term trading, without repainting or backpainting at all. It is a fantastic tool for shrewd traders aiming to increase the timing of their operations. [ Installation Guide | Up
AW Trend Predictor
AW Trading Software Limited
4.74 (39)
Tek bir sistemde trend ve arıza seviyelerinin kombinasyonu. Gelişmiş bir gösterge algoritması piyasa gürültüsünü filtreler, trendi, giriş noktalarını ve olası çıkış seviyelerini belirler. Gösterge sinyalleri, sinyal geçmişinin etkinliğini gösteren en uygun araçları seçmenize izin veren istatistiksel bir modüle kaydedilir. Gösterge Kâr Al ve Zararı Durdur işaretlerini hesaplar. Kılavuz ve talimat ->   Burada   / MT5 versiyonu ->   Burada Gösterge ile nasıl ticaret yapılır: Trend Predictor ile iş
IX Power MT4
Daniel Stein
5 (6)
IX Power nihayet FX Power'ın rakipsiz hassasiyetini Forex dışı sembollere getiriyor. En sevdiğiniz endeksler, hisse senetleri, emtialar, ETF'ler ve hatta kripto para birimlerindeki kısa, orta ve uzun vadeli eğilimlerin yoğunluğunu doğru bir şekilde belirler. Terminalinizin sunduğu her şeyi analiz edebilirsiniz. Deneyin ve işlem yaparken zamanlamanızın nasıl önemli ölçüde iyileştiğini deneyimleyin. IX Power Temel Özellikler 100 hassas, yeniden boyanmayan hesaplama sonuçları - terminalini
M1 Arrow
Oleg Rodin
4.73 (15)
Piyasanın iki temel ilkesine dayanan bir gün içi stratejisi. Algoritma, ek filtreler kullanarak hacimlerin ve fiyat dalgalarının analizine dayanmaktadır. Göstergenin akıllı algoritması, yalnızca iki piyasa faktörü bir araya geldiğinde bir sinyal verir. Gösterge, daha yüksek zaman çerçevesinin verilerini kullanarak M1 grafiğinde belirli bir aralıktaki dalgaları hesaplar. Ve dalgayı doğrulamak için gösterge, hacme göre analizi kullanır. Bu gösterge hazır bir ticaret sistemidir. Bir tüccarın ihtiya
Break and Retest
Mohamed Hassan
4.12 (17)
This Indicator only places quality trades when the market is really in your favor with a clear break and retest. Patience is key with this price action strategy! If you want more alert signals per day, you increase the number next to the parameter called: Support & Resistance Sensitivity.  After many months of hard work and dedication, we are extremely proud to present you our  Break and Retest price action indicator created from scratch. One of the most complex indicators that we made with ove
TPSpro RFI Levels
Roman Podpora
4.83 (24)
Reversal First Impulse levels (RFI)    INSTRUCTIONS        RUS       -       ENG              R ecommended to use with an indicator   -   TPSpro  TREND PRO -  Version MT5 A key element in trading is zones or levels from which decisions to buy or sell a trading instrument are made. Despite attempts by major players to conceal their presence in the market, they inevitably leave traces. Our task was to learn how to identify these traces and interpret them correctly. Main functions: Displaying activ
PZ Mean Reversion MT4
PZ TRADING SLU
2.33 (3)
Ortalama geri dönüş ticareti için profesyonel ve nicel bir yaklaşım uygulayan benzersiz gösterge. Fiyatın tahmin edilebilir ve ölçülebilir bir şekilde ortalamaya döndüğü ve yön değiştirdiği gerçeğinden yararlanır, bu da nicel olmayan ticaret stratejilerinden büyük ölçüde daha iyi performans gösteren net giriş ve çıkış kurallarına izin verir. [ Installation Guide | Update Guide | Troubleshooting | FAQ | All Products ] Ticaret sinyallerini temizle Ticaret yapmak inanılmaz derecede kolay Özelleş
GOLD Impulse with Alert
Bernhard Schweigert
4.56 (9)
Bu gösterge, 2 ürünümüz Advanced Currency IMPULSE with ALERT  +   Currency Strength Exotics  'in süper bir kombinasyonudur. Tüm zaman dilimleri için çalışır ve 8 ana para birimi artı bir Sembol için grafiksel olarak güç veya zayıflık dürtüsünü gösterir! Bu Gösterge, Altın, Egzotik Çiftler, Emtialar, Endeksler veya Vadeli İşlemler gibi herhangi bir sembol için para birimi gücü ivmesini göstermek için uzmanlaşmıştır. Türünün ilk örneğidir, Altın, Gümüş, Petrol, DAX, US30, MXN, TRY, CNH vb.
Yazarın diğer ürünleri
Enigmera
Ivan Stefanov
5 (4)
ENIGMERA: Pazarın çekirdeği https://www.enigmera.com Giriş Bu gösterge ve ticaret sistemi, finansal piyasalar için dikkate değer bir yaklaşımdır. ENIGMERA, destek ve direnç seviyelerini doğru bir şekilde hesaplamak için fraktal döngüleri kullanır. Gerçek birikim aşamasını gösterir ve yön ve hedefler verir.  İster bir trendde ister bir düzeltmede olalım çalışan bir sistem.  Nasıl çalışır? ENIGMERA üç çizgiden oluşur: destek/direnç çizgisi, hedef çizgisi ve sapma çizgisi. Sistem, geçmiş veril
İŞLEM HIZI, piyasada büyük emirlerin nerede ve ne zaman biriktiğini ve bunun faydalarını gösteren en kaliteli göstergedir. Trend değişikliklerini çok erken aşamada tespit eder. Aynı anda hem bir gösterge hem de bir ticaret sistemidir. Konsept benzersiz ve inanılmaz derecede karlı. Forex'te tik hacmi oldukça yanıltıcı bir şekilde hacim olarak adlandırılır. Aslında, fiilen İŞLEM HIZI olan birim zaman başına fiyat değişimidir. Bu gösterge, Forex'teki hacim fikrini mantıksal olarak doğru şekilde
Levelss
Ivan Stefanov
LEVELSS göstergesi gösterir: - Günlük yükseliş ve düşüş bölgesi. Her gün 00:00 ile 23:59 arasında görülebilir.  - Haftalık yükseliş ve düşüş bölgesi. Her hafta Pazartesi 0:00'dan Cuma 23:59'a kadar görülebilir. - Diğer tüm zaman dilimlerinde görüntülenen belirli bir zaman diliminden özel olarak hesaplanan kanal. Varsayılan olarak, bu, işlem yapmak istediğiniz diğer zaman dilimine değiştirebileceğiniz 4 saatlik zaman dilimidir. Kesintisiz olarak hesaplanır. Ekranın sol üst köşesinde, bölgele
Two Snakes
Ivan Stefanov
5 (1)
2 SNAKES birinci sınıf bir scalping sistemidir. Girişler oldukça hassas olduğundan, bu sisteme çok hızlı bir şekilde bağımlı hale gelmeniz muhtemeldir.  2 yılanınız var. Üstlerinde veya altlarında onlara dokunmayan bir mum gördüğünüzde - bu sizin scalping sinyalinizdir. Daha büyük bir zaman çerçevesi kullanırsanız, scalping takip eden trend haline gelebilir. Yılanlar, piyasanın mevcut durumuna göre tam olarak hesaplanır. Hareketli ortalamalar DEĞİLDİR.  Pozisyonunuzu ne kadar süre t
Bu gösterge pratik deneyimlere dayanmaktadır.  En üst/en alt seviyenizin tarihini/saatini girin. Üstten/alttan mevcut ana kadar en çok ziyaret edilen seviyeyi hesaplar. Her yeni mumla otomatik olarak güncellenir. Farklı trendler ve zaman dilimleri için aynı anda birden fazla gösterge kullanabilirsiniz. Uzunluk her zaman döneminizin başlangıcından günümüze kadar çizilir. Yararlı PRO aracı.
Ticaret dünyasında, 45 derecelik bir açıyı takip eden bir trendin sürdürülebilir olduğu kabul edilir.  Bununla birlikte, bu kritik açıyı doğru bir şekilde ölçmek, açıklanan net bir yöntem olmadığı için bir zorluk olmaya devam etmektedir. Yatırımcılar yalnızca nasıl hesaplandığını, kaç mum sayımı olması gerektiğini ve uygun grafik yakınlaştırmasının ne olduğunu tahmin edebilir. Bu sorunu çözdük ve tüm koşulları mantıksal olarak tanımladık ve şimdi size Trend Açısı 45'i sunuyoruz. Destek, hedef
Piyasa önemli bir tepe veya dip yaptıktan sonra bir düzeltmeye girer ve adil değerini bulur. Gösterge otomatik olarak hesaplanır: Adil değer seviyesi Düzeltme kanalı Adil değerden düzeltme kanalı sınırlarına pip cinsinden mesafe İlk adil değer seviyesi mumundan başlayan ve zaman içinde genişleyen sinüs dalgası, bir kırılmadan önce beklenen maksimum ayar genişleme seviyelerini gösterir. Sinüs dalgasının kırılmasını yönlü bir hareket izler. Eğer bir kırılma olmazsa, bu destek/direnç olarak gö
Filtrele:
İnceleme yok
İncelemeye yanıt