Market Heartbeats MT5
- Göstergeler
- Reza Aghajanpour
- Sürüm: 1.4
- Etkinleştirmeler: 10
Market Heartbeat is in your hand!
Introduction
The Market Heartbeat indicator with a special enhanced algorithm (volume, money flow, cycle of market and a secret value) is a very repetitive trend finder with a high success rate. Interestingly, this Winner indicator indicates that the trend has changed its direction or the end of a trend retracement or even appears at the range market.
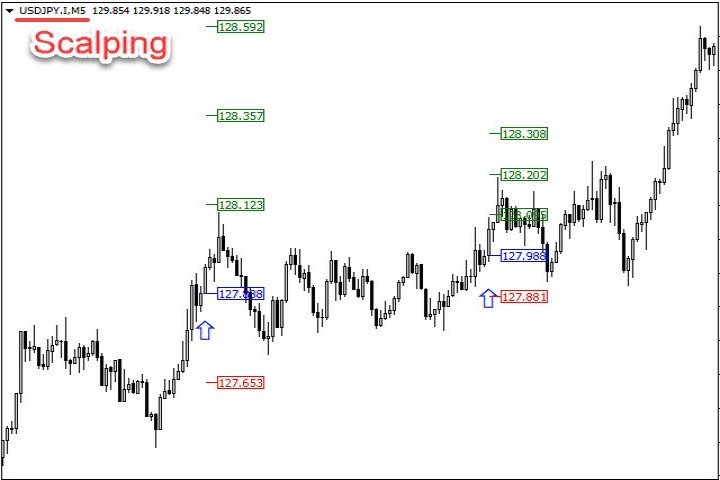
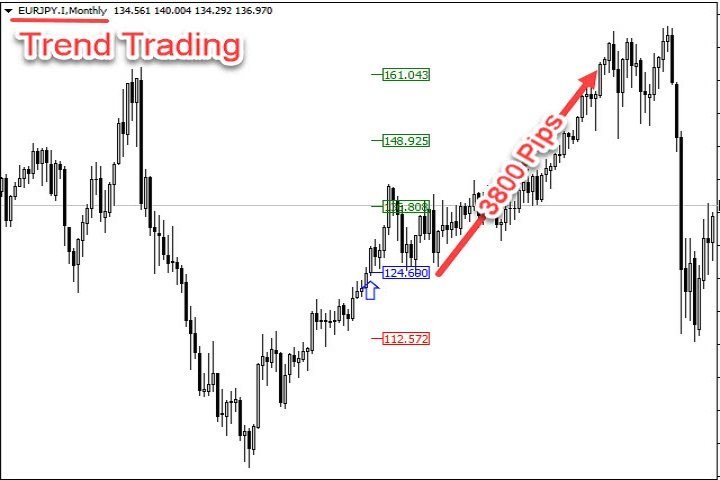
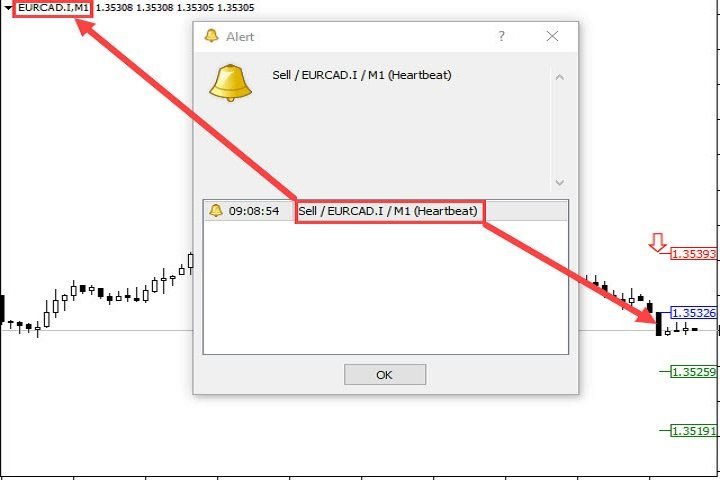
The Market Heartbeat can use in scalping trading or trend trading. It finds immediately with alarm, notification and also It has stop loss, take profits and entry point with candlestick checking for easy trading.
Main Features
- Use special enhanced algorithm (volume, money flow, cycle of market and a secret value)
- Detect the best and most successful signal with very repetitive in trend, swing and breakout.
- Easy-to-use and user-friendly indicator
- NO repaint
- All charts ( Forex, Crypto, Indices and commodities)
- Use in scalping & trend trading
- Candlestick check for the best entry point
- Sending the alert and push notification with stop-loss, entry-point and take-profit levels
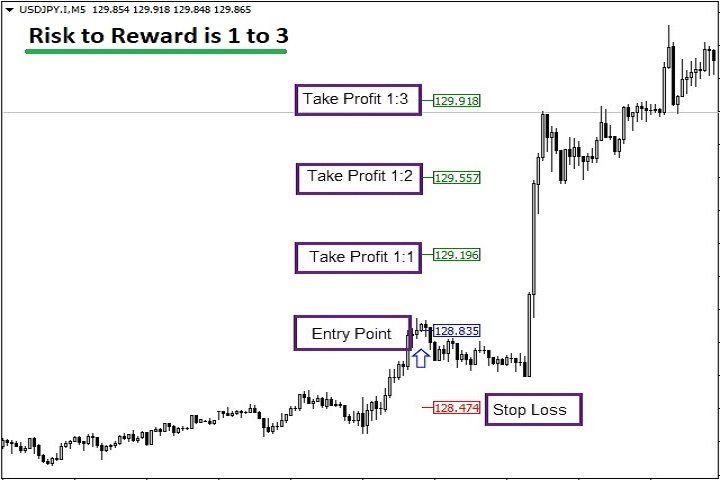
- Risk to reward is 1:3
- Alert enable/disable base on your setting time
- Adjust the pattern setting
Input Parameters
======== Run State ===============- Run Full version="All"
=======Pattern Feature============
- Pip Sensitive Higher timeframes = Use in Heartbeat algorithm in higher timeframes(H4 and higher)
- Pip Sensitive Lower timeframes = Use in Heartbeat algorithm in lower timeframes(H1 and lower)
- Pip Sensitive Higher timeframes SL = Use to calculate stop loss in higher timeframes(H4 and higher)
- Pip Sensitive Lower timeframes SL = Use to calculate stop loss in lower timeframes(H1 and lower)
- Heartbeat Sensitive(0-100) = A secret value to calculate algorithm (Recommended value: 22 - 25)
=======Display/style Options============
- Display Options = Display or do not display TP & SL levels
- Stop Loss/Take Profit levels = Set the Fonts and colors of patterns
========ALERT SETTINGS ==========
- Display Alert or Push Notification = Enable or disable Alert or Push Notification
- Alert start/end time = Determine trading hours based on the computer clock to activate and deactivate the alarm