• Genel bakış
  • İncelemeler
  • Yorumlar

MultiSymbol and TF Chart Integrated

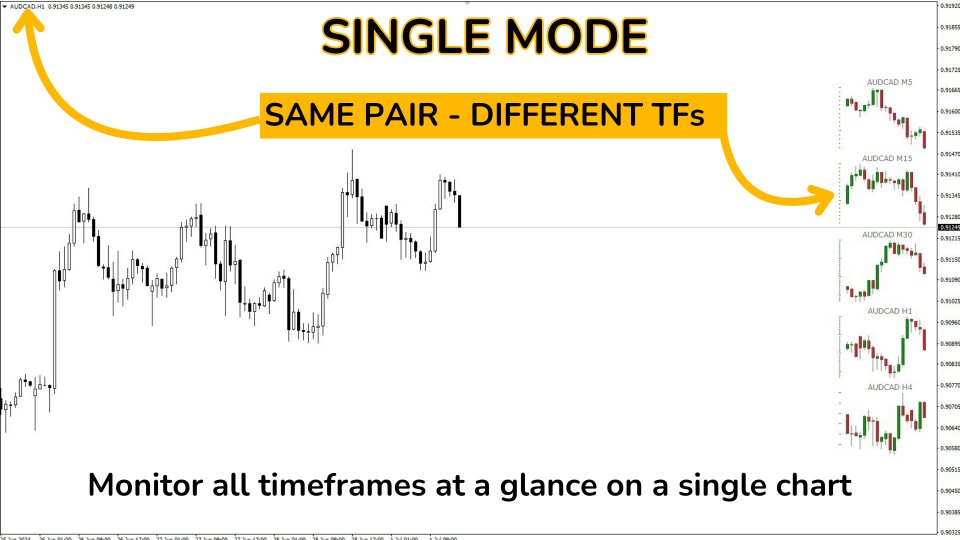
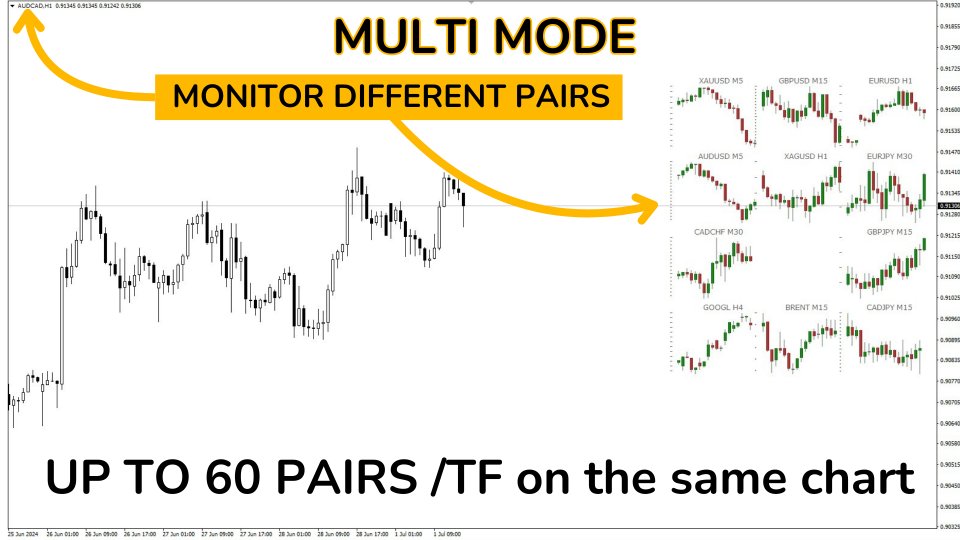
"MultiSymbol & TF Chart Integrated" göstergesi, tek bir grafikte (çoklu mod) tercih ettiğiniz zaman dilimlerinde 60'a kadar döviz çiftini izleyebilmenizi veya işlem yaptığınız çifti tüm TF'lerde görüntüleyebilmenizi (basit mod) sağlayarak piyasaya hızlı ve kapsamlı bir bakış sunmak üzere tasarlanmıştır.

Ana Avantajlar:

Tam İzleme: Tek bir grafikte tüm istenen çiftleri bir bakışta gerçek zamanlı olarak izlemeye olanak tanır.
Zaman Tasarrufu: Grafikler arasında geçiş yapma ihtiyacını ortadan kaldırır, her çiftin davranışını gerçek zamanlı olarak görür.
Trend Analizi: Trend takip eden trader'lar için mükemmeldir, karar vermeden önce trendleri doğrulamak için daha yüksek zaman dilimlerini görmenizi sağlar.
Aşırı Özelleştirme: Göstergenin her yönünü belirli ihtiyaçlarınıza göre ayarlayın.

Aşırı Özelleştirme:

Son Derece Yapılandırılabilir Gösterge Parametreleri:
Semboller ve Zaman Dilimleri:

  • 60'a kadar farklı sembol yapılandırmanıza olanak tanır.
  • Her sembol kendi zaman dilimine sahip olabilir (örneğin, M1, M5, M15, M30, H1, H4, D1, W1, MN1).

Görünüm Modu:

  • Basit Mod: Belirli bir zaman dilimi ile tek bir grafik yapılandırın.
  • Çoklu Mod: Farklı semboller ve zaman dilimlerine sahip birden fazla grafik yapılandırın.

Renk Yapılandırması:

  • Boğa ve ayı mumları için özelleştirilebilir renkler.
  • Mum fitillerinin renkleri.
  • Fiyat ölçeğinin rengi.

Ölçeklendirme ve Konumlandırma:

  • Fiyat aralığı ve ATR'ye dayalı grafiklerin otomatik ölçeklendirilmesi.
  • Piksel parametrelerini kullanarak grafiklerin konumlandırılması.
  • Grafik düzeni için satır ve sütun sayısı.
  • Sütunlar ve satırlar arasındaki boşluk.
  • Grafik penceresindeki başlangıç konumu (X, Y).
  • Piksel cinsinden grafik boyutu (genişlik ve yükseklik).

Yazı Tipi Yapılandırması:

  • Başlıklar ve etiketler için yazı tipi adı ve boyutu.
  • Başlıklar için yazı tipi rengi.

Bar Yapılandırması:

  • Her grafikte gösterilecek bar sayısı.
  • Barlar arasındaki piksel mesafesi.

"MultiSymbol & TF Chart Integrated" göstergesi, tüm istenen çiftlere hızlıca göz atarak ve stratejinize en uygun olanı işlem yaparak zamanını en üst düzeye çıkarmak isteyen her trader için vazgeçilmez bir araçtır. Yüksek özelleştirilebilirliği ve kullanım kolaylığı, her seviyedeki trader için ideal bir seçim yapar.

Belirli ihtiyaçlarınıza göre parametreleri ayarlamak için kılavuzu kullanın:

Gösterge'nin Dış Parametrelerinin Ayrıntılı Açıklaması:
Basit Mod
Heading_SingleMode: ## Basit Mod Parametreleri ##

Açıklama: Basit mod parametreleri için başlık (tek grafik).

Comment_TimeFrame: - MN1,W1,D1,H4,H1,M30,M15,vs -

Açıklama: Geçerli zaman dilimlerini belirten yorum.

TimeFrame: H4

Açıklama: Basit modda grafik için zaman dilimini tanımlar. MN1 (aylık), W1 (haftalık), D1 (günlük), H4 (4 saat) gibi değerleri kullanabilirsiniz.

Comment_Corner: - TopLeft=0,TR=1,BL=2,BR=3 -

Açıklama: Penceredeki grafik pozisyonu değerlerini açıklayan yorum.

Corner: 1

Açıklama: Grafiğin pencerede yerleştirileceği köşeyi tanımlar. Olası değerler: 0 (sol üst köşe), 1 (sağ üst köşe), 2 (sol alt köşe), 3 (sağ alt köşe).

Çoklu Mod
Heading_ChartParam: ## Grafik Parametreleri ##

Açıklama: Çoklu mod parametreleri için başlık (birden fazla grafik).

MultiMode: true

Açıklama: Çoklu modu etkinleştirir (true) veya devre dışı bırakır (false).

CandleMode: false

Açıklama: Mumların (true) veya barların (false) gösterilip gösterilmeyeceğini tanımlar.

BarsToDisplay: 18

Açıklama: Her grafikte gösterilecek bar veya mum sayısı.

AutoScale: true

Açıklama: Fiyat aralığı ve ATR'ye (Ortalama Gerçek Aralık) dayalı grafiklerin otomatik ölçeklendirilmesini etkinleştirir (true) veya devre dışı bırakır (false).

ATRBars: 20

Açıklama: ATR hesaplaması için dikkate alınacak bar sayısı.

ATRPixelsY: 30

Açıklama: Ölçeklendirme için ATR'ye atanan dikey piksel sayısı.

Renk Yapılandırması
WickColor: DimGray

Açıklama: Mum fitillerinin rengi.

BullBarColor: Green

Açıklama: Boğa mumlarının veya barlarının rengi.

BearBarColor: FireBrick

Açıklama: Ayı mumlarının veya barlarının rengi.

ScaleColor: DimGray

Açıklama: Fiyat ölçeğinin rengi.

Konumlandırma
Comment_Positioning: - Piksel cinsinden konumlandırma -

Açıklama: Aşağıdaki parametrelerin piksel cinsinden konumlandırma için olduğunu belirten yorum.

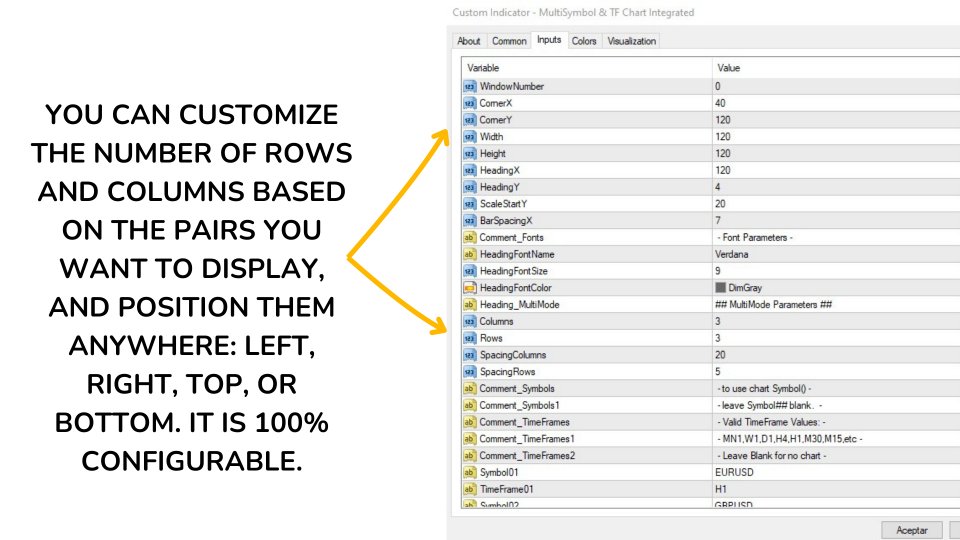
WindowNumber: 0

Açıklama: Grafiğin görüntüleneceği pencere numarası. Genellikle, 0 ana penceredir.

CornerX: 40

Açıklama: Piksel cinsinden grafiğin başlangıç X konumu.

CornerY: 120

Açıklama: Piksel cinsinden grafiğin başlangıç Y konumu.

Width: 120

Açıklama: Piksel cinsinden grafiğin genişliği.

Height: 120

Açıklama: Piksel cinsinden grafiğin yüksekliği.

Yazı Tipi Yapılandırması
HeadingFontName: Verdana

Açıklama: Başlıklar ve etiketler için kullanılan yazı tipi adı.

HeadingFontSize: 9

Açıklama: Başlıklar ve etiketler için yazı tipi boyutu.

HeadingFontColor: DimGray

Açıklama: Başlıklar için yazı tipi rengi.

Çoklu Mod Yapılandırması

Heading_MultiMode: ## Çoklu Mod Parametreleri ##

Açıklama: Çoklu modun belirli parametreleri için başlık.

Columns: 3

Açıklama: Grafikler için sütun sayısı.

Rows: 3

Açıklama: Grafikler için satır sayısı.

SpacingColumns: 20

Açıklama: Grafik sütunları arasındaki piksel boşluğu.

SpacingRows: 5

Açıklama: Grafik satırları arasındaki piksel boşluğu.

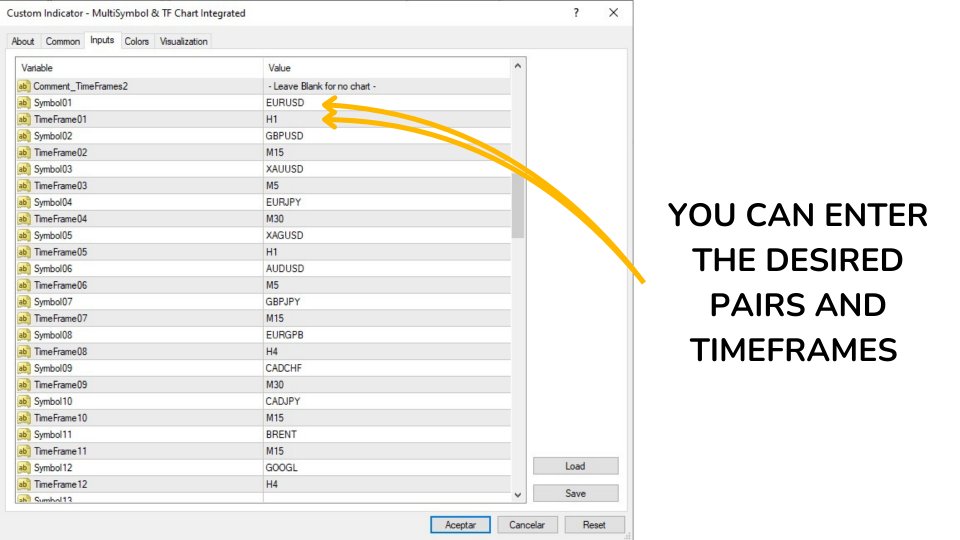
Semboller ve Zaman Dilimleri (toplam 60)
Symbol01: EURUSD

Açıklama: İlk grafik için sembol. 60'a kadar farklı sembol yapılandırabilirsiniz.

TimeFrame01: H1

Açıklama: İlk grafik için zaman dilimi. Her sembol kendi zaman dilimine sahip olabilir.

Bu parametreler Symbol60 ve TimeFrame60'a kadar tekrar edilir, varsayılan olarak boş kalır ve her trader ihtiyaçlarına göre yapılandırabilir.

"MultiSymbol & TF Chart Integrated" göstergesi son derece yapılandırılabilir ve trader'ların tek bir grafikte birden fazla sembol ve zaman diliminin görünümünü tamamen özelleştirmesine olanak tanır, teknik analizi kolaylaştırır ve karar verme verimliliğini artırır.

Önerilen ürünler
Gold Venamax   - bu en iyi hisse senedi teknik göstergesidir. Gösterge algoritması bir varlığın fiyat hareketini analiz eder ve oynaklığı ve potansiyel giriş bölgelerini yansıtır. Gösterge özellikleri: Bu, rahat ve karlı ticaret için Magic ve iki Blok trend oku içeren süper bir göstergedir. Grafikte blokları değiştirmek için Kırmızı Düğme görüntülenir. Magic, gösterge ayarlarında ayarlanır, böylece göstergeyi farklı Blokları görüntüleyen iki grafiğe yükleyebilirsiniz. Gold Venamax farklı ok
Gösterge, üç dönemlik bir semafor ve ekstremumdan 123 ters dönüş formasyonu oluşturur. Sinyal ikinci mumun açılışında gelir. Bu formasyon farklı şekillerde alınıp satılabilir (test noktası 3, kırılma ve diğerleri). Kanaldan çıkış veya trend çizgisinin kırılması, bir giriş noktası bulmak için ana tetikleyicidir. Simgeler Fibonacci seviyelerine göre renklendirilmiştir. Sarı simgeler, sinyalin güçlendirildiği bir seviyenin test edildiğini gösterir. Çoklu para birimi kontrol panelini kullanarak 123
Very Accurate Market Trend Indicator! Advantages easy, nice visual and effective trend detection given Always opportunities works on all pairs Forex, Crypto, Commodities, Stocks, Indicies works on all timeframes, but higher TF 1-4Hr is more effective !!!! WARNING !!!! This is trend indicator, it searching for trends in the market! You need patience and you may see loosing trades in a row but that is normal! Do not panick! Once you detect the trends and its confirmed there will be plenty of pi
The Netsrac Correlation Trade Indicator (NCTI) was created to trade correlations between different assets. NCTI offers five different strategies to do this. Five different correlation trading strategies with two or three assets Fast access your assets with one click via asset buttons Your profit/loss at a glance Configurable alerts via screen or mobile You can use the indicator with every timeframe. Higher timeframes give fewer but better signals. If you have some questions or suggestions - ple
RSI Currency Strength Meter uses RSI (Relative Strength Index) to monitor how strong a currency is, or in other words, if it's being bought or sold by the majority compared to the other currencies. It displays the strength-lines of the currencies of the pair (base and counter currency of the chart) with changeable solid lines. Also, you can add up to five additional currencies to the "comparison pool". If you want to look and compare, for example, EUR, USD and JPY, it will only look at the EURUS
Şu anda %20 İNDİRİMLİ! Herhangi bir Acemi veya Uzman Tüccar için En İyi Çözüm! Bu gösterge paneli yazılımı 28 döviz çifti üzerinde çalışıyor. Ana göstergelerimizden 2'sine (Gelişmiş Para Birimi Gücü 28 ve Gelişmiş Para Birimi Dürtüsü) dayanmaktadır. Tüm Forex piyasasına harika bir genel bakış sağlar. Gelişmiş Para Birimi Gücü değerlerini, para birimi hareket hızını ve tüm (9) zaman dilimlerinde 28 Forex çifti için sinyalleri gösterir. Trendleri ve / veya scalping fırsatlarını belirlemek içi
MA Alignment Scanner
Benedict Jamora
5 (1)
This indicator scans and displays currency pairs that have recently aligned moving averages on a given timeframe. You can configure which pairs the indicator will scan. It also includes all types of alert options. Bullish MA Alignment =  MA1>MA2>MA3>MA4>MA5 Bearish MA Alignment =  MA1<MA2<MA3<MA4<MA5 Features Attach to one chart and scans all the currency pairs configured and visible in the Market Watch Window It can monitor all the available timeframes from M1 to MN1 and sends alerts on ever
Market Meeter
Hapu Arachchilage Tharindu Lakmal
Market Meter is designed for explore various trends in current trading symbol.  with Market Meter  you can get a clear idea about the trends running on different time frames of current symbol. This indicator uses separate window to display its data. Every time when a new trend occurred, Indicator shows it with displaying an arrow on related text area. It's very important to identify the trends of higher time frames when you trading lower time frames. Let the Market Meter  to do the work for you.
BinaryPRO- is a multi-currency and multi-timeframe signal indicator, created according to the author's algorithm. It produces high-quality and timely trading signals in the form of arrows on any financial assets traded on Meta Trader 4. It is a good alternative to paid signal services. The indicator can be used with any broker (with 4/5-digit quotes). The received trading signals can and should be used when trading binary options and cryptocurrency. Advantages of BinaryPRO: accurately shows th
Master Scalping M1 , trendi hızlı ve doğru bir şekilde belirlemek için bir algoritma kullanan yenilikçi bir göstergedir. Gösterge, pozisyonların açılış ve kapanış zamanını hesaplar, gösterge algoritmaları, bir ticarete girmek (bir varlık satın almak veya satmak) için ideal anları bulmanızı sağlar, bu da çoğu tüccar için işlemlerin başarısını artırır. Göstergenin faydaları: Kullanımı kolaydır, çizelgeyi gereksiz bilgilerle aşırı yüklemez. Herhangi bir strateji için bir filtre olarak kullanılabili
Forex Gump
Andrey Kozak
2.83 (6)
Forex Gump is a fully finished semi-automatic trading system. In the form of arrows, signals are displayed on the screen for opening and closing deals. All you need is to follow the instructions of the indicator. When the indicator shows a blue arrow, you need to open a buy order. When the indicator shows a red arrow, you need to open a sell order. Close orders when the indicator draws a yellow cross. In order to get the most effective result, we recommend using the timeframes H1, H4, D1. There
Multiple Indicators for Major Currencies The purpose of this indicator is to save time to detect more good trading opportunities by scanning all 28 cross currency pairs of AUD, CAD, CHF, EUR, GBP, JPY, NZD and USD in the same time. There are 5 indicators included in this indicator which are CCI, RSI, Stochastic, MACD and the different between plusDI and minusDI of ADX (PlusDI-MinusDI). The indicator can help in determining the following properties of each currency depending on which indicator
Indicator MTF Qristalium Arrows is a semi - automatic trading system. It works on all currency pairs.  The indicator uses three rules: 1) we trade only on the trend, 2)"buy when everyone sells and sell when everyone buys", 3) the Price always goes against the crowd.  Indicator MTF Arrows Qristalium filter rules across multiple time frames using the built-in indicators. If the trend matches on the selected time intervals, the indicator will give an arrow to enter the market. Then you mak
Blahtech Market Profile
Blahtech Limited
4.61 (18)
Was: $249  Now: $99   Market Profile defines a number of day types that can help the trader to determine market behaviour. A key feature is the Value Area, representing the range of price action where 70% of trading took place. Understanding the Value Area can give traders valuable insight into market direction and establish the higher odds trade. It is an excellent addition to any system you may be using. Blahtech Limited presents their Market Profile indicator for the MetaTrader community. Ins
Think of the rarest pair you can think of. And I assure you that this indicator can compute it's strength. This Currency Meter will literally calculate any currency pairs, either it is the Major Pairs, Metals, CFD's, Commodities, Crypto Currency like Bitcoin/BTC or Ethereum/ETH and even stocks. Just name it and you will get it! There is no currency pair this Currency Meter can solve. No matter how rare or exotic is that currency, it will always be solved by this Currency meter which on a real-ti
Currency Power Meter
Vu Trung Kien
4.74 (19)
Currency Power Meter shows the power of major currencies against each other. The indicator shows the relative strength of currency/pair at the current moment in a period of time (H4, daily, weekly, monthly). It is useful for day traders, swing traders and position traders with suitable period options. Currency power is the true reason of market trend: The strongest currency against the weakest currency will combine into a most trending pair. As we know, trend makes money and all traders love tre
VR Cub
Vladimir Pastushak
VR Cub , yüksek kaliteli giriş noktaları elde etmenin bir göstergesidir. Gösterge, matematiksel hesaplamaları kolaylaştırmak ve bir pozisyona giriş noktalarının aranmasını basitleştirmek için geliştirildi. Göstergenin yazıldığı ticaret stratejisi uzun yıllardan beri etkinliğini kanıtlamaktadır. Ticaret stratejisinin basitliği, acemi yatırımcıların bile başarılı bir şekilde ticaret yapmasına olanak tanıyan büyük avantajıdır. VR Cub, pozisyon açılış noktalarını ve Kâr Al ve Zararı Durdur hedef sev
Gann Square of 144
Taras Slobodyanik
4.33 (6)
Gann Kutusu (veya Gann Meydanı), W.D. Gann'ın "Piyasa tahminleri için matematiksel formül" makalesine dayanan bir pazar analiz yöntemidir. Bu gösterge üç Kare modelini çizebilir: 90, 52(104), 144. Altı ızgara çeşidi ve iki yay çeşidi vardır. Bir grafik üzerinde aynı anda birden fazla kare çizebilirsiniz. Parametreler Square — kare modelin seçimi : 90 — 90'ın karesi (veya dokuzun karesi); 52 (104) — 52'nin karesi (veya 104); 144 — 144'ün evrensel karesi; 144 (full) — karenin "tam" versiyonu
Cloud Eyes is an advanced moving average alert that   will easily monitor the price action based on set moving averages to multiple open charts.  Objective: To monitor multiple open charts and notify traders conveniently in a single display panel when using the moving averages to enter/exit a trades. Features: Monitor price action in two timeframes at the same time Supports simple, exponential, smoothed, linear weighted moving averages Trigger an alert based on candle size (full/body length) Ca
CCI Currency Strength Meter uses CCI (Commodity Channel Index) to monitor how strong a currency is, or in other words, if it's being bought or sold by the majority compared to the other currencies. If you load this indicator on a chart, it will first display the strength-lines of the currencies (base and counter currency of the chart) with changeable solid lines. Also, you can add up to five additional currencies to the "comparison pool," that already has the base and the profit (counter) curren
Marketfx Profile
Mahmoud Helmy Sedik Mohamed Mansour
A   Market Profile   is an intra-day charting technique (price vertical, time/activity horizontal) devised by J. Peter Steidlmayer, a trader at the   Chicago Board of Trade   (CBOT), ca 1959-1985. Steidlmayer was seeking a way to determine and to evaluate   market value   as it developed in the day time frame. The concept was to display price on a vertical axis against time on the horizontal, and the ensuing graphic generally is a bell shape--fatter at the middle prices, with activity trailing o
Gösterge, tarihsel olanlarla karşılaştırılabilecek güncel teklifler oluşturur ve bu temelde bir fiyat hareketi tahmini yapar. Gösterge, istenen tarihe hızlı navigasyon için bir metin alanına sahiptir. Seçenekler: Sembol - göstergenin göstereceği sembolün seçimi; SymbolPeriod - göstergenin veri alacağı dönemin seçimi; GöstergeRenk - gösterge rengi; Ters - doğru tırnakları tersine çevirir, yanlış - orijinal görünüm; Sonraki, tarihi girebileceğiniz ve 'enter' tuşuna basa
Daily Average Retracement Dashboard is an indicator that allows you to monitor multiple currency pairs at one time. This indicator is mainly for strategies that trade price retracement based on Resistance 3/4 or Support 3/4. After applying this indicator to the chart window, it will hide the chart and display the currency pairs in a table form. There are several data shown on the table that will help trader know when to analyze the currency and do trade using retracement. The indicator will show
This multicurrency indicator is the Lite version of the Cosmic Diviner Reversal Zone Pro indicator. The indicator is based on original formulas for analyzing the volatility and price movement strength. This allows determining the overbought and oversold states of instruments with great flexibility, as well as setting custom levels for opening buy or sell orders when the overbought or oversold values of the instruments reach a user-defined percentage. A huge advantage of Reversal Zone Lite is the
Currency Strength Meter is the easiest way to identify strong and weak currencies. This indicator shows the relative strength of 8 major currencies + Gold: AUD, CAD, CHF, EUR, GBP, JPY, NZD, USD, XAU. Gold symbol can be changed to other symbols like XAG, XAU etc. By default the strength value is normalised to the range from 0 to 100 for RSI algorithm: The value above 60 means strong currency; The value below 40 means weak currency; This indicator needs the data of all 28 major currency pairs
Trendiness Index
Libertas LLC
5 (3)
"The trend is your friend" is one of the best known sayings in investing, because capturing large trendy price movements can be extremely profitable. However, trading with the trend is often easier said than done, because many indicators are based on price reversals not trends. These aren't very effective at identifying trendy periods, or predicting whether trends will continue. We developed the Trendiness Index to help address this problem by indicating the strength and direction of price trend
The Signal Strength Meter is a Multi-Currency, Dual Timeframe Interactive Indicator, which calculates the strength of buy and sell signals, and displays a score for each symbol on a display board. Get a 7-Day Free Trial Version:  Click  Here  (Full Access to The Indicator for 7 Days) Check Video Below For Complete Demonstration, and User Manual here . Key Features: Allows you to see multiple currency signals from one chart Analyses the signals from more than a dozen classic indicators Identi
Fisher Yur4ik Indicator - Unlock Precise Trading Insights Explore a world of precision in trading with the "Fisher Yur4ik Indicator." This advanced tool is designed to provide traders with accurate insights into price trends, allowing for well-informed decisions and enhanced profitability. Basic Details : Indicator Type : Fisher Yur4ik Indicator Key Metrics : Real-time analysis of price trends and potential turning points. Customization : Fully customizable settings to align with your unique tra
The indicator displays the data of the Stochastic oscillator from a higher timeframe on the chart. The main and signal lines are displayed in a separate window. The stepped response is not smoothed. The indicator is useful for practicing "manual" forex trading strategies, which use the data from several screens with different timeframes of a single symbol. The indicator uses the settings that are identical to the standard ones, and a drop-down list for selecting the timeframe. Indicator Parame
PipFinite Razor Scalper
Karlo Wilson Vendiola
4.44 (50)
Pipfinite creates unique, high quality and affordable trading tools. Our tools may or may not work for you, so we strongly suggest to try the Demo Version for MT4 first. Please test the indicator prior to purchasing to determine if it works for you. We want your good reviews, so hurry up and test it for free...we hope you will find it useful. Combo Razor Scalper with Trend Laser Strategy: Scalp in the direction of the trend Watch Video: (Click Here) Features Scalping indicator using a confir
Bu ürünün alıcıları ayrıca şunları da satın alıyor
Atomic Analyst
Issam Kassas
5 (3)
Öncelikle belirtmek gerekir ki bu Ticaret Göstergesi Yeniden Çizim Yapmaz, Gecikmez ve Gecikme Göstermez, bu da hem manuel hem de robot ticareti için ideal hale getirir. Kullanıcı kılavuzu: ayarlar, girişler ve strateji. Atom Analisti, Piyasada Daha İyi Bir Avantaj Bulmak İçin Fiyatın Gücünü ve Momentumunu Kullanan PA Fiyat Hareketi Göstergesidir. Gürültüleri ve Yanlış Sinyalleri Kaldırmaya ve Ticaret Potansiyelini Artırmaya Yardımcı Olan Gelişmiş Filtrelerle Donatılmıştır. Birden fazla katma
ÜRÜNÜ SATIN ALMADAN ÖNCE LÜTFEN AŞAĞIDAKİ BİLGİLERİ OKUYUNUZ! Apollo Pips PLUS SP benzersiz bir üründür! YENİ "APOLLO PIPS" GÖSTERGEMİ ARTI TÜM İŞLEM GÖSTERGELERİME ERİŞİM İLE "SÜPER PAKET" BONUSUNU ALMAK İSTEYENLER İÇİN! Apollo Pips PLUS SP ürününü satın alarak aslında Apollo Pips göstergemin tamamen yeni bir versiyonunu satın almış oluyorsunuz. Göstergenin bu sürümü, geliştirilmiş bir algoritmaya ve kullanımı kolay bir parametreye sahiptir; bu, size göstergeyi herhangi bir piyasada ve herhangi
Gold Channel is a volatility-based indicator, developed with a specific timing algorithm for the XAUUSD pair, which consists of finding possible corrections in the market. This indicator shows two outer lines, an inner line (retracement line) and an arrow sign, where the theory of the channel is to help identify overbought and oversold conditions in the market. The market price will generally fall between the boundaries of the channel. If prices touch or move outside the channel it is a tra
PZ Day Trading
PZ TRADING SLU
3.67 (3)
Effortless trading: non-repainting indicator for accurate price reversals Special Offer: Purchase now to receive free bonuses worth $189! (Read more for details) This indicator detects price reversals in a zig-zag fashion, using only price action analysis and a donchian channel. It has been specifically designed for short-term trading, without repainting or backpainting at all. It is a fantastic tool for shrewd traders aiming to increase the timing of their operations. [ Installation Guide | Up
TPSpro RFI Levels
Roman Podpora
4.83 (24)
Reversal First Impulse levels (RFI)    INSTRUCTIONS        RUS       -       ENG              R ecommended to use with an indicator   -   TPSpro  TREND PRO -  Version MT5 A key element in trading is zones or levels from which decisions to buy or sell a trading instrument are made. Despite attempts by major players to conceal their presence in the market, they inevitably leave traces. Our task was to learn how to identify these traces and interpret them correctly. Main functions: Displaying activ
PZ Mean Reversion MT4
PZ TRADING SLU
2.33 (3)
Ortalama geri dönüş ticareti için profesyonel ve nicel bir yaklaşım uygulayan benzersiz gösterge. Fiyatın tahmin edilebilir ve ölçülebilir bir şekilde ortalamaya döndüğü ve yön değiştirdiği gerçeğinden yararlanır, bu da nicel olmayan ticaret stratejilerinden büyük ölçüde daha iyi performans gösteren net giriş ve çıkış kurallarına izin verir. [ Installation Guide | Update Guide | Troubleshooting | FAQ | All Products ] Ticaret sinyallerini temizle Ticaret yapmak inanılmaz derecede kolay Özelleş
How to use Pair Trading Station Pair Trading Station is recommended for H1 time frame and you can use it for any currency pairs. To generate buy and sell signal, follow few steps below to apply Pair Trading Station to your MetaTrader terminal. When you load Pair Trading Station on your chart, Pair Trading station will assess available historical data in your MetaTrader platforms for each currency pair. On your chart, the amount of historical data available will be displayed for each currency pai
AT Forex Indicator MT4
Marzena Maria Szmit
5 (3)
The AT Forex Indicator MT4 is a sophisticated trading tool designed to provide traders with a comprehensive analysis of multiple currency pairs. This   powerful indicator   simplifies the complex nature of the forex market, making it accessible for both novice and experienced traders. AT Forex Indicator uses   advanced algorithms   to detect trends, patterns and is an essential tool for traders aiming to enhance their forex trading performance. With its robust features, ease of use, and reliabl
Introduction to X3 Chart Pattern Scanner X3 Cherart Pattern Scanner is the non-repainting and non-lagging indicator detecting X3 chart patterns including Harmonic pattern, Elliott Wave pattern, X3 patterns, and Japanese Candlestick patterns. Historical patterns match with signal patterns. Hence, you can readily develop the solid trading strategy in your chart. More importantly, this superb pattern scanner can detect the optimal pattern of its kind. In addition, you can switch on and off individu
This product is based on the methodologies of Gann, his follower Don E. Hall. The Indicator builds a working view grid, which is used to analyze graphics. The Pyrapoint tool, developed by Don Hall, is a grid based on the Pythagorean cube. In his calculations he uses the Gann Square 9 methodology and the relationship between Price and Time. This tool is used to predict changes in trend and overall market actions. More information about the method   HERE
JULY OFFER 80% OFF next price for unlimited version will be 17000$. This is the only time you can get this institutional and professional indicator at this price for unlimited version. Don't dare to miss this. The tool I am about to introduce to you you can't compare it with other tools due to its strategy and accuracy level in predicting the next price directional movement . This tool is designed for serious traders who have decided to make a difference through trading. Be the next person to wi
XQ Indicator MetaTrader 4
Marzena Maria Szmit
3.67 (3)
Step into the realm of Forex trading with confidence and precision using XQ, a cutting-edge Forex indicator designed to elevate your trading game to unprecedented heights. Whether you're a seasoned trader or just stepping into the world of currency exchange,   XQ Forex Indicator   empowers you with the insights and signals needed to make informed trading decisions. The signal conditions are a combination of three indicators, and XQ Forex Indicator only display  medium and long-term trends . The
ECM Elite Channel is a volatility-based indicator, developed with a specific time algorithm, which consists of finding possible corrections in the market. This indicator shows two outer lines, an inner line (retracement line) and an arrow sign, where the channel theory is to help identify overbought and oversold conditions in the market. The market price will generally fall between the boundaries of the channel. If prices touch or move outside the channel, it's a trading opportunity. The
Cycle Sniper
Elmira Memish
4.44 (39)
NEW YEAR SALE PRICE FOR LIMITED TIME!!! Please contact us after your purchase and we will send you the complimentary indicators to complete the system Cycle Sniper is not a holy grail but when you use it in a system which is explained in the videos, you will feel the difference. If you are not willing to focus on the charts designed with Cycle Sniper and other free tools we provide, we recommend not buying this indicator. We recommend watching the videos about the indiactor and system before pu
TPA True Price Action indicator reveals the true price action of the market makers through 100% non-repainting signals (except early signals mode) strictly at the close of a candle! TPA shows entries and re-entries, every time the bulls are definitely stronger than the bears and vice versa. Not to confuse with red/green candles. The shift of power gets confirmed at the earliest stage and is ONE exit strategy of several. There are available now two free parts of the TPA User Guide for our custo
Introduction to Chart Pattern MT Chart Pattern MT is a chart pattern scanner to detect the triangle pattern, falling wedge pattern, rising wedge pattern, channel pattern and so on. Chart Pattern MT uses highly sophisticated chart pattern detection algorithm. However, we have designed it in the easy to use with intuitive user interface. Chart Pattern MT will show all the patterns in your chart in the most efficient format for your trading. You do not have to do tedious manual pattern detection an
" ZigZag on Trend " göstergesi, fiyat hareketinin yönünü belirlemenin yanı sıra bir çubuk ve pip hesaplayıcıdır. Zikzak şeklinde sunulan bir trend çizgisi ile fiyatın yönünü izleyen bir trend göstergesi ve trend yönünde geçen çubuk sayısını ve dikey ölçekteki nokta sayısını hesaplayan bir sayaçtan oluşur. (Hesaplamalar çubuğun açılmasıyla yapılır) Gösterge yeniden çizilmez. Kolaylık sağlamak için renkli çubuklar veya çizgiler şeklinde tasarlanmıştır. Tüm TF'lerde kullanılabilir, ancak en iyisi M
Dear Traders this is my another tool called " Swing Master Indicator ". As the name above the indicator is designed to help you in swing trading by capturing the low and highs of the price. You may us this tool with any trading strategy and style from scalping to position trading. It is made for level of traders including newbies and advanced traders even prop-firms, hedge funds and banks to help them make sold market analysis. I create tools for serious traders who want to make a difference in
Ultimate Sniper Dashboard
Hispraise Chinedum Abraham
4.85 (27)
İndirimli fiyatı 299$! Fiyatlar gelecekte artabilir! Aşağıdaki açıklamayı okuyun! Ultimate Sniper Dashboard için En İyi Giriş Sistemi: NIHAI DINAMIK SEVIYELER. (Lütfen Ürünlerimi Kontrol Edin) Ultimate Sniper Dashboard, MT4 çoklu para birimi test limitleri nedeniyle SADECE canlı piyasalarda çalışır. Ultimate-Sniper Dashboard ile tanışın! Hem HA-Sniper hem de MA-Sniper içeren en iyimiz. ve birçok özel mod. Ultimate Sniper Dashboard mutlak bir canavar! Herhangi bir Acemi veya Uzman Tüccar
Indicator : RealValueIndicator Description : RealValueIndicator is a powerful tool designed specifically for trading on the EURUSD pair. This indicator analyzes all EUR and USD pairs, calculates their real currency strength values, and displays them as a single realistic value to give you a head start on price. This indicator will tell you moves before they happen if you use it right. RealValueIndicator allows you to get a quick and accurate overview of the EURUSD currency pair tops and bottoms,
SNR LEVEL INDICATOR Accurate Snr level indicator will only display Fresh Levels that are close to the Current Market Price. This indicator is very accurate in mapping Support & resistance levels. there is an alert feature when the price TOUCHES the SNR LEVEL, WHEN CLOSE CANDLE BREAK/REJECT SNR LEVEL. INDICATOR MARKING : - SUPPORT LEVEL = V SHAPE - RESISTANCE LEVEL = APEX LEVEL - GAP RESISTANCE & GAP SUPPORT = OPEN CLOSE CANDLE - SUPPORT BECAME RESISTANCE & RESISTANCE BECAME SUPPORT INDICATOR
Enigmera
Ivan Stefanov
5 (4)
ENIGMERA: Pazarın çekirdeği https://www.enigmera.com Giriş Bu gösterge ve ticaret sistemi, finansal piyasalar için dikkate değer bir yaklaşımdır. ENIGMERA, destek ve direnç seviyelerini doğru bir şekilde hesaplamak için fraktal döngüleri kullanır. Gerçek birikim aşamasını gösterir ve yön ve hedefler verir.  İster bir trendde ister bir düzeltmede olalım çalışan bir sistem.  Nasıl çalışır? ENIGMERA üç çizgiden oluşur: destek/direnç çizgisi, hedef çizgisi ve sapma çizgisi. Sistem, geçmiş veril
The indicator is designed to work on any trading platform. The program is based on proprietary algorithms and W.D.Ganna's mathematics, allowing you to calculate target levels of price movement based on three points with the highest degree of certainty. It is a great tool for stock trading. The indicator has three buttons: NEW - call up a triangle for calculation. DEL - delete the selected triangle. DELS - completely remove all constructions. The probability of achieving the goals is more than 80
PZ Trend Trading
PZ TRADING SLU
4.8 (5)
Capture every opportunity: your go-to indicator for profitable trend trading Special Offer: Purchase now to receive free bonuses worth $159! (Read more for details) Trend Trading is an indicator designed to profit as much as possible from trends taking place in the market, by timing pullbacks and breakouts. It finds trading opportunities by analyzing what the price is doing during established trends. [ Installation Guide | Update Guide | Troubleshooting | FAQ | All Products ] Trade financial
NAM Order Blocks
NAM TECH GROUP, CORP.
5 (1)
MT4 Multi-timeframe Order Blocks detection indicator. Features - Fully customizable on chart control panel, provides complete interaction. - Hide and show control panel wherever you want. - Detect OBs on multiple timeframes. - Select OBs quantity to display. - Different OBs user interface. - Different filters on OBs. - OB proximity alert. - ADR High and Low lines. - Notification service (Screen alerts | Push notifications). Summary Order block is a market behavior that indicates order collection
Reversal Sniper
Elmira Memish
5 (3)
Reversal Sniper is designed to find the extreme reversals of the price. Indicator collects data of Cycle Sniper Indicator. NOTE: REVERSAL SNIPER Indicator is made for Cycle Sniper Users as an additional tool.  However, it can be used by the traders who look for finding out strong reversal levels. Indicator works on all timeframes and all instruments. Reversal  Sniper  Checks: Harmonic Patterns RSI Zig Zag and Harmonic Swings Cycle Sniper Indicator's Buy / Sell Signals The complex algo i
TrendMaestro
Stefano Frisetti
5 (3)
note: this indicator is for METATRADER4, if you want the version for METATRADER5 this is the link:  https://www.mql5.com/it/market/product/108106 TRENDMAESTRO ver 2.4 TRENDMAESTRO recognizes a new TREND in the bud, he never makes mistakes. The certainty of identifying a new TREND is priceless. DESCRIPTION TRENDMAESTRO identifies a new TREND in the bud, this indicator examines the volatility, volumes and momentum to identify the moment in which there is an explosion of one or more of these data a
3 Indicators in 1 indicator Strategy based on price action Made specifically for the best forex currency pairs Can be used in the best time frame of the market at a very reasonable price This indicator is basically 3 different indicatos . But we have combined these 3 indicators in 1 indicator so that you can use 3 indicators at the lowest price. All three strategies are based on price action. But based on different trends. Long term, medium term and short term Attributes : No repaintin
ZeusArrow Smart Liquidity Finder  Smart Liquidity Finder is Ai controlled indicator based on the Idea of Your SL is My Entry. It scan and draws the major Liquidity areas on chart partitioning them with Premium and Discount Zone and allows you find the best possible trading setups and help you decide the perfect entry price to avoid getting your Stop Loss hunted . Now no more confusion about when to enter and where to enter. Benefit from this one of it's kind trading tool powered by Ai an trade
This indicator uses support and resistance, volume and some special formula to calculate the volume to filter the candles. If the volume reaches a specific value, And at the same time, Candle breaks the support/resistance line, There would be a signal and we can enter the market. Signals appear when the current candle closes. then you can enter the trade when a new candle appears. Please don't forget to follow your money management plan. MT5 Version Support/Resistance Breakout MT5 :   https:
Yazarın diğer ürünleri
Clear Breakout
Martin Alejandro Bamonte
"Breakout Buy-Sell" göstergesi, farklı piyasa seansları (Tokyo, Londra ve New York) sırasında fiyat kırılmalarına dayalı olarak potansiyel alım ve satım fırsatlarını belirlemek ve vurgulamak için tasarlanmıştır. Bu gösterge, traderların alım ve satım bölgelerini, ayrıca kâr alma (TP) ve zarar durdurma (SL) seviyelerini net bir şekilde görselleştirmelerine yardımcı olur. Kullanım Stratejisi Gösterge şu şekilde kullanılabilir: İlk Kurulum : Piyasa seansını seçin ve GMT farkını ayarlayın. Piyasa Gö
Aurum Apex Mt4 EA
Martin Alejandro Bamonte
Aurum Apex EA Açıklaması Aurum Apex EA, MT4 Platformu için tasarlanmış güçlü bir %100 otomatik ticaret aracıdır. Piyasayı gerçek zamanlı olarak analiz eder ve çeşitli ticaret fırsatlarını tespit eder. Tüm seviyelerdeki tüccarlar için uygun olan Aurum Apex EA, Risk parametresi aracılığıyla ayarlanabilen üç risk modu sunar: Risk = 0.1 (Düşük Risk): Altın hareketlerine aşina olmayan yeni tüccarlar için idealdir. Bu ayar sürprizleri en aza indirirken güveni artırır. Risk = 0.2 (Orta Risk): Altın ti
BullsEye Signal NoRepaint
Martin Alejandro Bamonte
3 (2)
BullseyeSignal – NoRepaint adından da anlaşılacağı gibi, hiçbir koşulda yeniden çizilmez. Sinyal, görüntüde görülen aynı mum üzerinde verilir. Forex, kripto para birimleri, hisse senetleri, endeksler ve vadeli işlemler gibi yüksek volatiliteye sahip piyasalar için idealdir. Satın almak için yeşil bir ok ve satmak için kırmızı bir ok göreceksiniz, ancak arka planda daha basitleştirilmiş bir ticaret deneyimi sağlamak için birçok gösterge birlikte çalışmaktadır. Özellikle doğru girişler sağlamak üz
NextCandlePredictor Göstergesi NextCandlePredictor, yeniden boyamayan, rengini değiştirmeyen, hareket etmeyen, kaybolmayan ve gecikme olmayan bir uyarılı sinyal göstergesidir. Herhangi bir zaman diliminde bir sonraki veya yaklaşan mumların yönünü belirlemenize yardımcı olacaktır. New York, Londra veya her ikisinin de çakıştığı yüksek volatiliteye sahip piyasalar için şiddetle tavsiye edilir. Ana Özellikler: Zaman Dilimlerinde Esneklik: M1'den H1'e ve ötesine kadar herhangi bir zaman diliminde hı
MTFMA (Çok Zaman Çerçeveli Hareketli Ortalamalar) göstergesi, ana grafikten ayrı bir pencerede farklı zaman dilimlerinde birden fazla hareketli ortalamayı (MA) kullanarak alım ve satım sinyalleri sağlar (yeniden boyamaz). Küçük zaman dilimlerinde scalping için ve daha büyük zaman dilimlerinde uzun vadeli ticaret için uygun, çok yönlü ve kolay yorumlanabilen bir göstergedir. Neden Multi-Frame? Çok zaman çerçeveli terimi, göstergenin birden fazla zaman diliminden gelen verileri kullanma ve birleşt
Scalping Signal NO Repaint NO Lag
Martin Alejandro Bamonte
5 (1)
"Scalping Signal No Repaint No Lag", herhangi bir şemaya sürüklendiğinde, herhangi bir şablon veya başka bir gösterge yüklemeye gerek kalmadan tüm gerekli göstergeleri otomatik olarak yükleyen piyasadaki tek göstergedir. Şemayı, sağlanan resimdekiyle tam olarak aynı olacak şekilde otomatik olarak yapılandırır. Bu gösterge, yeniden boyama veya gecikme olmadan sinyaller garanti eder, bu nedenle tüm döviz çiftleri ve zaman dilimlerinde (TF) scalping stratejileri için idealdir. Özellikler Göstergele
GBPUSD Pip Hunter EA Ana Özellikler: M15 Zaman Çerçevesinde GBPUSD için Optimize Edilmiştir: Özellikle GBPUSD çifti için 15 dakikalık grafik üzerinde tasarlanmış ve test edilmiştir. Minimum Tavsiye Edilen Hesap Boyutu: Düşük geri çekilmeler sağlamak için minimum $1000 hesap bakiyesi gereklidir. Spread Uyumluluğu: Karlılığı maksimize etmek için düşük spread veya ECN hesaplarla en iyi şekilde kullanılır. Risk Yönetimi: Ticaret ihtiyaçlarınıza göre Ekponansiyel Lot özelliğini 1.0 olarak ayarlayarak
Pairs and TF Changer
Martin Alejandro Bamonte
Farklı para çiftlerini ve zaman dilimlerini izlemek için birden fazla grafik arasında geçiş yapmaktan bıktınız mı? Pairs and TF Changer göstergesi ticaret deneyiminizi devrim yapacak! Stratejiniz için tüm göstergeleri yükledikten sonra, Pairs and TF Changer 'i grafiğe ekleyin. Gerekirse, konumunu, renklerini veya görüntülenen sütun sayısını ayarlayabilirsiniz! Ana Özellikler: Kesintisiz Entegrasyon: Bu göstergeyi ticaret stratejinize zahmetsizce entegre edin. Tek bir tıklamayla tüm para çiftler
GO Trend MultiTimeFrame
Martin Alejandro Bamonte
GoTrend Çok Zaman Dilimli Gösterge "GoTrend Multi-Timeframe" göstergesi, farklı zaman dilimlerinde bir döviz çiftinin genel ve spesifik eğilimlerini hızlı ve verimli bir şekilde değerlendirmek isteyen tüccarlar için vazgeçilmez bir araçtır. Bu gösterge, tüccarların piyasa yönünü bir bakışta net ve kapsamlı bir şekilde görmelerini sağlayarak karar alma süreçlerini optimize eder ve ticaret stratejilerinin etkinliğini artırır. Ana Özellikler: Çok Zaman Dilimli Analiz: Bu gösterge, M5, M15, M30, H1,
Filtrele:
İnceleme yok
İncelemeye yanıt