RSI OverZone
- Göstergeler
- Van Thanh Tran
- Sürüm: 1.0
- Etkinleştirmeler: 5
RSI OverZone: Enhancing Trading Accuracy
RSI OverZone is a trading tool designed to optimize the use of the Relative Strength Index (RSI) by dynamically adjusting its values to identify overbought and oversold conditions. Here’s how it works:
-
Higher Timeframe Analysis:
- RSI OverZone leverages higher timeframes to determine the current trend. By doing so, it aims to maximize profitability.
- We recommend using the H1 (1-hour) and D1 (daily) timeframes for trend analysis.
-
Trend as Our Guide:
- Recognizing that “the trend is our friend,” RSI OverZone employs two different timeframes:
- One for entry point determination.
- Another for trend assessment.
- This dual approach helps traders make informed decisions.
- Recognizing that “the trend is our friend,” RSI OverZone employs two different timeframes:
-
Dynamic Oversold/Overbought Levels:
- While some traders rely on fixed RSI levels (e.g., 30/70) to identify oversold or overbought conditions, RSI OverZone takes a different approach.
- Consider a strong downtrend: Level 30 may not suffice; even levels as low as 10 could be relevant.
- Similarly, during a robust uptrend, level 70 might be indistinguishable from 50 or 60. Prices often consolidate before resuming their trend.
- Therefore, determining the overall trend is crucial.
-
Key Features:
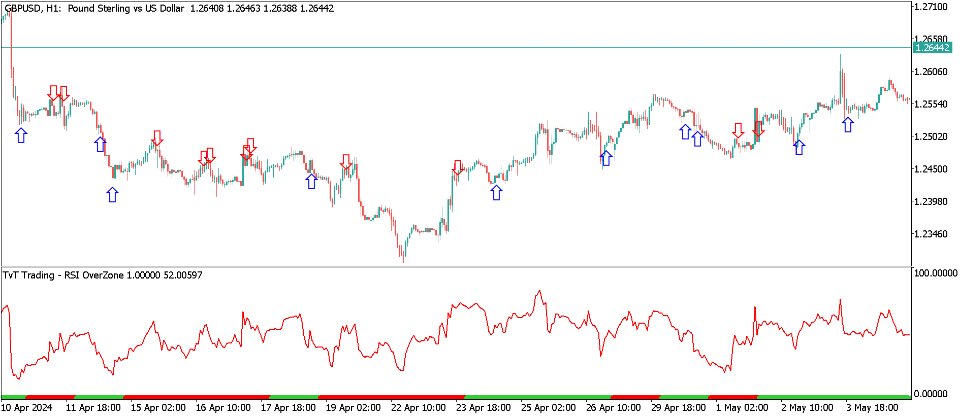
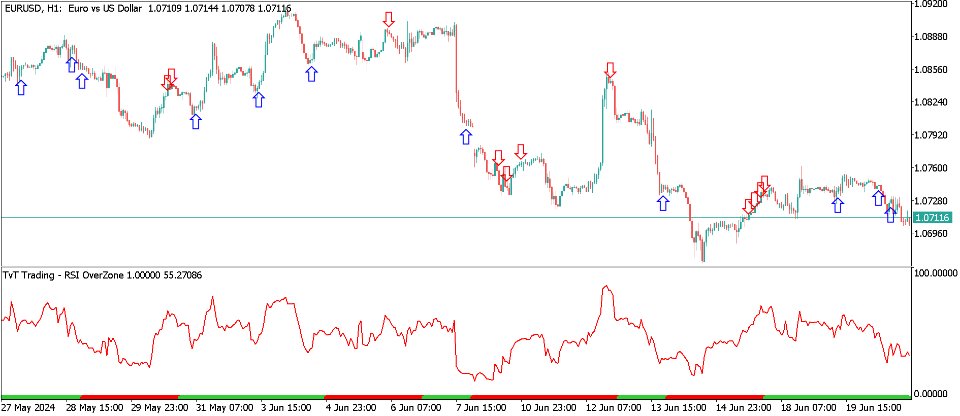
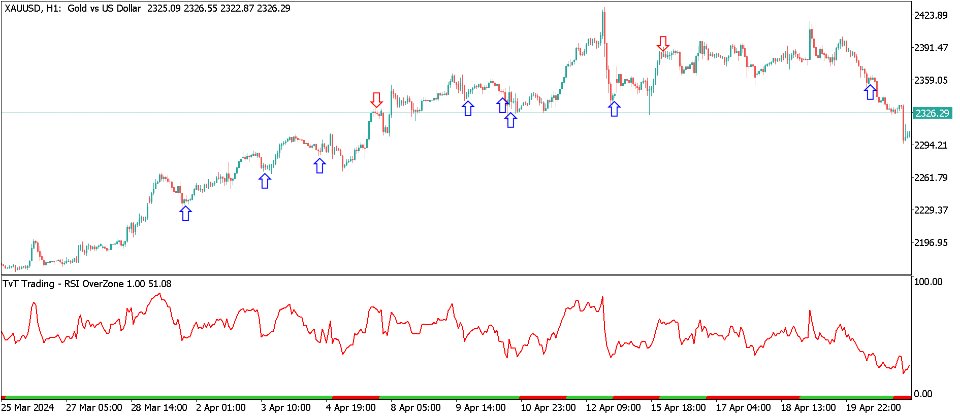
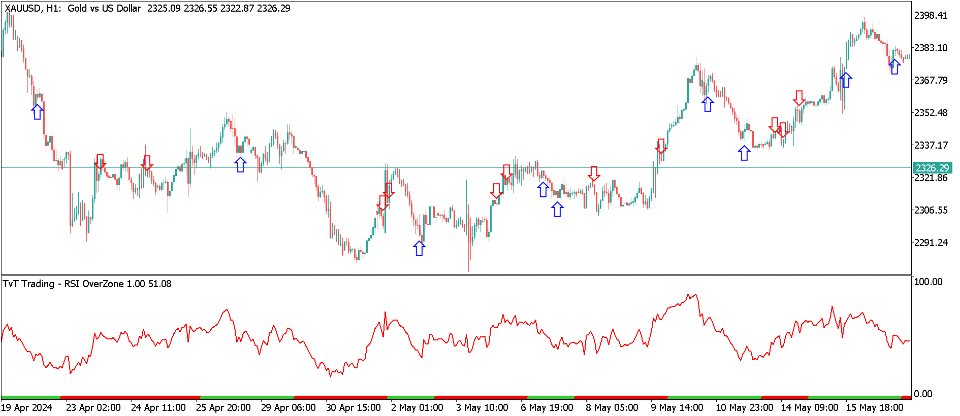
- Color-Coded Trends: RSI OverZone visually represents the current trend:
- Bullish trend: Displayed in green.
- Bearish trend: Displayed in red.
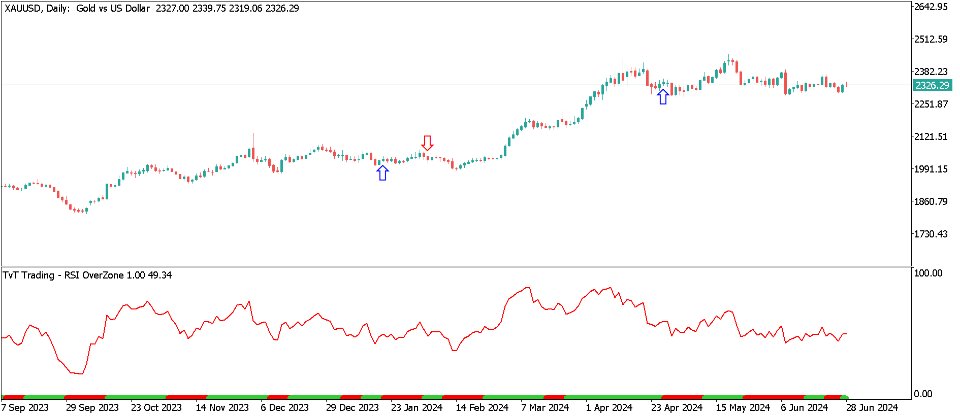
- Buy/Sell Arrows: The tool provides buy/sell signals when potential entry points arise.
- Notifications: Traders receive notifications via MetaTrader 5 to stay informed.
- Versatility: RSI OverZone can be used across multiple symbols and timeframes.
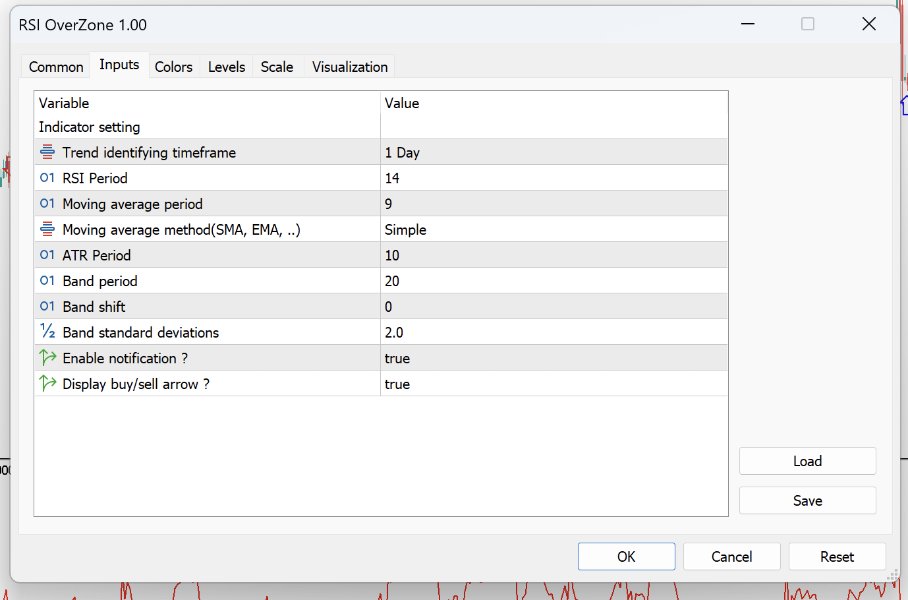
- User-Friendly: The parameters are easily configurable.
Happy trading!

