• Genel bakış
  • İncelemeler
  • Yorumlar

RSI Signal Alert

Why the RSI Alert Indicator is Essential for Your Trading Toolkit

In the fast-paced world of trading, timely and accurate information is crucial. The RSI Alert Indicator is a powerful tool designed to help you stay ahead of the market by providing real-time alerts when the Relative Strength Index (RSI) reaches critical levels. Whether you're a novice trader or a seasoned professional, this indicator can significantly enhance your trading strategy by pinpointing potential market reversals with precision.

Understanding the RSI

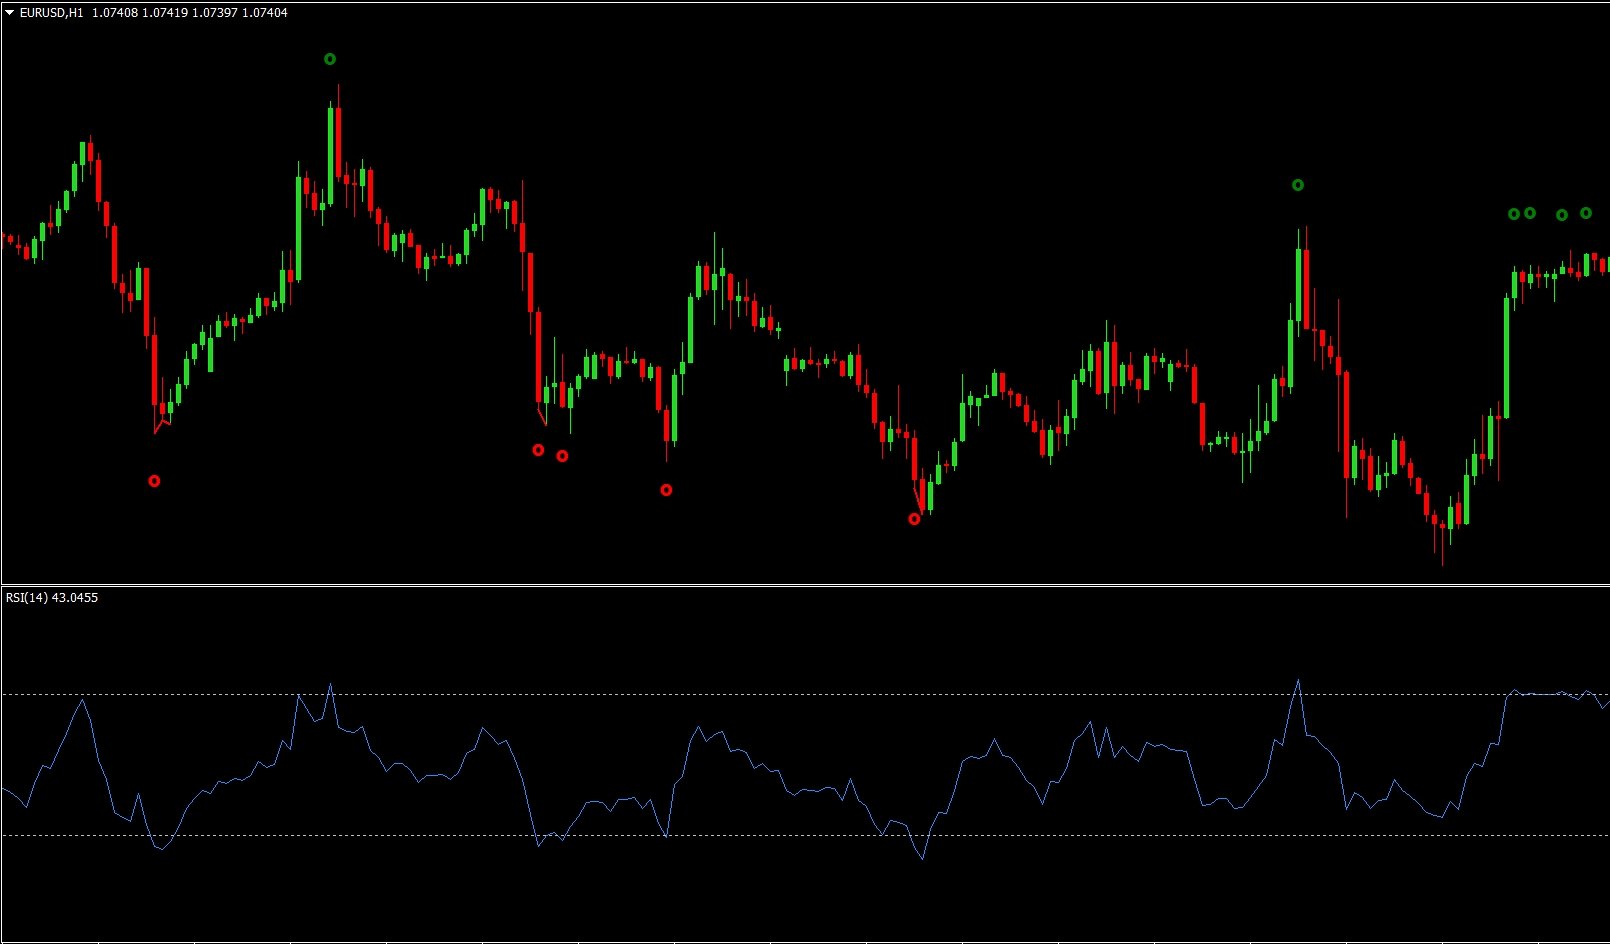
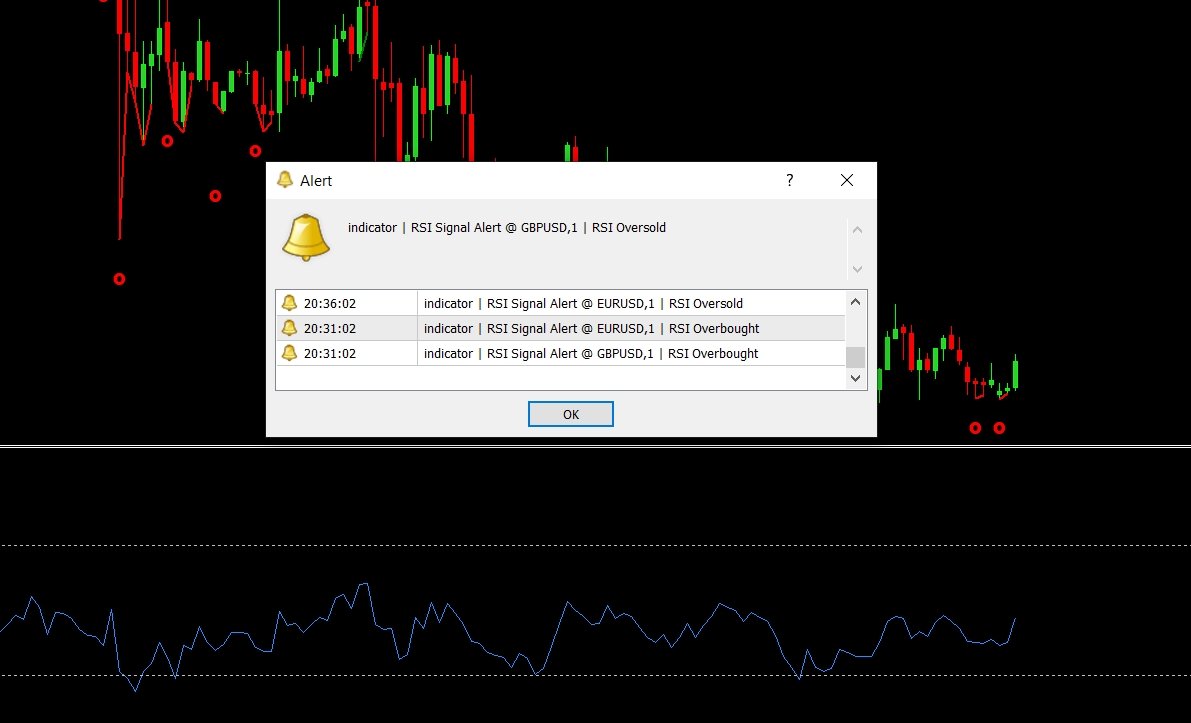
The Relative Strength Index (RSI) is a momentum oscillator that measures the speed and change of price movements. It oscillates between 0 and 100 and is typically used to identify overbought or oversold conditions in the market. When the RSI moves above 70, the asset is considered overbought, and when it moves below 30, it is considered oversold. These levels can signal potential reversal points, making the RSI a valuable tool for traders.

Customizable Parameters for Enhanced Flexibility

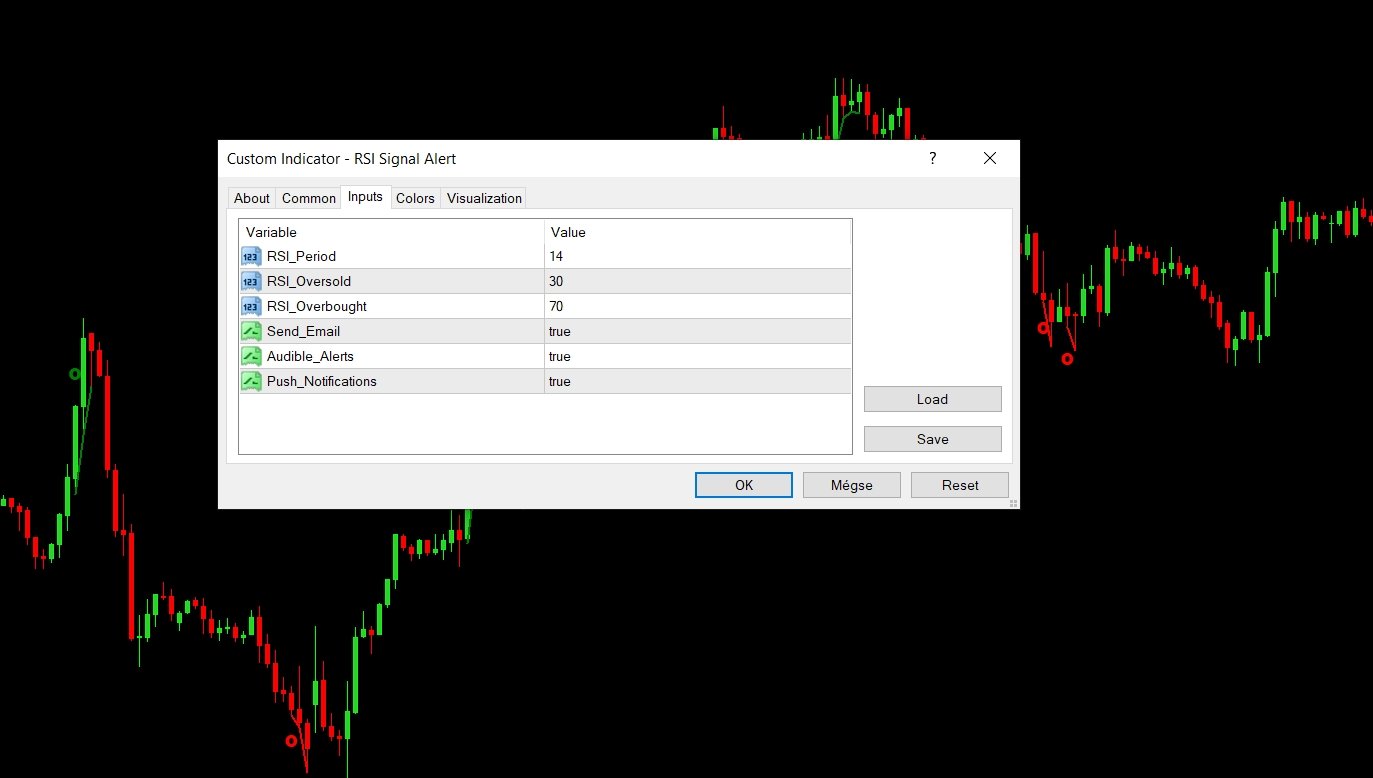
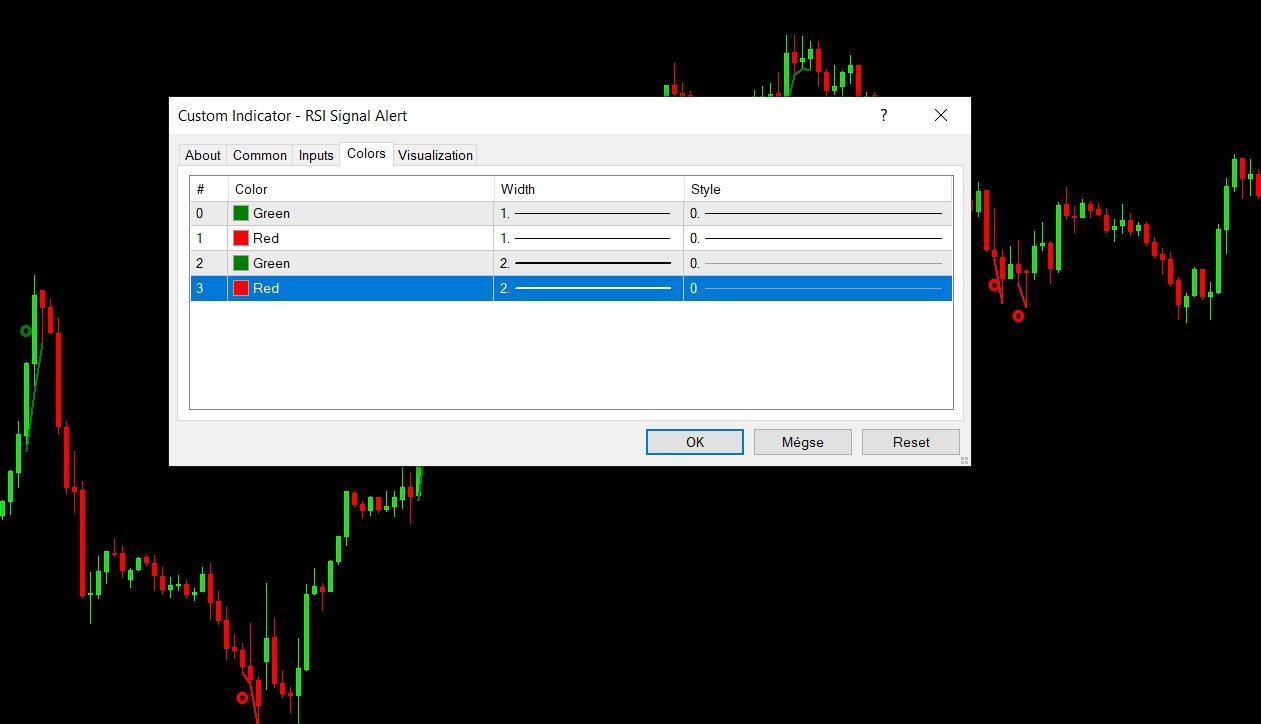
One of the standout features of our RSI Alert Indicator is its customizable parameters, allowing you to tailor the alerts to fit your trading style and preferences:

Upper and Lower Thresholds: Set your own overbought and oversold levels to receive alerts. The default settings are 70 for overbought and 30 for oversold, but these can be adjusted to suit your strategy.
RSI Period: Adjust the period for calculating the RSI to fine-tune the sensitivity of the indicator. A shorter period makes the RSI more responsive, while a longer period smooths out the signals.
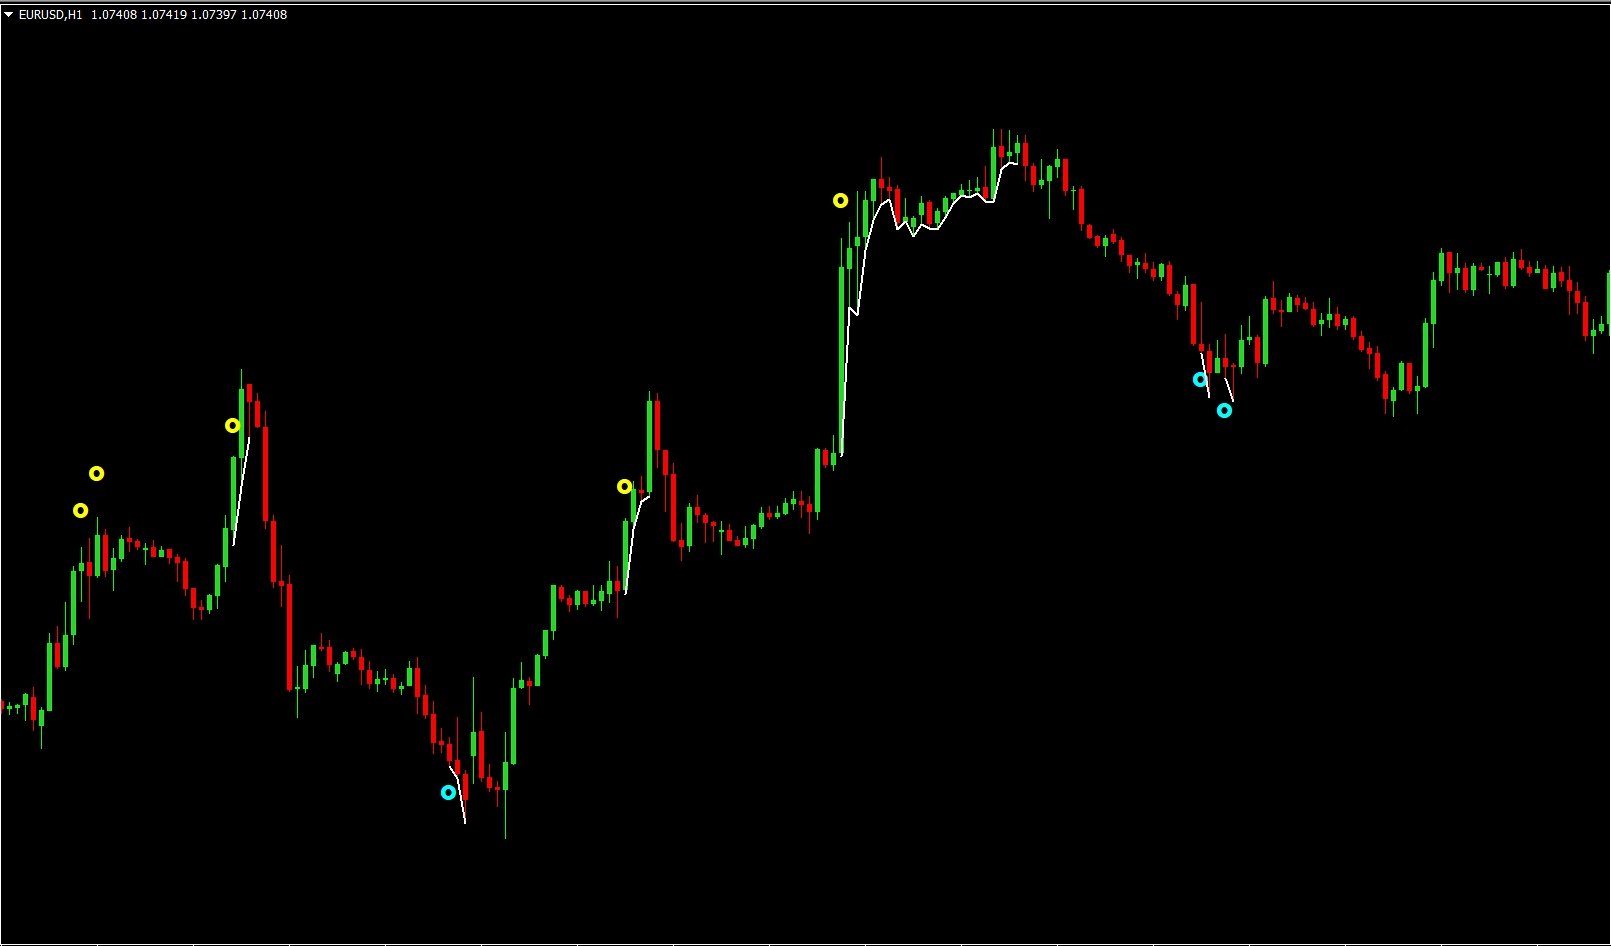
Alert Types: Choose how you want to be notified. The RSI Alert Indicator supports email notifications, phone alerts, and on-screen sound alerts, ensuring you never miss a critical market movement.
Why Choose Our RSI Alert Indicator?

Real-Time Alerts: Stay informed with instant notifications when the RSI hits your predefined levels, allowing you to act swiftly and decisively.
Customizable Settings: Adapt the indicator to your specific trading needs with adjustable RSI periods and threshold levels.
Multiple Alert Options: Receive alerts in the way that suits you best, whether it's via email, phone, or an on-screen sound alert.
User-Friendly Interface: Easy to set up and use, making it accessible for traders of all experience levels.
Maximize Your Trading Potential

With the RSI Alert Indicator, you can take your trading to the next level. By providing timely and accurate alerts, this indicator helps you capitalize on market opportunities and avoid potential pitfalls. Don't let valuable trading opportunities slip by – equip yourself with the RSI Alert Indicator and stay ahead of the game.

This indicator integrates seamlessly with our other tools, including the MACD indicator, the engulfing pattern detector, and the moving average indicator. Together, they provide a comprehensive trading strategy designed to maximize your trading potential and precision.

Get Started Today

Enhance your trading strategy with the RSI Alert Indicator. Download it now and experience the benefits of precise and timely market alerts. Whether you're trading stocks, forex, or cryptocurrencies, this indicator is an indispensable tool for achieving your trading goals.

Don't forget to leave your review to assist further developments. If you have any questions, feel free to send us a private message.

Check out my other products as well: https://www.mql5.com/en/users/8587359/seller

Wishing you successful trading!


Önerilen ürünler
Aussenstab Markttechnik
Alexander Josef Zeidler
This indicator shows external bars ("Aussenstäbe") in the chart in candle form. The colors of the candles can be set individually. Also different colors for bearish and bullish bars are possible. In addition, the color of the wicks or outlines is also adjustable. Outside bars are mentioned e.g. by Michael Voigt in the book "Das große Buch der Markttechnik". All other candles are inner bars.
I do not have the exact indicator for MT4 but the nearest possible look alike can be downloaded from here . Also you may check this link . This is the exact conversion from TradingView: "Donchian Trend Ribbon" By "LonesomeTheBlue". One of the coolest indicators out there to detect trend direction and strength. As a trader you always need such indicator to avoid getting chopped in range markets. There are ten buffers as colors to use in EAs also. The indicator is loaded light and non-repaint. Not
Gösterge, İKİLİ SEÇENEKLER için giriş sinyalleri üretir, grafikte bir ok çizer ve sesli bir uyarı verir. ÇALIŞMA SAATLERİ: 6.OO GMT/ 17.00 GMT (17.00 GMT'den sonra ve gece çok düşük volatilite ve hacim eksikliği nedeniyle önerilmez) ÇİFTLER: EUR/USD (@EU6), GBP/USD (BP6). Zaman dilimleri: 1,2,3,5,10,15 dakika En iyi zaman aralığı: 3 dakika SON KULLANMA TARİHİ: 1 mum Göstergenin çalışması için gerçek hacimlere (onay hacmi yok) ihtiyacı vardır: EUR/USD, GBP/USD ECC spot çiftlerinde çalı
Utilities
Douglas Lucio De Araujo
Indicator with 3 features - Clock : Clock independent of the chart, counting continues even when the market is closed. - Template : After setting up a configuration in any graphic, be it color patterns, indicators, zoom ... The configuration will be copied to all active graphics. - TimeFrame : Set the TimeFrame on a chart, and with just one click all the active charts will be changed to the same TimeFrame.
This indicator is a perfect wave automatic analysis indicator for practical trading! 黄金实战 案例... The standardized definition of the band is no longer a wave of different people, and the art of man-made interference is eliminated, which plays a key role in strict analysis of the approach.=》Increase the choice of international style mode, (red fall green rise style) The  purchase discount is currently in progress! Index content: 1.Basic wave: First, we found the inflection point of the ba
Rejection Block
Usiola Oluwadamilol Olagundoye
The "Rejection Block" MetaTrader 5 Indicator offers traders a comprehensive tool for identifying and visualizing rejection candlestick patterns, commonly known as rejection blocks. These patterns are pivotal in discerning potential market reversals or continuations, making them invaluable for traders seeking to enhance their analysis. Key Features: Rejection Block Detection: The indicator diligently scans price data, pinpointing instances of rejection candlestick patterns. These patterns typical
FREE
Flag MT5
Dmitry Fedoseev
An indicator of patterns #21, #22, #23 ("Flag") from Encyclopedia of Chart Patterns by Thomas N. Bulkowski. Parameters: Alerts - show alert when an arrow appears Push - send a push notification when an arrow appears (requires configuration in the terminal) PeriodBars - period in bars K - an additional parameter that influences the accuracy of pattern shape recognition. The influence of the parameter will be visible if not all of the pattern variants are enabled (not all three parameters Expandin
Bu çoklu zaman çerçevesi ve çoklu sembol göstergesi, ikili üst/alt, baş ve omuz, flama/üçgen ve bayrak desenlerini tanımlar. Uyarıları yalnızca bir boyun çizgisi/üçgen/bayrak direği kopması meydana geldiğinde ayarlamak da mümkündür (boyun çizgisi kırılması = üst/alt ve baş ve omuzlar için onaylanmış sinyal).       Gösterge, tekli grafik modunda da kullanılabilir. Lütfen bu seçenek hakkında daha fazla bilgiyi ürünün       blog   Kendi kurallarınız ve tekniklerinizle birlikte bu gösterge, kendi gü
- This is an implementation of OCC ==> open close cross - This indicator applies twelve different averaging methods to open and close prices separately to signal the trend switching. - All MA methods are set as input as well as period and different offsets applied to linear regression and ALMA averaging. - Buffers 16 and 17 can be used in EAs to detect trend direction. - You can message in private chat for further changes you need.
The Trap Play MT5
Carl Gustav Johan Ekstrom
5 (1)
Trap Play  refers to a market situation where price initially makes a new high or low, luring traders into believing a strong trend is forming. However, the price quickly reverses and invalidates the breakout, trapping those traders who entered positions based on the initial move. This sudden reversal often results in a rapid exit of positions, leading to significant price movement in the opposite direction.  Trap plays  can occur in various financial markets and timeframes and are characterized
Индикатор Magneto Weekly Pro отображает: Недельные важные линии поддержки и сопротивления (выделены желтым, красным и синим цветами). Основные недельные цели (выделены белым цветом). Недельные паттерны возврата цены (обозначаются красными флажками). Применение индикатора Magneto Pro можно использовать и как дополнение к существующей стратегии, и как самодостаточную торговую стратегию. Данный продукт состоит из двух индикаторов, работающих на разных временных промежутках, и предназначен для скал
The indicator is designed to close positions on the market in time. For example: to take profits ahead of schedule if the price has not reached TakeProfit, and the market is turning around. The indicator analyzes the momentum, not the trend. He does not give any information about the trend. The indicator is well suited for finding divergence. The Ershov 38 Parrots indicator dynamically adjusts to the market and detects price movement impulses of medium and high amplitude. It almost does not rea
God Spike Boom
Pedro Luis Oiaz Villamar
Işte size Deriv mt5 ticaret platformunda BOOM sentetik endeksleriyle ticarette devrim yaratacak gösterge geliyor. Tanrı Spike Boom. Ana Özellikler: Yalnızca BOOM endekslerinde çalışır. Trend filtresi vardır. Yalnızca piyasa yükselirken uyarı gönderin. Sesli uyarılar. Cep telefonunuza uyarı gönderebilirsiniz. Nasıl kullanılır: m1 ve m5 zamansallıklarında uygulayın. Sesli uyarıyı bekleyin. Güçlü bir eğilim olduğunu veya halihazırda başlamış olduğunu analiz edin. Trendin sonunda
BeST_Trend Exploiter  is a Metatrader Indicator  based on a smart proprietary algorithm which can detect the market Median Trend while it filters out the noise providing Buy and Sell Signals and also wherever it is applicable it provides us with TP Levels of High Probability. Additionally as it has Built Inside all the necessary features it can be used as a Complete Strategy of very Impressive Results. Essential Advantages of the Indicator Clear and Easily Understandable trading rules. Real
【Super Scanner】Indicator Introduction : The color of the Super Scanner which is green and climbing up means that the price trend is going up.The color of the Super Scanner is red and going down means that the price trend is going down. It is very simple to use it to judge the market trend! What's even better is that the open parameters of the indicators allow investors to adjust. You can adjust【Super Scanner】according to your needs. Adjust it faster to be closer to short-term market fluctuati
ToolBox 360 is the swiss knife of all indicators. It is full packed with useful tools to help you with your trading. It can be used to find best entry and exit points and help you to decide if you should open a trade or not. It shows market trends, candlestick formations outside / inside bars and you can sett time based allerts. Main features: Time based Fibonacci lines Choose a start and end time and the indicator shows you Fibonacci lines within the selected time range including range high
--- StudentK Sync Chart --- 1. Move charts at the same time 2. Cross check among different Symbols and Timeframes 3. Plan your own trading strategies --- Context --- StudentK is not indicated as a master or K Sir for knowledgeable person who claims for winning all the time. (But lots of traders should know the fact that it is rarely truth, especially in fluctuated period of time) StudentK is a group of years-experienced traders who want to share amazing tools in Free and Paid versions. Aimi
Trend change detector is an indicator for Metatrader 5.It can help you determine the change in a local trend to open a correct position. It has 2 parameters. Period and mistake offset percent. You can change the period parameter to capture little changes in trend.  There are two lines: the red one and the green one. You can use them as a local support and resistance level. Arrows show the change in a trend. Up arrow the price will go down and Down arrow the price will go up. Also, by changing m
Our indicator will help you to make a decision whether to Buy or Sell , including where to set the Take Profit and Stop Loss . The Buy/Sell signal will not redraw nor repaint until new signal occurs. The Take Profit and Stop Loss will change following the market conditions. Our indicator will give alert to your mobile/handphone when new buy/sell signal arrive. For best result, combine this indicator with your knowledge on price action and support & resistance, also don't forget to watch for the
The Retracement Feeder  checks for retracement opportunities after the first move has occurred.  Basically it scans for the second wave of trend. Works with any financial instrument,  It does not repaint/change color or cancel arrows, Easy to set and use. Works great with Renko Charts MT4 version:  https://www.mql5.com/en/market/product/67443 How it works The indicator is based on RSI and Stochastics.  The algorithm used in the Retracement Feeder allows the Stochastic and RSI to minimize the t
Introduction to Fractal Pattern Scanner Fractal Indicator refers to the technical indicator that makes use of the fractal geometry found in the financial market. Fractal Pattern Scanner is the advanced Fractal Indicator that brings the latest trading technology after the extensive research and development work in the fractal geometry in the financial market. The most important feature in Fractal Pattern Scanner is the ability to measure the turning point probability as well as the trend probabil
BreakHarmony Multi-Timeframe   Breakout Indicator for MT5 The BreakHarmony Multi-Timeframe Breakout Indicator for MT5 is a highly advanced tool providing information on breakout points across different timeframes, aiding traders in decision-making and understanding market movements. [  Features and Manual   | MT4 version   |   All Products  ] The indicator   tracks breakout points   on price charts across 6 timeframes.   Breakout prices are indicated   with the closing price of the correspond
It's a multi-symbol and multi-timeframe scanner for our indicator - ACB Breakout Arrows . With default settings, it scans for the buy/sell signals on 28 currency pairs and 9 time-frames concurrently.   Features It can scan 252* combinations of symbols and time-frames from a single chart. Open the signal's chart loaded with a predefined template with a single click.  Easy drag n drop anywhere on the chart. Real-time alerts with popup, sound, push-notifications and email alerts.  Input Para
Skiey
Vitalii Zakharuk
Skiey - Indicator of easy solutions! Using this indicator is very simple, since the simplest is to look at the chart and act according to the color arrows. Such a calculation option takes into account intraday price fluctuations and focuses on measuring the "candlestick" share in the trend. The algorithm takes into account the measurement of prices, this method also emphasizes the measurement of each of the price drops (H / C, H / O, LC, LO) - which gives more detailed information but also mo
Go Ferramentas
Fabio Oliveira Magalhaes
This product is a set of tools that help the trader to make decisions, bringing information from different categories that complement each other: trend, support / resistance and candle patterns. It also has a panel with information about the balance. The trend has two different calculations and is shown as colored candles. Strategy 1 is longer, having 3 different states: up, down and neutral trend. Strategy 2 has a faster response and has only 2 states: up and down trend. Support and resistance
1. Why did I develop this series of indicators I found that most traders need to use multiple time frame indicators. They usually switch time frame to see indicators. However, once the timeframe is switched, you cannot see the  corresponding relationship  between  the price in the smaller timeframe  and  the indicator in the larger timeframe . For example: if your price chart is in H1 timeframe, you can see H4, D1 and W1 indicators in H1 timeframe Chart. This is more helpful for you to find t
Drawing Pack MT5
John Louis Fernando Diamante
This indicator provides several drawing tools to assist in various methods of chart analysis. The drawings will keep their proportions (according to their handle trendline) across different chart scales, update in real time, and multiple drawings are supported. # Drawing Option Description  1 Grid box draggable boxed grid, user defines rows x colums, diagonal ray option  2 Grid partial or fullscreen grid, sized by handle line  3 Grid flex a diagonal grid, sized and sloped by handle line
DYNAMIC SR TREND CHANNEL Dynamic SR Trend Channel is a simple indicator for trend detection as well as resistance/support levels on the current timeframe. It shows you areas where to expect possible change in trend direction and trend continuation. It works with any trading system (both price action and other trading system that use indicators) and is also very good for renko charting system as well. In an uptrend, the red line (main line) serves as the support and the blue line serves as the
KT Absolute Strength MT5
KEENBASE SOFTWARE SOLUTIONS
KT Absolute Strength measures and plots the absolute strength of the instrument's price action in a histogram form. It combines the moving average and histogram for a meaningful illustration. It supports two modes for the histogram calculation, i.e., it can be calculated using RSI and Stochastic both. However, for more dynamic analysis, RSI mode is always preferred. Buy Entry When the Absolute Strength histogram turns green and also it's higher than the previous red column. Sell Entry W
Fast Quantum Indicators based on innovate SSC model and Real time tracking pursuit the breakouts of support and resistance levels.   Tüm tür pazarlarda alınan yeni bir başlangıç. Fast Quantum Indicators   is a   innovate initiate     SSC model   Real time tracking  pursuit  trend , based on innovate SSC model and Real time tracking pursuit the breakouts of support and resistance levels.  It's a innovate initiate traded on all types of markets. Fast Quantum AI Expert Trading Robots EVERYTHING IS
Bu ürünün alıcıları ayrıca şunları da satın alıyor
Öncelikle belirtmek gerekir ki bu Ticaret Göstergesi Yeniden Çizim Yapmaz, Gecikmez ve Gecikme Göstermez, bu da hem manuel hem de robot ticareti için ideal hale getirir. Kullanıcı kılavuzu: ayarlar, girişler ve strateji. Atom Analisti, Piyasada Daha İyi Bir Avantaj Bulmak İçin Fiyatın Gücünü ve Momentumunu Kullanan PA Fiyat Hareketi Göstergesidir. Gürültüleri ve Yanlış Sinyalleri Kaldırmaya ve Ticaret Potansiyelini Artırmaya Yardımcı Olan Gelişmiş Filtrelerle Donatılmıştır. Birden fazla katmanl
Öncelikle, bu Ticaret Sistemi'nin Non-Repainting, Non-Redrawing ve Non-Lagging Göstergesi olduğunu vurgulamak önemlidir, bu da hem manuel hem de robot ticareti için ideal hale getirir. Online kurs, kılavuz ve ön ayarları indir. "Smart Trend Trading System MT5", yeni ve deneyimli tüccarlar için özelleştirilmiş kapsamlı bir ticaret çözümüdür. 10'dan fazla premium göstergeyi birleştiriyor ve 7'den fazla sağlam ticaret stratejisi sunuyor, bu da çeşitli piyasa koşulları için esnek bir seçim yapar. Tr
FX Power MT5 NG
Daniel Stein
5 (5)
Sabah Brifingimiz burada mql5 ve on Telegram! FX Power MT5 NG , uzun zamandır çok popüler olan döviz gücü ölçerimiz FX Power'ın yeni neslidir. Peki bu yeni nesil güç ölçer ne sunuyor? Orijinal FX Power hakkında sevdiğiniz her şey PLUS GOLD/XAU güç analizi Daha da hassas hesaplama sonuçları Ayrı ayrı yapılandırılabilir analiz dönemleri Daha da iyi performans için özelleştirilebilir hesaplama limiti Özel çokluDaha fazlasını görmek isteyenler için örnek ayarlar Her grafikte en sevdiğiniz renkler i
Quantum Trend Sniper
Bogdan Ion Puscasu
4.91 (43)
Tanıtım       Kuantum Trend Keskin Nişancı Göstergesi   , trend tersine dönmeleri belirleme ve ticaret yapma şeklinizi değiştiren çığır açan MQL5 Göstergesi! 13 yılı aşkın ticaret tecrübesine sahip deneyimli tüccarlardan oluşan bir ekip tarafından geliştirilmiştir.       Kuantum Trend Keskin Nişancı Göstergesi       trend dönüşlerini son derece yüksek doğrulukla belirlemenin yenilikçi yolu ile ticaret yolculuğunuzu yeni zirvelere taşımak için tasarlanmıştır. ***Kuantum Trend Keskin Nişancı Gö
Reversal First Impulse levels (RFI)      INSTRUCTIONS        RUS       -       ENG              R ecommended to use with an indicator   -   TREND PRO -  Version MT4                 A key element in trading is zones or levels from which decisions to buy or sell a trading instrument are made. Despite attempts by major players to conceal their presence in the market, they inevitably leave traces. Our task was to learn how to identify these traces and interpret them correctly. Main functions:: Di
Trend Screener Pro MT5
STE S.S.COMPANY
4.88 (64)
Trend Göstergesi, Trend Alım Satım ve Filtreleme için Çığır Açan Benzersiz Çözüm, Tüm Önemli Trend Özellikleriyle Tek Bir Araç İçinde Yerleştirildi! Forex, emtialar, kripto para birimleri, endeksler ve hisse senetleri gibi tüm sembollerde/araçlarda kullanılabilen %100 yeniden boyamayan çoklu zaman çerçevesi ve Çoklu para birimi göstergesidir. Trend Screener, grafikte noktalarla ok trend sinyalleri sağlayan etkili bir trend trend göstergesidir. Trend analizörü göstergesinde bulunan özellikler: 1.
Öncelikle, bu Ticaret Aracının Non-Repainting, Non-Redrawing ve Non-Lagging Gösterge olduğunu vurgulamakta fayda var, bu da onu profesyonel ticaret için ideal hale getiriyor. Çevrimiçi kurs, kullanıcı kılavuzu ve demo. Akıllı Fiyat Hareketi Kavramları Göstergesi, hem yeni hem de deneyimli tüccarlar için çok güçlü bir araçtır. İleri ticaret fikirlerini, Inner Circle Trader Analizi ve Smart Money Concepts Ticaret Stratejileri gibi 20'den fazla kullanışlı göstergeyi bir araya getirerek bir aray
Gold Stuff mt5
Vasiliy Strukov
4.89 (178)
Gold Stuff mt5, özellikle altın için tasarlanmış bir trend göstergesidir ve herhangi bir finansal enstrümanda da kullanılabilir. Gösterge yeniden çizilmez ve gecikmez. Önerilen zaman dilimi H1. Ayarları ve kişisel bir bonusu almak için satın alma işleminden hemen sonra benimle iletişime geçin!  Güçlü Destek ve Trend Tarayıcı göstergemizin ücretsiz bir kopyasını pm'den alabilirsiniz. Ben!   AYARLAR Ok Çiz - açık kapalı. grafik üzerinde oklar çizmek. Uyarılar - sesli uyarılar kapalı. E-post
FX Volume MT5
Daniel Stein
4.94 (17)
Sabah Brifingimiz aracılığıyla ayrıntılar ve ekran görüntüleri ile günlük piyasa güncellemenizi alın burada mql5 ve on Telegram ! FX Volume, bir brokerin bakış açısından piyasa duyarlılığı hakkında GERÇEK bir fikir veren İLK ve TEK hacim göstergesidir. COT raporlarından çok daha hızlı bir şekilde, brokerlar gibi kurumsal piyasa katılımcılarının Forex piyasasında nasıl konumlandıklarına dair harika bilgiler sağlar. Bu bilgileri doğrudan grafiğinizde görmek, ticaretiniz için gerçek oyun değiştir
TPSproTREND PrO MT5
Roman Podpora
4.88 (8)
TPSpro TRENDPRO  - is a trend indicator that automatically analyzes the market and provides information about the trend and each of its changes, as well as giving signals for entering trades without redrawing! The indicator uses each candle, analyzing them separately. referring to different impulses - up or down impulse. Exact entry points into transactions for currencies, crypto, metals, stocks, indices!  -  Version MT4               DETAILED DESCRIPTION               R ecommended to use with
FxaccurateLS
Shiv Raj Kumawat
WHY IS OUR FXACCCURATE LS MT5 THE PROFITABLE ? PROTECT YOUR CAPITAL WITH RISK MANAGEMENT Gives entry, stop and target levels from time to time. It finds Trading opportunities by analyzing what the price is doing during established trends. POWERFUL INDICATOR FOR A RELIABLE STRATEGIES We have made these indicators with a lot of years of hard work. It is made at a very advanced level. Established trends provide dozens of trading opportunities, but most trend indicators completely ignore them!
The Volume by Price Indicator for MetaTrader 5 features Volume Profile and Market Profile TPO (Time Price Opportunity). Volume and TPO histogram bar and line charts. Volume Footprint charts. TPO letter and block marker collapsed and split structure charts. Session filtering and grouping. Static, dynamic and flexible range segmentation and compositing methods with relative and absolute visualizations. Graphical layering, positioning and styling options to suit the user's analytic and aesthetic n
AW Trend Predictor MT5
AW Trading Software Limited
4.78 (58)
Tek bir sistemde trend ve kırılma seviyelerinin kombinasyonu. Gelişmiş bir gösterge algoritması piyasa gürültüsünü filtreler, trendi, giriş noktalarını ve olası çıkış seviyelerini belirler. Gösterge sinyalleri, sinyal geçmişinin etkinliğini gösteren en uygun enstrümanların seçilmesine izin veren bir istatistiksel modüle kaydedilir. Gösterge Kâr Al ve Zararı Durdur işaretlerini hesaplar. Kılavuz ve talimatlar ->   BURAYA   / MT4 versiyonu ->   BURAYA Gösterge ile nasıl ticaret yapılır: Trend Pre
ICT, SMC, SMART MONEY CONCEPTS, SMART MONEY, Smart Money Concept, Support and Resistance, Trend Analysis, Price Action, Market Structure, Order Blocks, BOS/CHoCH,   Breaker Blocks ,  Momentum Shift,   Supply&Demand Zone/Order Blocks , Strong Imbalance,   HH/LL/HL/LH,    Fair Value Gap, FVG,  Premium  &   Discount   Zones, Fibonacci Retracement, OTE, Buy Side Liquidity, Sell Side Liquidity, BSL/SSL Taken, Equal Highs & Lows, MTF Dashboard, Multiple Time Frame, BigBar, HTF OB, HTF Market Structure
Quantum Heiken Ashi PRO MT5
Bogdan Ion Puscasu
4.5 (8)
Quantum Heiken Ashi PRO ile   tanışın Pazar eğilimleri hakkında net bilgiler sağlamak üzere tasarlanan Heiken Ashi mumları, gürültüyü filtreleme ve yanlış sinyalleri ortadan kaldırma yetenekleriyle ünlüdür. Kafa karıştırıcı fiyat dalgalanmalarına veda edin ve daha sorunsuz, daha güvenilir bir grafik sunumuna merhaba deyin. Quantum Heiken Ashi PRO'yu gerçekten benzersiz kılan şey, geleneksel şamdan verilerini okunması kolay renkli çubuklara dönüştüren yenilikçi formülüdür. Kırmızı ve yeşil çubukl
Easy By Sell is a market indicator for opening and closing positions. It becomes easy to track market entries with alerts. It indicates trend reversal points when a price reaches extreme values ​​and the most favorable time to enter the market. it is as effective as a Fibonacci to find a level but it uses different tools such as an algorithm based on ATR indicators and Stochastic Oscillator. You can modify these two parameters as you wish to adapt the settings to the desired period. My othe
Legacy of Gann for MT5
Pavel Zamoshnikov
5 (6)
The indicator very accurately determines the levels of the possible end of the trend and profit fixing. The method of determining levels is based on the ideas of W.D.Gann, using an algorithm developed by his follower Kirill Borovsky. Extremely high reliability of reaching levels (according to K. Borovsky  - 80-90%) Indispensable for any trading strategy – every trader needs to determine the exit point from the market! Precisely determines targets on any timeframes and any instruments (forex, met
"Piranha" - an autonomous trading system that determines overbought and oversold levels on the chart. Red and blue zones represent overbought and oversold levels respectively. Entry points are marked with arrows: a downward arrow in the red zone for "sell" and an upward arrow in the blue zone for "buy". The Take profit level is indicated by the green moving average. Key features: Adjusting the Take profit level as the green moving average changes position. Averaging ability when a new market e
Fiyat tersine döndükçe ve geri çekildikçe piyasa yapısından elde edilen kâr değişir. Piyasa yapısını tersine çevirme uyarısı göstergesi, bir trendin veya fiyat hareketinin ne zaman tükenmeye yaklaştığını ve tersine dönmeye hazır olduğunu tanımlar. Genellikle bir geri dönüş veya büyük bir geri çekilme meydana gelmek üzereyken meydana gelen piyasa yapısındaki değişiklikler konusunda sizi uyarır. Gösterge, olası bir tükenme noktasının yakınında her yeni yüksek veya düşük oluştuğunda, başlangıçta
Top indicator for MT5   providing accurate signals to enter a trade without repainting! It can be applied to any financial assets:   forex, cryptocurrencies, metals, stocks, indices .  Watch  the video  (6:22) with an example of processing only one signal that paid off the indicator! MT4 version is here It will provide pretty accurate trading signals and tell you when it's best to open a trade and close it. Most traders improve their trading results during the first trading week with the help of
IX Power MT5
Daniel Stein
5 (3)
IX Power   nihayet FX Power'ın rakipsiz hassasiyetini Forex dışı sembollere getiriyor. En sevdiğiniz endeksler, hisse senetleri, emtialar, ETF'ler ve hatta kripto para birimlerindeki kısa, orta ve uzun vadeli eğilimlerin yoğunluğunu doğru bir şekilde belirler. Terminalinizin sunduğu   her şeyi analiz   edebilirsiniz. Deneyin ve işlem yaparken   zamanlamanızın   nasıl   önemli ölçüde iyileştiğini   deneyimleyin. IX Power Temel Özellikler 100 hassas, yeniden boyanmayan hesaplama sonuçları -
Bill Williams Advanced
Siarhei Vashchylka
5 (5)
Bill Williams Advanced is designed for automatic chart analysis using Bill Williams' "Profitunity" system. The indicator analyzes four timeframes at once. Manual (Be sure to read before purchasing) Advantages 1. Automatically analyzes the chart using the "Profitunity" system of Bill Williams. The found signals are placed in a table in the corner of the screen. 2. Equipped with a trend filter based on the Alligator indicator. Most of the system signals are recommended to be used only accordi
TPA True Price Action indicator reveals the true price action of the market makers through 100% non-repainting signals strictly at the close of a candle! TPA shows entries and re-entries, every time the bulls are definitely stronger than the bears and vice versa. Not to confuse with red/green candles. The shift of power gets confirmed at the earliest stage and is ONE exit strategy of several. There are available now two free parts of the TPA User Guide for our customers. The first "The Basics"
** All Symbols x All Timeframes scan just by pressing scanner button ** ***Contact me after purchase to send you instructions and add you in "123 scanner group" for sharing or seeing experiences with other users. After 17 years of experience in the markets and programming, Winner indicator is ready. I would like to share with you! Introduction The 123 Pattern Scanner indicator with a special enhanced algorithm is a very repetitive common pattern finder with a high success rate . Interestingly,
Yeni Başlayanlar veya Uzman Tüccarlar için En İyi Çözüm! Bu Gösterge benzersiz, yüksek kaliteli ve uygun fiyatlı bir ticaret aracıdır çünkü bir dizi tescilli özellik ve yeni bir formül ekledik. Sadece BİR grafik ile 28 Forex çifti için Döviz Gücünü okuyabilirsiniz! Yeni bir trendin veya scalping fırsatının tam tetik noktasını belirleyebildiğiniz için ticaretinizin nasıl gelişeceğini hayal edin? Kullanım kılavuzu:   buraya tıklayın Bu ilk olan, orijinal! Değersiz bir özenti klonunu almayın
Bu gösterge paneli, seçilen semboller için mevcut en son   harmonik kalıpları   gösterir, böylece zamandan tasarruf edersiniz ve daha verimli olursunuz /   MT4 sürümü . Ücretsiz Gösterge:   Basic Harmonic Pattern Gösterge sütunları Symbol :   seçilen semboller görünecektir Trend:   yükseliş veya düşüş Pattern :   desen türü (gartley, kelebek, yarasa, yengeç, köpekbalığı, cypher veya ABCD) Entry :   giriş fiyatı SL:   zararı durdur fiyatı TP1:   1. kar alma fiyatı TP2:   2. kar alma fiyatı
Yeni Nesil Otomatik Arz ve Talep Bölgeleri. Her Grafikte Çalışan Yeni ve Yenilikçi Algoritma. Tüm Bölgeler Piyasanın Fiyat Hareketine Göre Dinamik Olarak Oluşturulmaktadır. İKİ TÜR UYARI --> 1) FİYAT BİR BÖLGEYE ÇIKTIĞINDA 2) YENİ BİR BÖLGE OLUŞTURDUĞUNDA Bir tane daha işe yaramaz gösterge almazsın. Kanıtlanmış Sonuçlarla eksiksiz bir Ticaret Stratejisi elde edersiniz.     Yeni özellikler:     Fiyat Arz/Talep Bölgesine ulaştığında uyarılar     Yeni bir Arz/Talep Bölgesi olu
AW Prime Oscillator MT5
AW Trading Software Limited
İki osilatörün birleşimi. Birincisi giriş noktalarını, ikincisi ise mevcut trendi gösterir. Gösterge, osilatör sinyallerini iki modda oklarla görüntüleyebilir; tüm hızlı osilatör sinyalleri veya yalnızca mevcut trend yönündeki sinyaller. Çok zaman dilimli bir panele ve üç tür sinyal bildirimine sahiptir. Faydalar: Günlük ve scalping ticaretine uygundur Trend filtreleme Basit ve hassas kurulum Çoklu zaman dilimi paneli Bir danışmana entegrasyona uygundur. Herhangi bir sembol ve herhangi bir zaman
Owl Smart Levels MT5
Sergey Ermolov
4.38 (37)
MT4 versiyonu  |  FAQ Owl Smart Levels Indicator , Bill Williams'ın gelişmiş fraktalları , piyasanın doğru dalga yapısını oluşturan Valable ZigZag ve kesin giriş seviyelerini gösteren Fibonacci seviyeleri gibi popüler piyasa analiz araçlarını içeren tek gösterge içinde eksiksiz bir ticaret sistemidir. pazara ve kar elde edilecek yerlere. Stratejinin ayrıntılı açıklaması Gösterge ile çalışma talimatı Baykuş Yardımcısı ticaretinde Danışman Yardımcısı Kullanıcıların özel sohbeti -> Satın aldıktan
ADR Ters Çevirme Göstergesi, normal ortalama günlük aralığına göre fiyatın şu anda nerede işlem gördüğünü bir bakışta size gösterir. Fiyat, ortalama aralığı ve seçtiğiniz seviyenin üzerindeki seviyeleri aştığında, açılır pencere, e-posta veya push yoluyla anında uyarılar alacaksınız, böylece hızlı bir şekilde geri çekilmelere ve geri dönüşlere atlayabilirsiniz. Gösterge, grafikte ortalama günlük aralık uç noktalarında yatay çizgiler ve ayrıca fiyatları aşan matematiksel olasılıkları olan seviye
Yazarın diğer ürünleri
Bu, MACD tabanlı bir trend takip göstergesidir ve 200 MA'nın üzerindeyken alım sinyalleri, altındayken satış sinyalleri sağlar. Sinyal, MACD'nin sıfır çizgisini geçtiğinde üretilir. Gösterge aynı zamanda stop loss olarak kullanılabilecek bir destek ve direnç seviyesini de görüntüler. Ayarlanabilir parametreler arasında MA dönemi, MACD hızlı EMA, yavaş EMA ve destek-direnç aralığı bulunur. Son mumların en düşük ve en yüksek noktalarına çizilir. Varsayılan ayarlar: SR aralığı: 10 MA dönemi:
FREE
İşlem stratejinizde hareketli ortalamaları kullanıyorsanız, bu gösterge sizin için çok faydalı olabilir. İki hareketli ortalamanın kesişiminde sinyal sağlar, işitsel uyarılar gönderir, işlem platformunuzda bildirimler görüntüler ve olayla ilgili bir e-posta da gönderir. Kendi işlem tarzınıza ve stratejinize uyum sağlamak için kolayca özelleştirilebilir ayarlarla birlikte gelir. Ayarlanabilir parametreler: Hızlı MA (Fast MA) Yavaş MA (Slow MA) E-posta Gönder (Send_Email) İşitsel Uyarılar (Audibl
FREE
Bu, MACD tabanlı bir trend takip göstergesidir ve 200 MA'nın üzerindeyken alım sinyalleri, altındayken satış sinyalleri sağlar. Sinyal, MACD'nin sıfır çizgisini geçtiğinde üretilir. Gösterge aynı zamanda stop loss olarak kullanılabilecek bir destek ve direnç seviyesini de görüntüler. Ayarlanabilir parametreler arasında MA dönemi, MACD hızlı EMA, yavaş EMA ve destek-direnç aralığı bulunur. Son mumların en düşük ve en yüksek noktalarına çizilir. Varsayılan ayarlar: SR aralığı: 10 MA dönemi:
FREE
Engulfing Candle Signal Alert: Elevate Your Trading Strategy   Unlock the full potential of your trading with the Engulfing Candle Signal Alert, the ultimate tool for identifying market reversals and enhancing your trading precision. Designed specifically for traders who value accuracy and timely alerts, this powerful indicator detects engulfing candle patterns, a key signal in technical analysis that often indicates a potential shift in market direction.   What is an Engulfing Candle?   An engu
FREE
İşlem stratejinizde hareketli ortalamaları kullanıyorsanız, bu gösterge sizin için çok faydalı olabilir. İki hareketli ortalamanın kesişiminde sinyal sağlar, işitsel uyarılar gönderir, işlem platformunuzda bildirimler görüntüler ve olayla ilgili bir e-posta da gönderir. Kendi işlem tarzınıza ve stratejinize uyum sağlamak için kolayca özelleştirilebilir ayarlarla birlikte gelir. Ayarlanabilir parametreler: Hızlı MA (Fast MA) Yavaş MA (Slow MA) E-posta Gönder (Send_Email) İşitsel Uyarılar (Audibl
FREE
Engulfing Candle Signal Alert: Elevate Your Trading Strategy   Unlock the full potential of your trading with the Engulfing Candle Signal Alert, the ultimate tool for identifying market reversals and enhancing your trading precision. Designed specifically for traders who value accuracy and timely alerts, this powerful indicator detects engulfing candle patterns, a key signal in technical analysis that often indicates a potential shift in market direction.   What is an Engulfing Candle?   An engu
FREE
Welcome! This is the RSI GridMaster Mini, the freely available compact version of the popular RSI GridMaster. This robot operates based on the RSI indicator with a grid strategy, allowing for continuous trading in response to market movements. The Mini version comes with a fixed lot size of 0.01 and trades exclusively on the hourly time frame. In this version, the number of settings has been minimized to simplify and streamline the trading process. You can find the full version by clicking here
FREE
Bu, bir trend çizgisinin kırılmasında bir uyarı sağlayan basit bir göstergedir. Eğer ticaretinizde trend çizgilerini kullanmaya alışkınsanız, bu kullanışlı olabilir. Ayarlanabilir parametreler arasında: Mum kimliği: Kırılma sonrasında hangi mumda sinyal verileceği Ve üç tür uyarı: E-posta Gönder İşitsel Uyarılar Push Bildirimleri Telefonunuzda bildirim uyarılarını nasıl kuracağınızı öğrenmek için bu videoyu izleyin: https://www.youtube.com/watch?v=4oO-3fMQ4QA Kurulum kılavuzu: https://w
Introducing the RSI GridMaster Expert Advisor, the culmination of extensive development and rigorous testing. This powerful trading tool leverages the RSI indicator to execute sell orders in overbought conditions and buy orders in oversold conditions. Consistent profits are achieved through position averaging. Summer Kickoff Sale! We are excited to announce our Summer Kickoff Sale with a 30% discount on our expert advisor! Don't miss this opportunity to enhance your trading strategy at a reduced
Introducing the RSI GridMaster Expert Advisor, the culmination of extensive development and rigorous testing. This powerful trading tool leverages the RSI indicator to execute sell orders in overbought conditions and buy orders in oversold conditions. Consistent profits are achieved through position averaging. Summer Kickoff Sale!  We are excited to announce our Summer Kickoff Sale with a 30% discount on our expert advisor! Don't miss this opportunity to enhance your trading strategy at a reduce
Welcome! This is the RSI GridMaster Mini, the freely available compact version of the popular RSI GridMaster. This robot operates based on the RSI indicator with a grid strategy, allowing for continuous trading in response to market movements. The Mini version comes with a fixed lot size of 0.01 and trades exclusively on the hourly time frame. In this version, the number of settings has been minimized to simplify and streamline the trading process. You can find the full version by clicking here
FREE
Introducing our simple yet powerful trendline trading expert, designed to open positions upon trendline breaks or touches based on predefined parameters. All you need to do is rename it to buy, sell, buy limit, or sell limit. As the name suggests, this is the basic version with minimal features. However, if you're looking for a truly professional trendline trading expert equipped with various trading management tools, automatic position sizing, trailing stops, breakeven points, partial closures,
FREE
Welcome! Summer Kickoff Sale! We are excited to announce our Summer Kickoff Sale with a 30% discount on our expert advisor! Don't miss this opportunity to enhance your trading strategy at a reduced price. This special offer is valid until the end of June. Get your expert advisor now and take your trading to the next level! We are delighted to introduce our latest expert, which is a semi-automatic trading system that includes all the features you need for position management. Simply draw a line o
The Position Control is an intuitive yet powerful trading tool that facilitates risk management from entry to exit.  It includes automatic lot sizing, fixed stop loss and take profit features, or determines them using the ATR indicator. After opening a position, you can set automatic break-even points, trailing stops, and choose from three types of partial closures. Moreover, if you open a 0.01 lot position from your phone, the expert will automatically close it and open a risk-managed position
Welcome, we introduce the Manual Grid Assistant, which can be an excellent complement to your manual grid trading! The Manual Grid Assistant is an efficient and sophisticated trading tool that perfectly complements manual grid trading strategies. This tool allows you to manage manually opened positions on your behalf while ensuring maximum profit and controlling risk. One of its main advantages is that it automatically closes all open positions when a predefined total pip reach or a specified p
Why the RSI Alert Indicator is Essential for Your Trading Toolkit In the fast-paced world of trading, timely and accurate information is crucial. The RSI Alert Indicator is a powerful tool designed to help you stay ahead of the market by providing real-time alerts when the Relative Strength Index (RSI) reaches critical levels. Whether you're a novice trader or a seasoned professional, this indicator can significantly enhance your trading strategy by pinpointing potential market reversals with
Bu, bir trend çizgisinin kırılmasında bir uyarı sağlayan basit bir göstergedir. Eğer ticaretinizde trend çizgilerini kullanmaya alışkınsanız, bu kullanışlı olabilir. Ayarlanabilir parametreler arasında: Mum kimliği: Kırılma sonrasında hangi mumda sinyal verileceği Ve üç tür uyarı: E-posta Gönder İşitsel Uyarılar Push Bildirimleri Test amaçlı olarak, MetaTrader 5'in strateji testinden ziyade MetaTrader 4'ü kullanmanızı öneririz, çünkü trend çizgilerini çizmeyi desteklemez. MT4 Sürümü:  https
The Position Control is an intuitive yet powerful trading tool that facilitates risk management from entry to exit.  It includes automatic lot sizing, fixed stop loss and take profit features, or determines them using the ATR indicator. After opening a position, you can set automatic break-even points, trailing stops, and choose from three types of partial closures. Moreover, if you open a 0.01 lot position from your phone, the expert will automatically close it and open a risk-managed position
Welcome, we introduce the Manual Grid Assistant, which can be an excellent complement to your manual grid trading! The Manual Grid Assistant is an efficient and sophisticated trading tool that perfectly complements manual grid trading strategies. This tool allows you to manage manually opened positions on your behalf while ensuring maximum profit and controlling risk. One of its main advantages is that it automatically closes all open positions when a predefined total pip reach or a specified p
Filtrele:
İnceleme yok
İncelemeye yanıt