Multi timeframe moving average VWMA by William210
- Göstergeler
- Gerard Willia G J B M Dinh Sy
- Sürüm: 1.0
- Etkinleştirmeler: 5
=== > Bu gösterge ne işe yarar?
Kodlarımın çoğu gibi bu da çoklu zaman diliminden oluşuyor.
Örneğin, bir günlük grafiğin H1'de görüntülenmesini sağlarlar.
William210 ile tüm kodlarımı (kod tabanı ve pazar yeri) arayın
Hacimce ağırlıklandırılmış hareketli bir ortalamadır, değiş tokuş edilen hacimlere göre hassas bir yumuşatmadır.
Zaman dilimi seçimiyle tek bir WWMA ortalamasını çizer
Bu göstergeyi çizelgelerinize ortalamaya ihtiyacınız olduğu kadar bırakırsınız.
Ortalamanızın parametrelerini ve özelliklerini seçin, işte bu kadar!!!
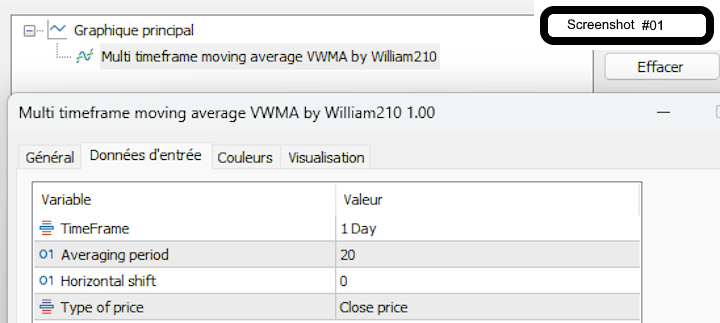
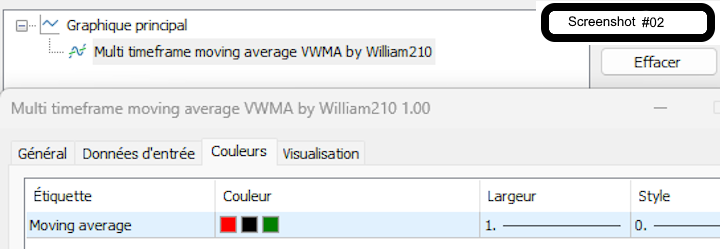
**** 01'den 02'ye kadar Vedi ekran görüntüsü
Zengin veri söz konusu olduğunda kodlanacak, diğer göstergeler veya EA
Seçmek
Hedef zamansal korniş
Dönemin adı
Bu dekalkomanya
Dell'OHLC'yi tasarlarım
Della tendenza'yı renklendiriyor
"William210" konuşmacısı olmayan kişi başına.
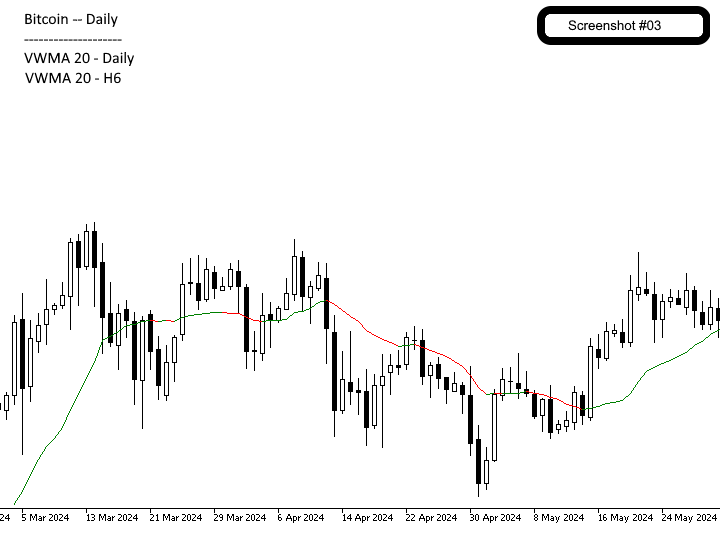
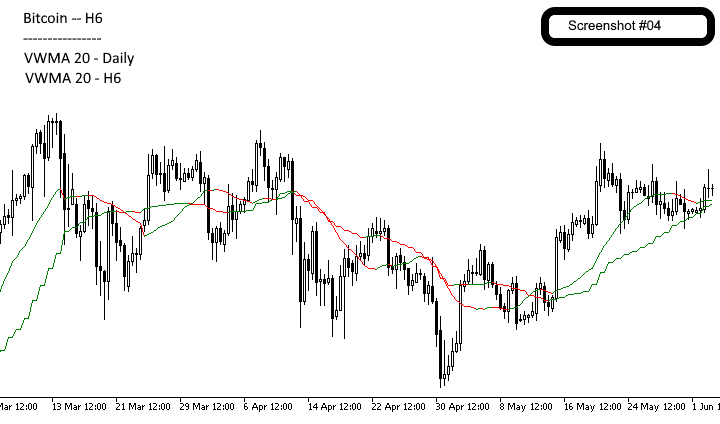
=== > Bazı örnekler
Ayrıca, çok zaman dilimli hareketli ortalamayı kullanmak basittir
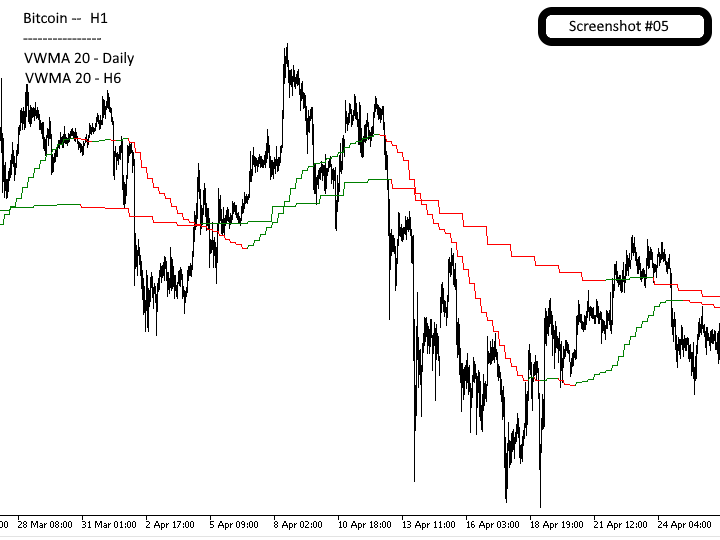
Bitcoin örneği
Biri Günlük zaman diliminde ve diğeri H6'da olmak üzere 2 aylık hücresel 20 ekleyin ve H1'i koruyun
**** Vedi ekran görüntüsü 3'ten 5'e
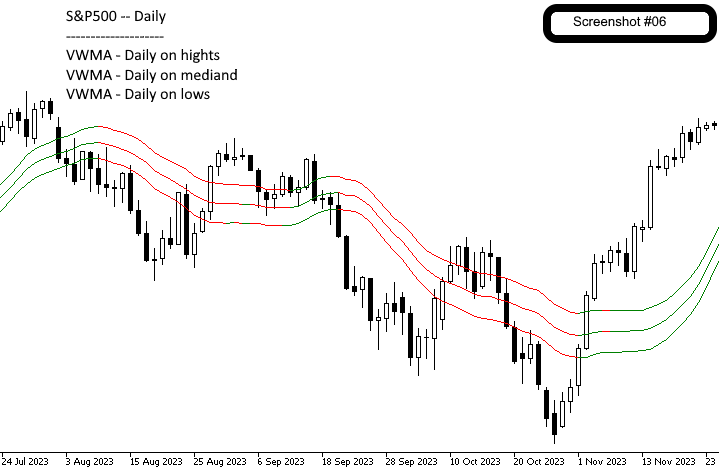
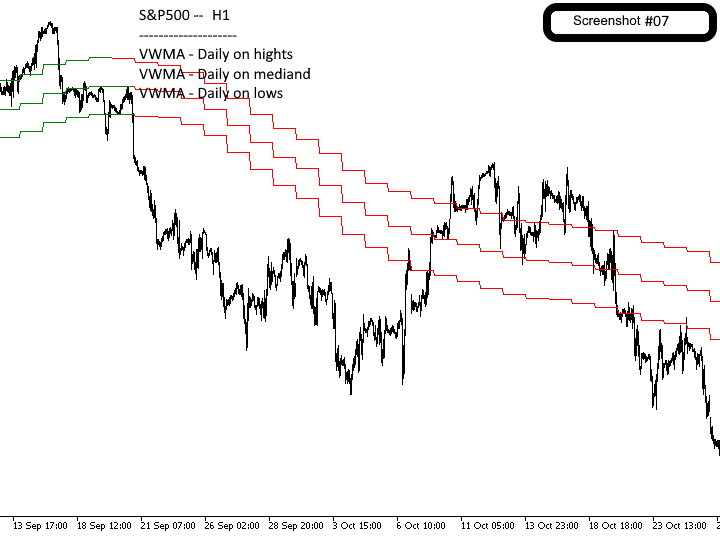
S&P500 örneği
En yüksek düzeyde 20 günlük uygulama periyodu için 3 aylık hücresel süre ekleyin ve H1'i dikkate alın
**** Vedi ekran görüntüsü 6'dan 7'ye
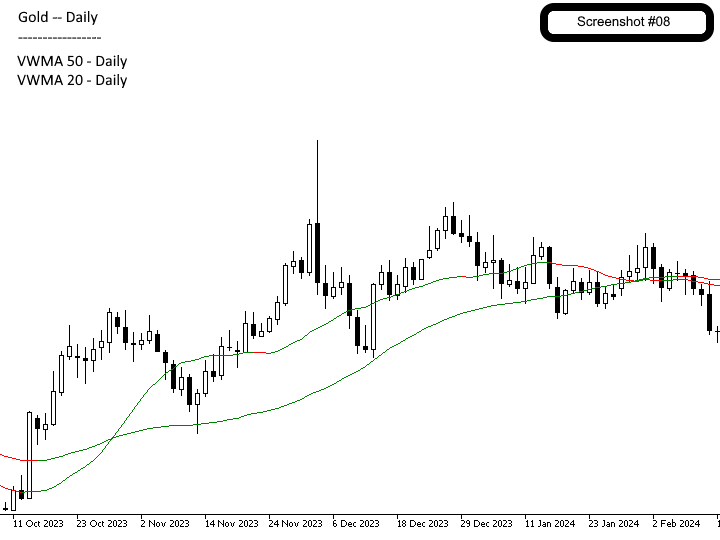
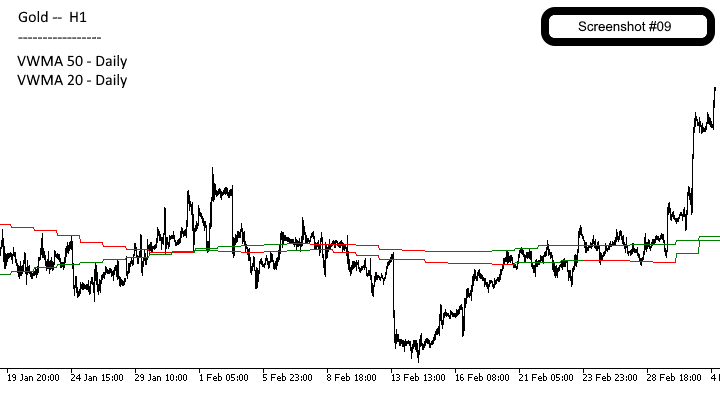
Altın örneği
2 ay boyunca günde 50 ve 20 kez cep telefonuna dayanıyor ve H1'i koruyor
**** Vedi ekran görüntüsü 8'den 9'a
seninki
Loro stratejisini optimize etmek için yararlı bir görev göstergesi olan diğer yatırımcıların kullanım ve kapsamları ve yorumları ile ilgili koşullar ve yorumlar!
=== > Kimin için?
Sağduyulu bir tüccar, algoritmik bir tüccar veya akıllı bir tüccar iseniz, göstergenin özel ihtiyaçlarınıza cevap vereceği düşünülmektedir. Güvenilirliğin ve verimliliğin önemini para cebimdeyken anlıyorum ve bu çok önemli sorumluluğu üstleniyorum.
Gösterge PC'nizde veya VPS'nizde cebinizi tüketir. Ticaret algoritmaları ve faydalı bilgiler için tampona tam erişiminiz vardır: piyasanın değeri için tampon 1 ve piyasanın yönelimi için tampon 2.
=== > Tünemiş mi?
Hücresel ortalamalar uzun süredir kullanılmaktadır. Esas olarak trendi ve aralığı tanımlamak için kullanılır.
Uzman Danışmanlarınız (EA) için bakın, kararı daha kolay ve en iyi şekilde verebilirsiniz.
=== > Uygulanan geliştirme kuralları
Değişken adlandırma => Tüm değişkenler tutarlı ve açıklayıcı bir şekilde adlandırılır, bu da kodun anlaşılmasını ve bakımını kolaylaştırır.
Global değişkenlerin minimum kullanımı => Çok az global değişken kullanılır.
Düşük bellek tüketimi => Gösterge, en iyi performansı sağlayacak şekilde az bellek tüketecek şekilde tasarlanmıştır.
Değişkenlerin başlatılması => Tüm değişkenler başlatılır, bu da beklenmeyen davranışları en aza indirir ve kod kararlılığını güçlendirir.
Döngü optimizasyonu => Tüm döngüler, verimli geçiş sağlamak için optimize edilmiştir, böylece hesaplamaların hızı artar.
Döngü sayısının sınırlandırılması=>: Birkaç tedavinin birleştirilmesiyle döngü sayısı azaltılmıştır.
Hata yönetimi => Tüm işlev geri dönüşleri, olası hataları tespit etmek ve işlemek için dikkatli bir şekilde yönetilerek maksimum güvenilirlik sağlanır.
Günlük boyutunun sınırlandırılması => Bir prosedür, tekrarlanan mesajların yazılmasını sınırlar, böylece günlüğün aşırı yüklenmesini önler ve hata ayıklamayı kolaylaştırır.
=== > Sağlam Kod Çözme
Kalıcı modda çalışan sağlam bir koda sahip olmak önemlidir. Bir sorun olması durumunda hata mesajı oluşmayabilir. Sistem kontrollü olsa bile gösterge hızlı ve otomatik olarak kalacaktır.
=== > Nasıl yapıldı?
Yerel ima() işlevine dayalı değildir: Gösterge, yerel ima() işlevinden bağımsızdır.
OOP uygulamasının prensibi: Ancak OOP'ta yazılmaz, programın prensibi, fonksiyonlarının uygulaması dahilinde uygulamasının programlanmasına yöneliktir.
Transfer penceresi işlevi: Piyasa dışı Sembollerde bile çalışır. Görüntüyü yenilemek için başka bir zaman aralığında tıklamanız gerekebilir.
Kesintilerin yönetimi: İnternet kesintisi veya sunucu sorunu durumunda sinyal göstergesi tüm saatleri ve tüm hesaplamaları gösterir.
Açıklama: Çok sayıda yeniden düzenlenmiş, yeniden dağıtılmış, gösterge ve onay işareti artırılmış, kripto değeri veya çok değişken semboller için çok önemli.