Market Noise MT4
- Göstergeler
- Ivan Butko
- Sürüm: 1.2
- Güncellendi: 29 Mayıs 2024
- Etkinleştirmeler: 10
Market Noise
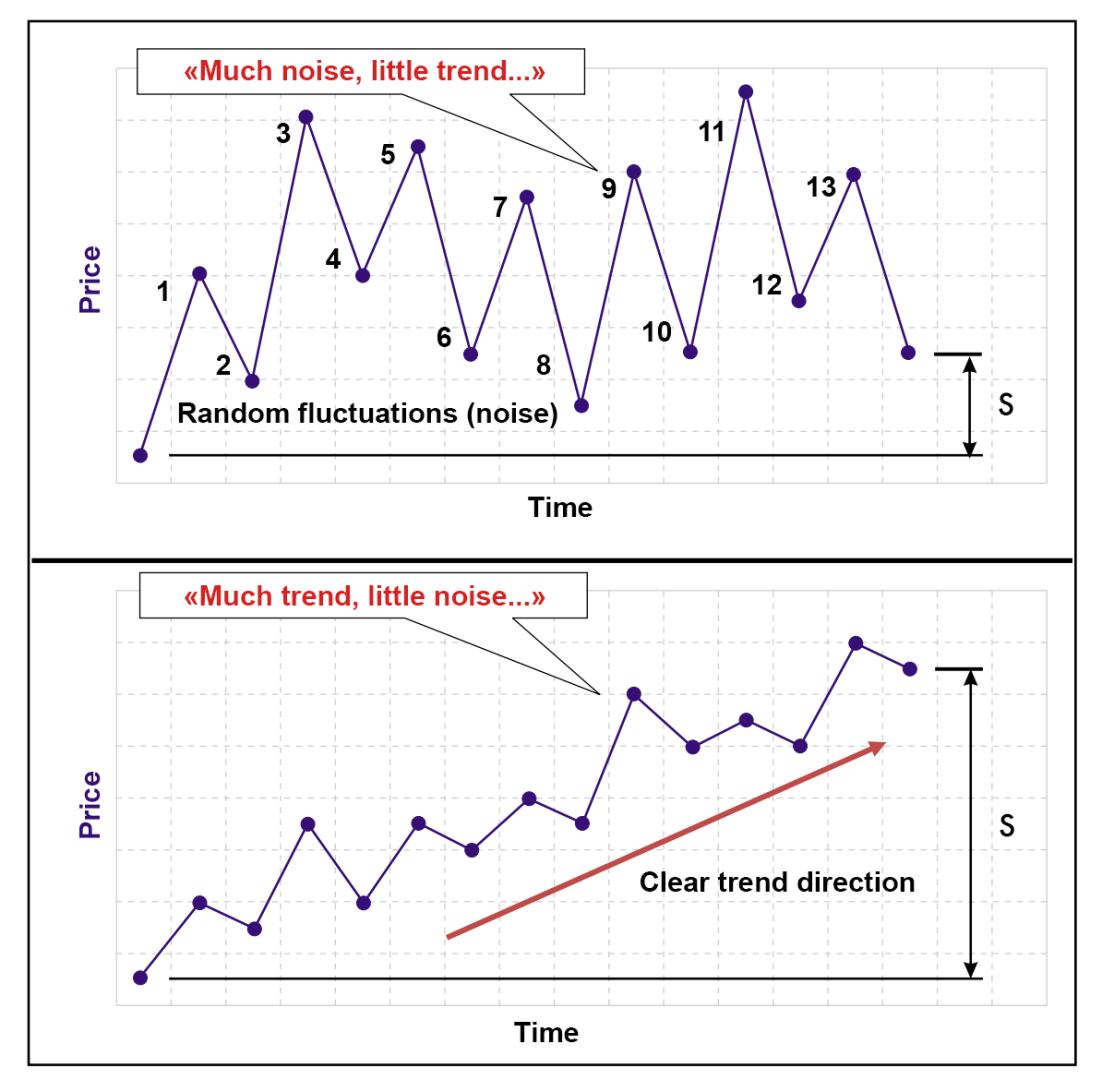
Piyasa Gürültüsü, fiyat grafiğindeki piyasa aşamalarını belirleyen ve aynı zamanda bir birikim veya dağıtım aşaması meydana geldiğinde net, yumuşak trend hareketlerini gürültülü düz hareketlerden ayıran bir göstergedir.
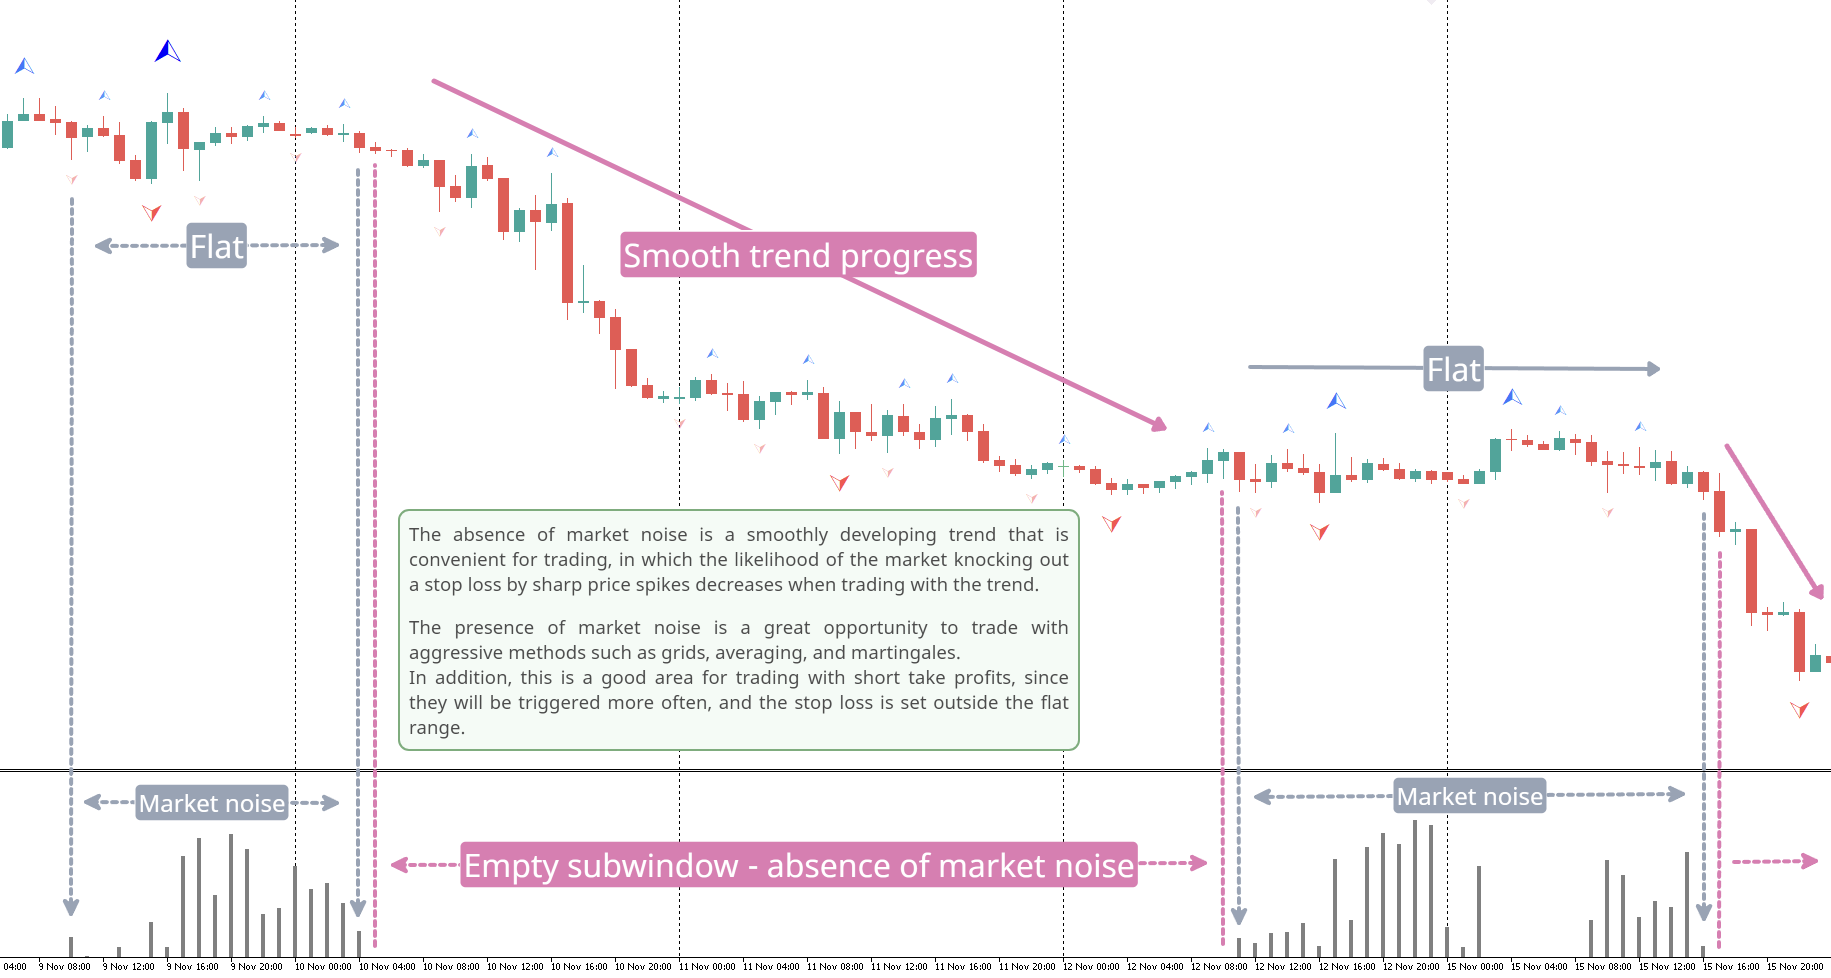
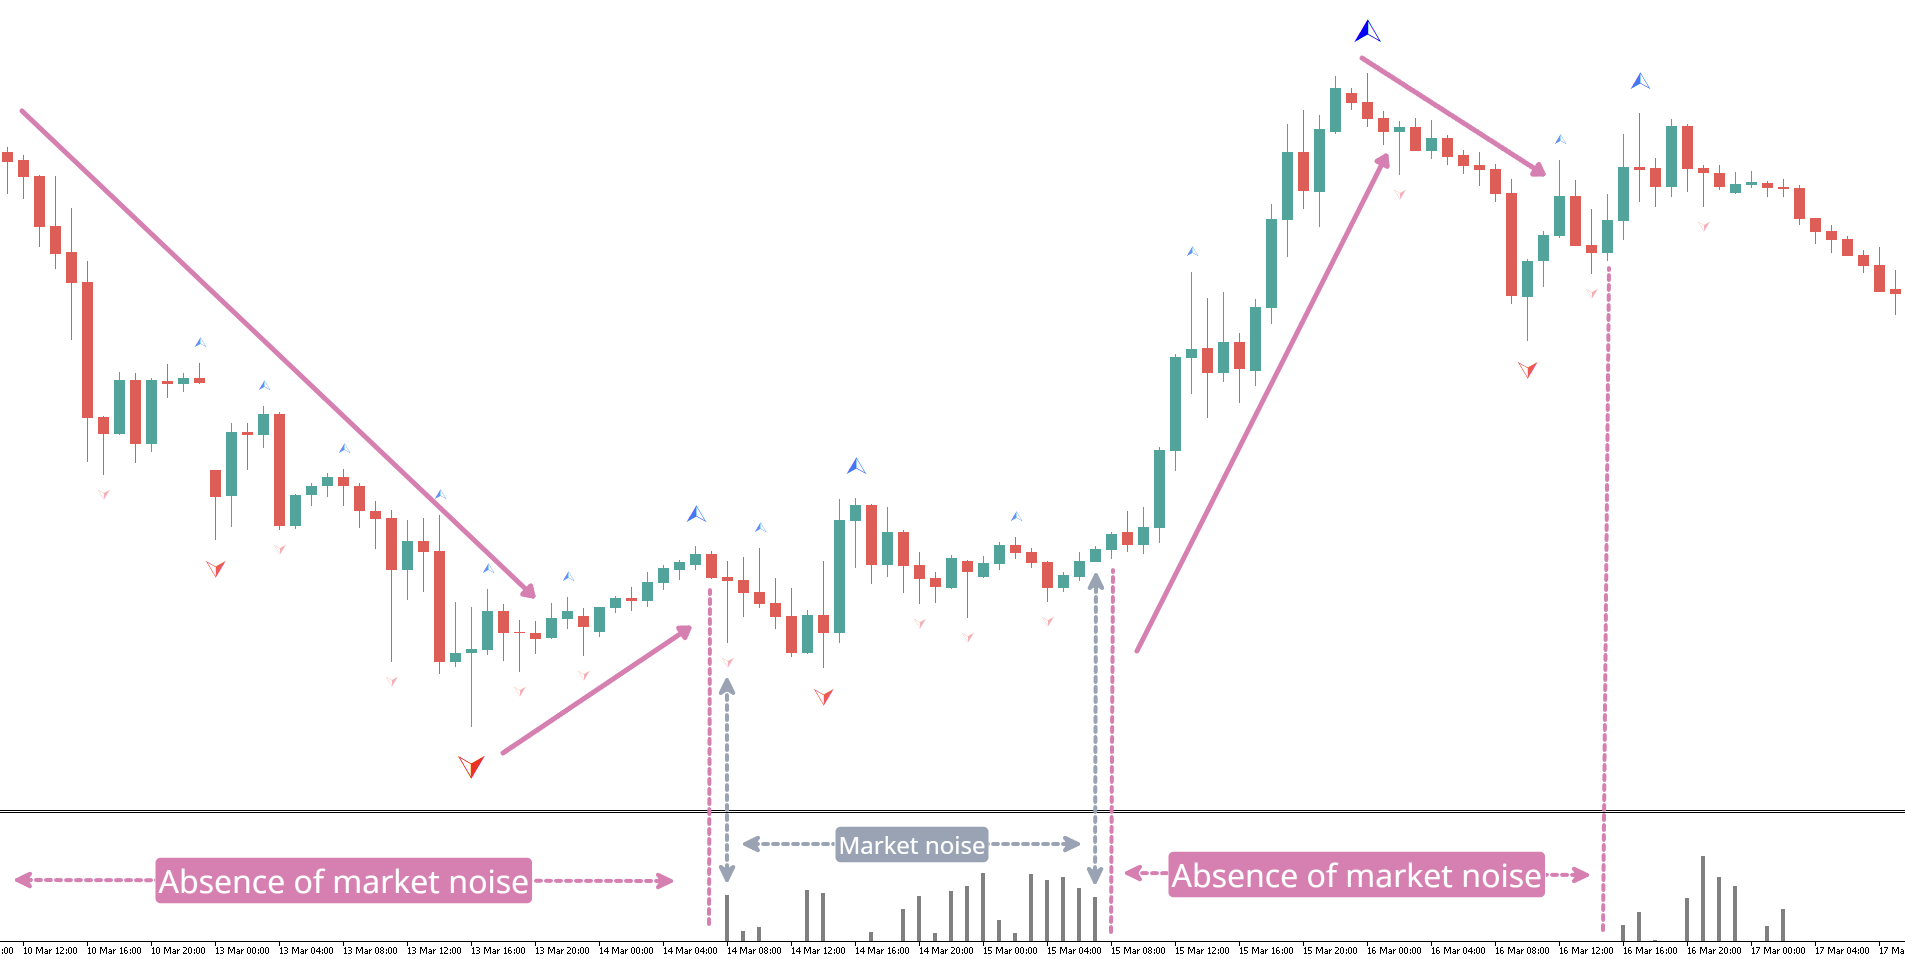
Her aşama kendi ticaret türü için iyidir: trendi takip eden sistemler için trend, agresif sistemler için ise yatay. Piyasa gürültüsü başladığında işlemlerden çıkmaya karar verebilirsiniz. Aynı şekilde ve tam tersi, gürültü biter bitmez agresif ticaret sistemlerini kapatmanız gerekir. Birisi her iki ticaret stratejisi türünden birini diğerine geçerek ticaret yapabilir. Bu nedenle bu gösterge, ticaret kararları alanında iyi bir yardımcı rolü oynar. Herhangi bir fiyat hareketi iki bileşene ayrılabilir: seçilen bir zaman dilimindeki genel fiyat hareketi ve bu dönemdeki fiyat dalgalanmaları şeklindeki gürültü. Aynı zamanda, farklı zaman dilimlerindeki farklı pazarlar, gürültü ve trend bileşenleri arasında çok çeşitli karşılıklı ilişkiler sergileyebilmektedir (Şekil 1). Fiyat hareketlerindeki gürültü düzeyi ne kadar yüksek olursa, altta yatan eğilimin yönünü ve gücünü ayırt etmek o kadar zor olur. Dolayısıyla bu durumda daha yavaş trend belirleme yöntemlerinin kullanılması gerekmektedir. Öte yandan, düşük gürültü seviyesine sahip piyasalarda, ana trend oldukça kolay bir şekilde belirlenir ve trendleri belirlemenin daha hızlı yöntemleri makul olup, fiyat yönündeki değişikliklerden kaynaklanan ticaret sinyallerinin minimum gecikmesini sağlar. Piyasanın durumunu belirlemek için, toplam fiyat hareketi ile gürültü piyasası hareketlerinin toplamının belirli bir dönemde üstel olarak karşılaştırılmasına dayanan gelişmiş verimlilik oranı (ER) kullanılır.Verimlilik oranı (ER) değişiklik gösterebilir. 0'dan 1'e. Piyasada yönsel bir hareket olmadığında, yalnızca gürültü olduğunda ER değeri sıfır olacaktır. Piyasa tek yönde hareket ettiğinde ve gürültünün tamamen yokluğunda ER değeri bire eşit olacaktır.
Avantajları
- Trend ticaret sistemleri için net bir trend tanımlamak
- Agresif sistemler (ızgaralar, ortalama alma, martingale, oturma) veya yüksek SL ve düşük TP'li ticaret sistemleri için düz belirleme
- Az sayıda ayar - yalnızca çubuk cinsinden hesaplama süresi
Ticaret sisteminize ek olarak Piyasa Gürültüsü göstergesini kullanın
МТ5 - https://www.mql5.com/ru/market/product/107899
Piyasadaki diğer ürünlerimi de deneyin https://www.mql5.com/ru/users/capitalplus/seller
Ticarette size büyük kazançlar diliyorum!
Kullanıcı incelemeye herhangi bir yorum bırakmadı
Considering the calculation cycles, filtering, and the current platform - this indicator is slightly more complex than regular oscillators, which is why it is so different with your fast work.