Fractals Dynamic
- Göstergeler
- Ivan Butko
- Sürüm: 1.0
Fractals Dynamic
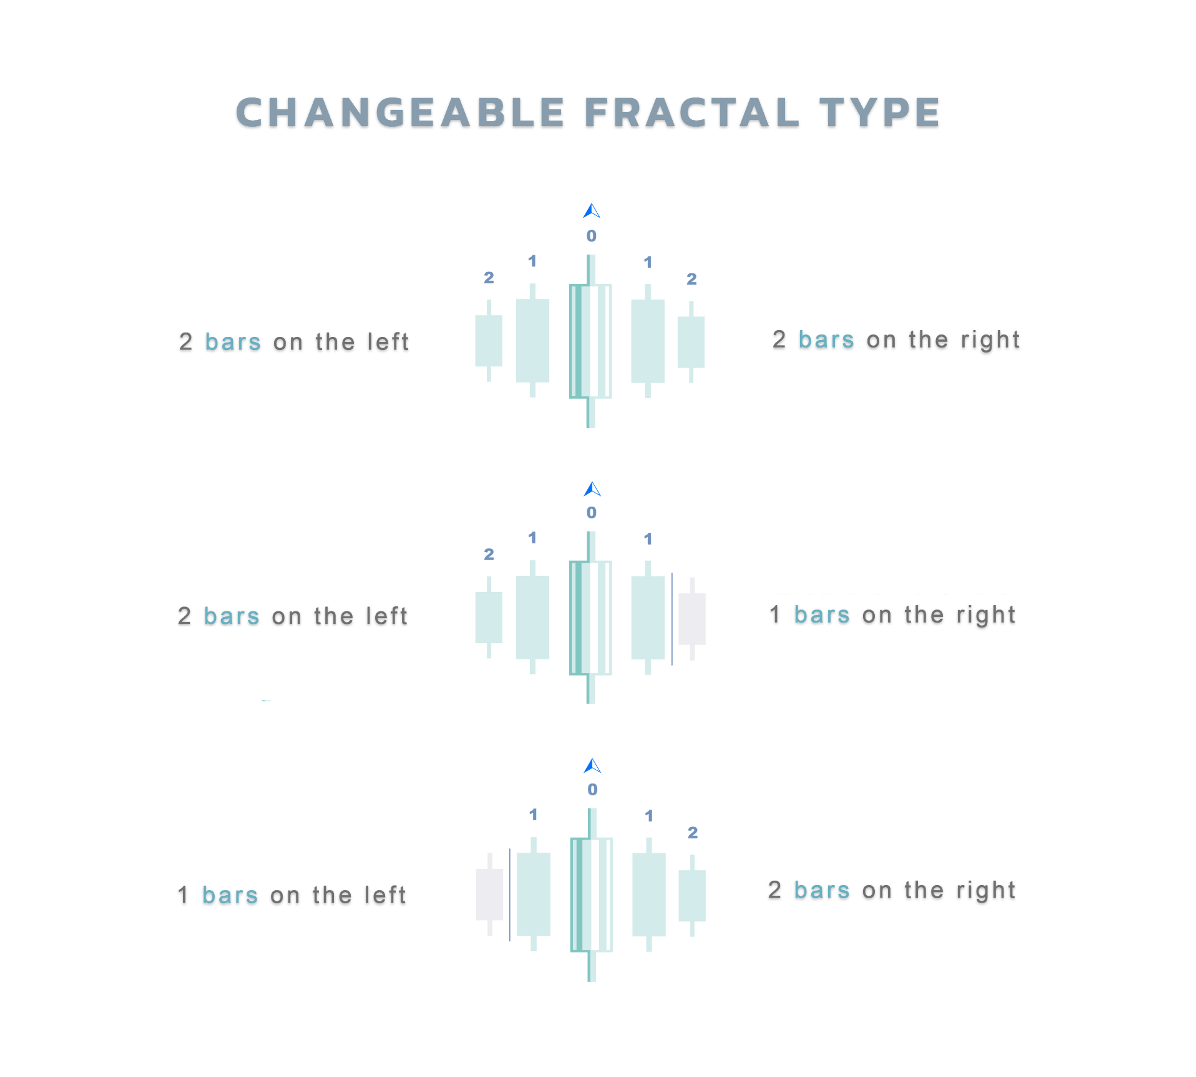
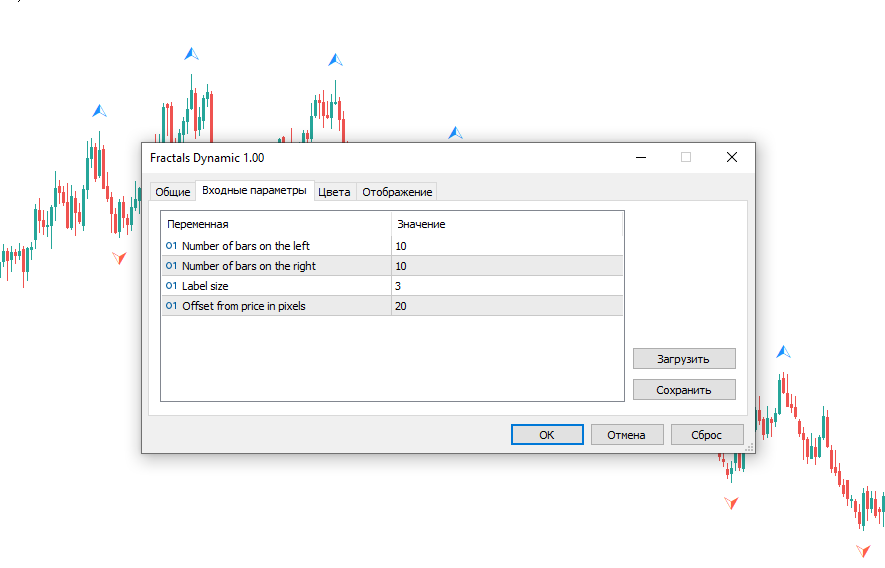
Fractals Dynamic – sol ve sağdaki çubukların sayısını manuel olarak ayarlayabileceğiniz ve böylece grafikte benzersiz desenler oluşturabileceğiniz, Bill Williams tarafından değiştirilmiş bir serbest fraktal göstergedir.
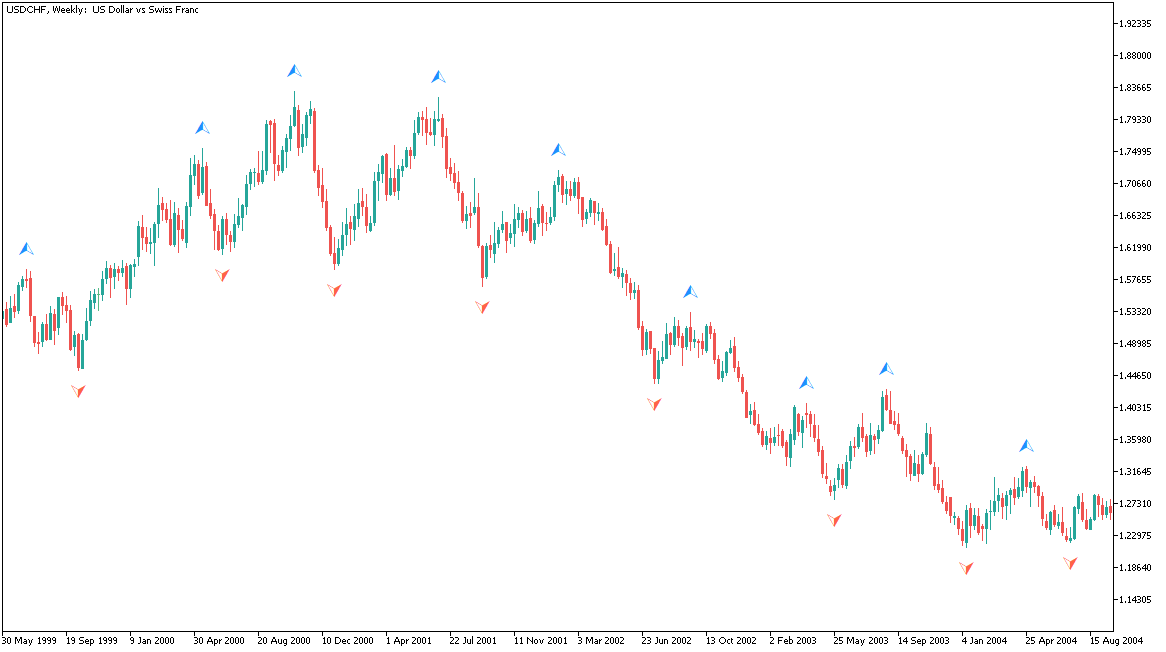
Artık Fraktallar Dinamik göstergesine dayanan veya temelinde bulunan tüm ticaret stratejilerinin ek bir sinyali olacaktır.
Ek olarak, fraktallar destek ve direnç seviyeleri olarak hareket edebilir. Ve bazı ticaret stratejilerinde likidite seviyelerini gösterin. Bu amaçla, multifraktal ve multifrayframe göstergesinin bu versiyonunda MultiFractal Levels seviyeleri tanıtıldı.
Fractals Dynamic göstergesini ticaret sisteminize ek olarak kullanın
Piyasadaki diğer ürünlerimi de deneyin https://www.mql5.com/ru/users/capitalplus/seller
Ticarette size büyük kazançlar diliyorum!


Nice way to see the fractals.