RC ATR Based Trendlines MT5
- Göstergeler
- Francisco Rayol
- Sürüm: 2.0
- Güncellendi: 18 Ekim 2024
This indicator is the converted Metatrader 5 version of the TradingView indicator "ATR Based Trendlines - JD" by Duyck.
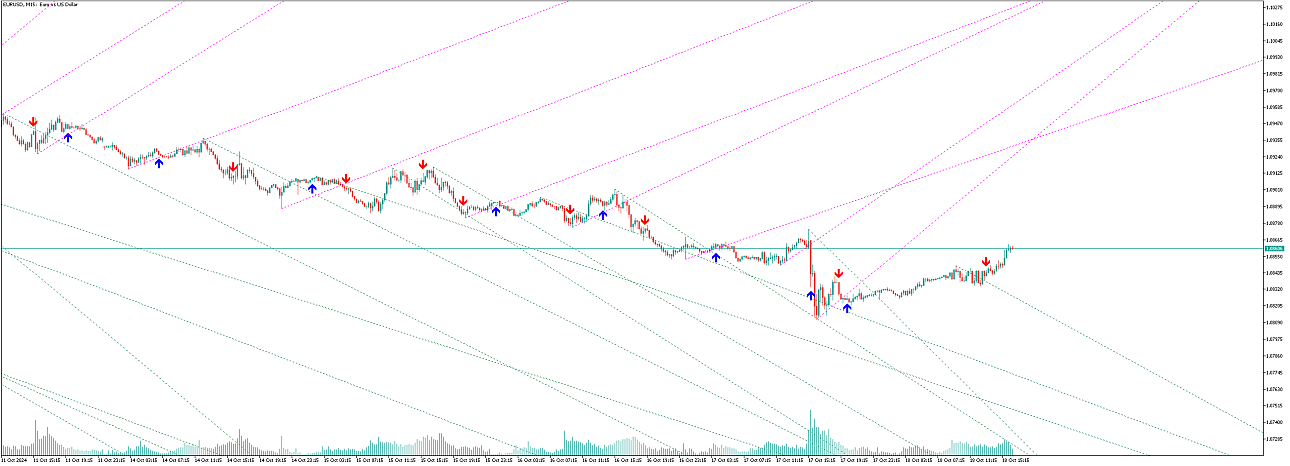
This indicator works by automatically and continuously drawing trendlines not based exclusively on price, but also based on the volatility perceived by the ATR. So, the angle of the trendlines is determined by (a percentage of) the ATR.
The angle of the trendlines follows the change in price, dictated by the ATR at the moment where the pivot point is detected. The ATR percentage determines if the trendline follows the rate of change of the ATR or a fraction (value < 100) or a multiple (value > 100) of that.
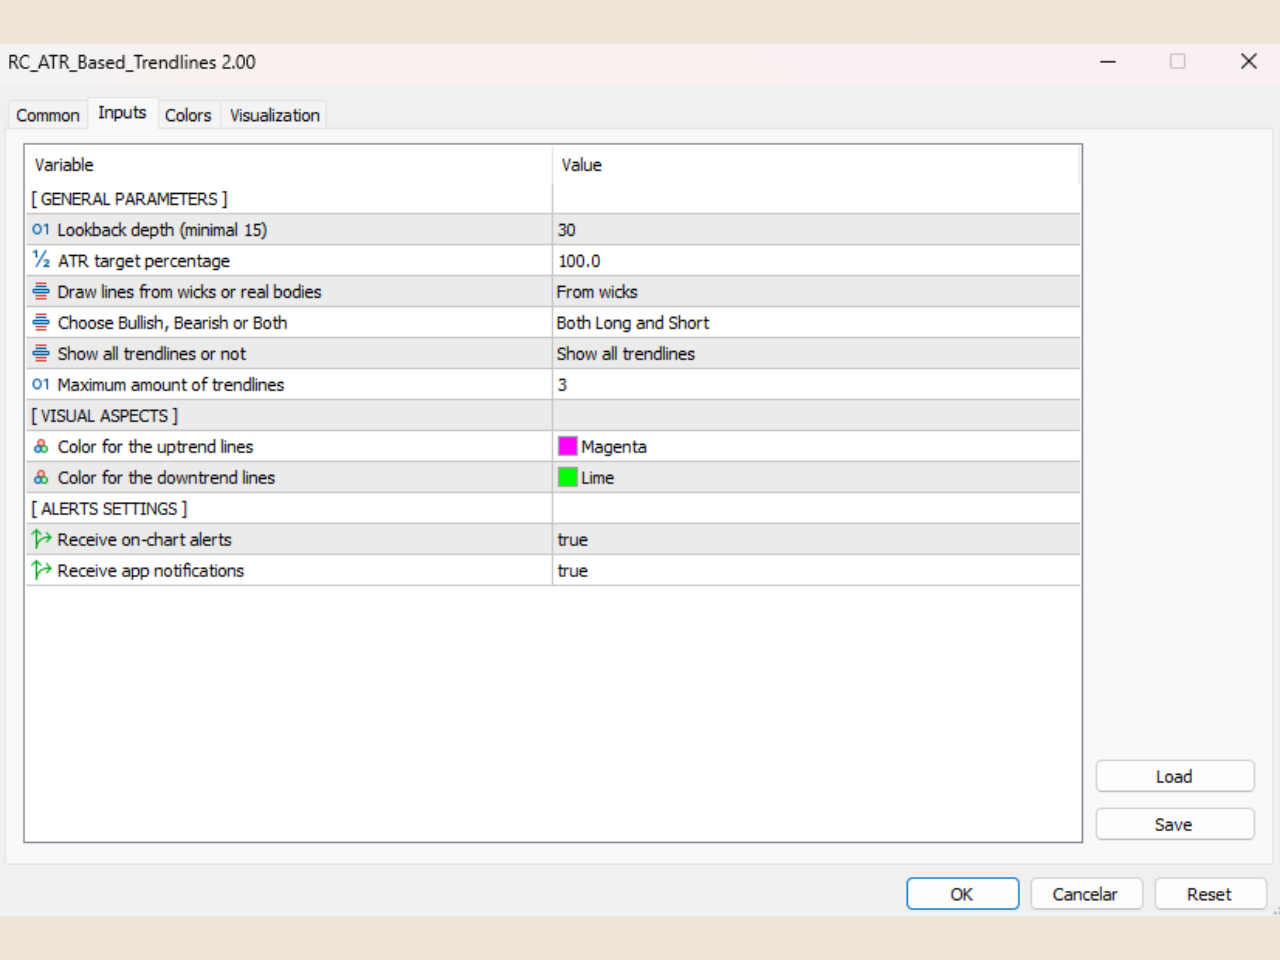
Input parameters
- Lookback depth: Define how many candles to check the occurrence of pivots
- ATR target percentage: Set the sensitivity of the ATR effect in the direction of the trendline
- Draw lines from wicks or real bodies: Define whether the calculation of pivots and ATR should use real bodies or wicks
- Choose Bullish, Bearish or Both trendlines direction
- Show all trendlines or not
- Maximum amount of trendlines (when option 'Show all trendlines' is set false)
- Color for the uptrend lines: Set the colors for the uptrend lines
- Color for the downtrend lines: Set the colors for the downtrend lines
- Receive on-chart alerts
- Receive app notifications
How to trade using this indicator:
The trading strategy combines two indicators created by me to confirm the trade entries, the RC ATR Based Trendlines and the RC ATR Volatility Hedge Zones. The key principle is that both indicators must align for a trade to be initiated. Here are the steps:
-
Trendline Detection: The RC ATR Based Trendlines identify key bullish or bearish trendlines based on ATR calculations, indicating potential price movements and reflecting broader market trends with accuracy.
-
Confirmation via Volatility Hedge Zones: Once a trendline forms, the RC ATR Volatility Hedge Zones must confirm it.
- For a bullish trendline, a bullish signal should appear above the trendline.
- For a bearish trendline, a bearish signal should appear below it. This ensures the trend and volatility are aligned.
-
Trade Execution: Only open a trade after both the trendline signal and confirmation from the Volatility Hedge Zones are received, filtering out false signals and improving trade success probability.
Disclaimer
By purchasing and using this indicator, users agree to indemnify and hold harmless its author from any and all claims, damages, losses, or liabilities arising from the use of the indicator. Trading and investing carry inherent risks, and users should carefully consider their financial situation and risk tolerance before using this indicator.