• Genel bakış
  • İncelemeler
  • Yorumlar

Important daily levels

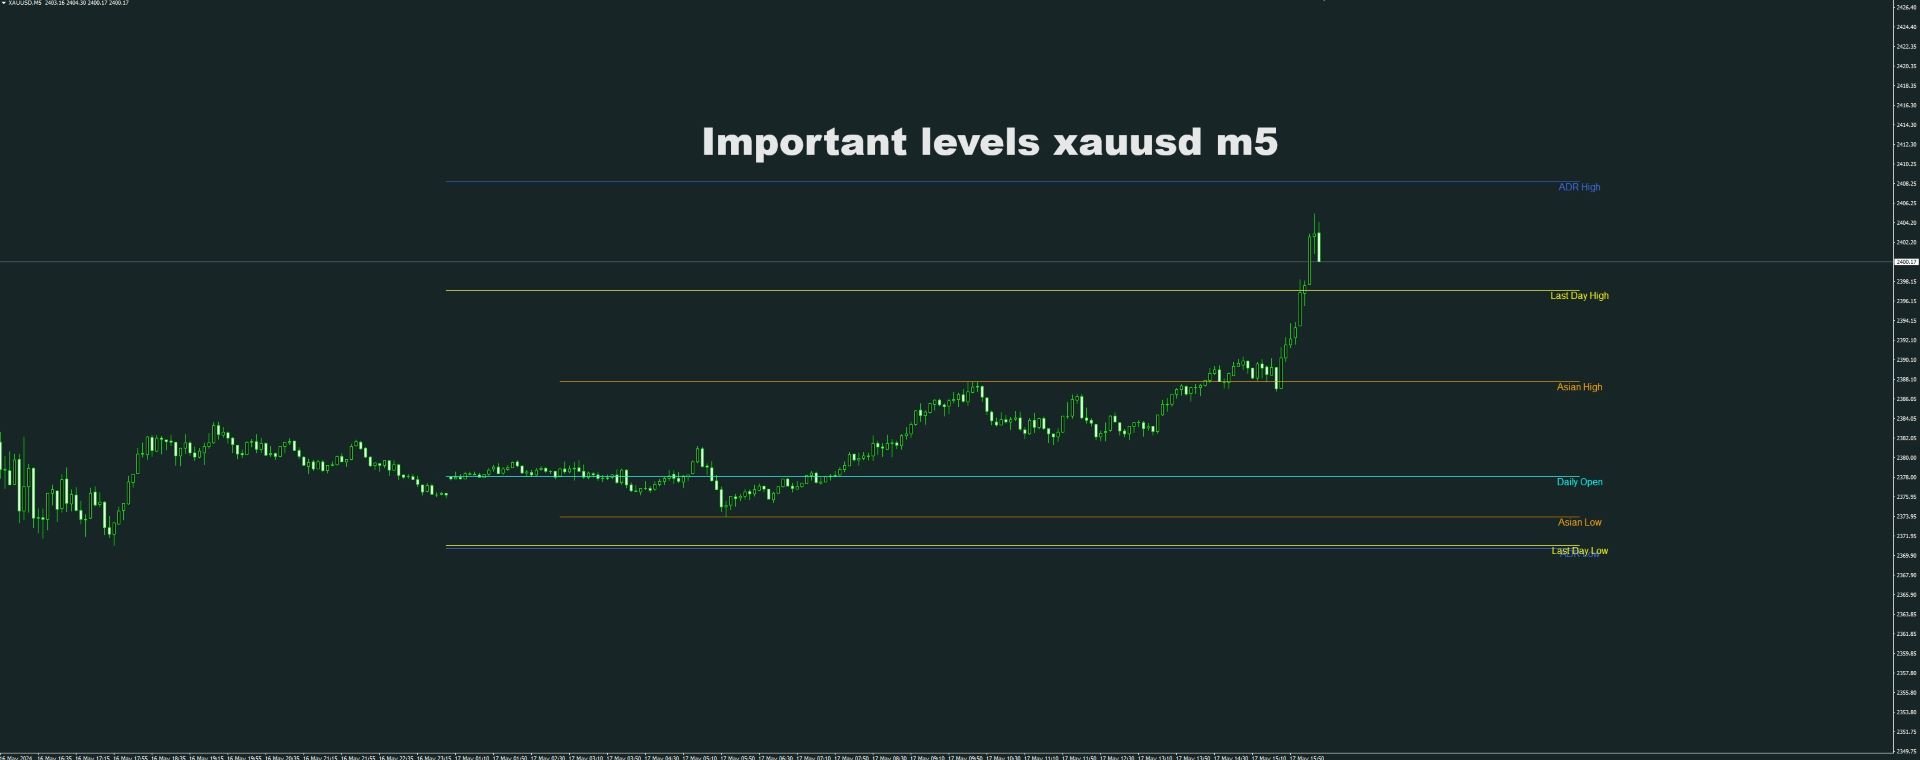
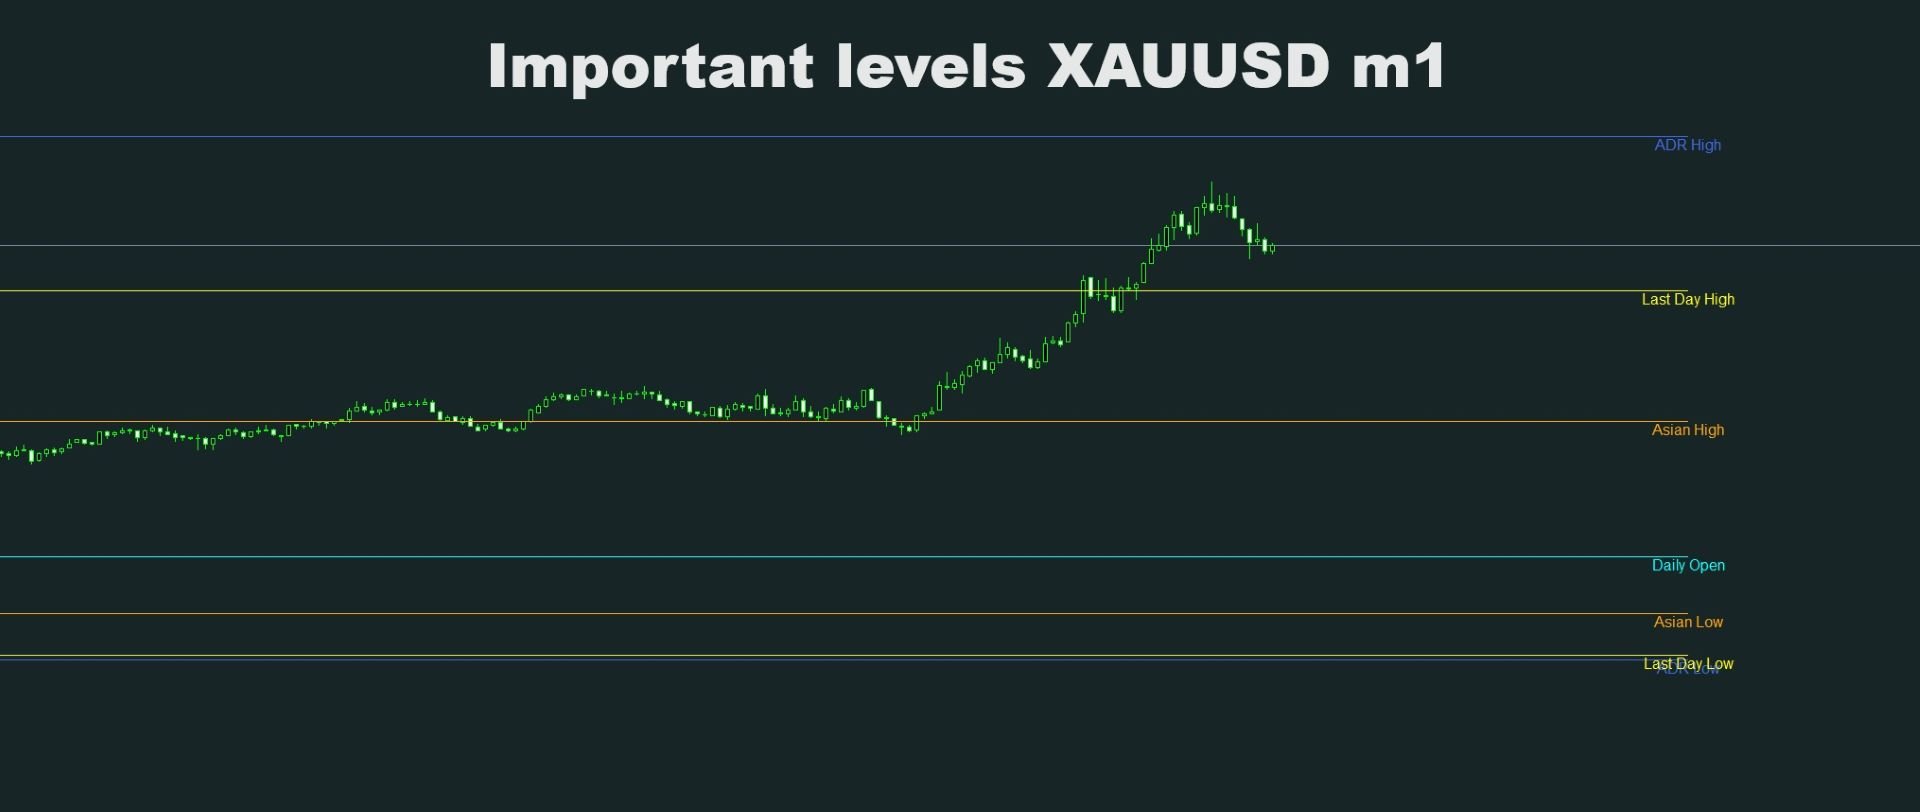
Bu gösterge size aşağıdaki seviyeleri çizecektir:

Günlük açık hat: aşağıda ayı piyasası var, yukarıda ise yükseliş var.
Ortalama günlük aralık yüksek ve düşük
Asya piyasası yüksek ve düşük
Dünün en yüksek ve en düşük seviyeleri
Bu seviyeler herkesin dikkat etmesi gereken güçlü destek ve direnç seviyeleridir.

Başlamak için zamanını kullanmadıysanız! Fiyat bu seviyelere yaklaşırken dikkat etmeniz gerekiyor!

Kolaylaşan ticaretin tadını çıkarın!
Önerilen ürünler
Major Support and Resistance Indicator
Ahmad Ar Abedalaziz Alazaizeh
5 (1)
This indicator filters the Zigzag indicator to calculate the main support and resistance levels. Variables minimum gap between peaks : is the distance (GAP) between the peaks of the Zigzag peaks sensitivity : Minimum number of nearby peaks look back: it means that it has to test the last 50 peaks in the Zigzag object name perfix: a prefix for level’s line name on chart
FREE
You can find full version here: Harmonic Pattern Scanner MT4 Harmonic Pattern Scanner MT5 Introduction Harmonic Patterns are best used to predict turning point. Harmonic Patterns give you high win rate and high opportunities for trade in during one day. This indicator detects the best and successful patterns base on   Harmonic Trading   books by   Mr. Scott M.. Main Features Detect the best and     most successful patterns : Gartley, Bat, Crab, Butterfly, Cypher, Shark, Alt_Bat, Deep_Crab Easy-
FREE
BeST_ Classic Pivot Points is an MT4 Indicator that is based on the widely known and definitely classic Pivot Point of a market prices activity. A pivot point is calculated as an average of significant prices (high,low,close) from the performance of a market in the prior trading period. If the market in the following period trades above the pivot point it is usually evaluated as a bullish sentiment, whereas trading below the pivot point is seen as bearish. A pivot point and the associated suppo
FREE
ZigZag Fibo Retracement Indicator Optimize Your Trading Strategy! Are you seeking to optimize your trading strategy in the financial markets? Explore the unique features of the ZigZag Fibo Retracement Indicator, a powerful tool designed to help you identify potential support and resistance levels based on the combination of ZigZag patterns and Fibonacci ratios. Integration of ZigZag Patterns and Fibonacci: The ZigZag Fibo Retracement Indicator combines the effectiveness of ZigZag patterns, helpi
FREE
Limit Map AM
Andriy Matviyevs'kyy
This indicator is a system of channels based on the minimum and maximum price values. The task of the indicator is to visualize the trend direction and support/resistance lines. The indicator is designed to be used in combination with indicators of the "Signal" or "Candles" series (a lot of free indicators of this type can be found on my page). At the same time, the indicator can be used independently according to the following rules: Buy/Sell signals are used to open a position only in the dire
FREE
VWAP Level
Francesco Lenza
4.8 (10)
The VWAP Level indicator is a technical analysis tool that calculates the weighted average price for the traded volumes of a specific asset. The VWAP provides traders and investors with the average price of an asset over a specific time frame. It is commonly used by investors to compare data on "passive" trading operations, such as pension funds and mutual funds, but also by traders who want to check if an asset has been bought or sold at a good market price. To calculate the VWAP level we
FREE
Description: This indicator draw ZigZag Line in multiple time frame also search for Harmonic patterns before completion of the pattern. Features: Five instances of ZigZag indicators can be configured to any desired timeframe and inputs. Draw Harmonic pattern before pattern completion. Display Fibonacci retracement ratios. Configurable Fibonacci retracement ratios. Draw AB=CD based on Fibonacci retracement you define. You can define margin of error allowed in Harmonic or Fibonacci calculatio
FREE
5/35 Oscillator to be used with our Elliott Wave Indicator as part of the overall strategy on trading the 5th wave. The Elliott Wave Indicator Suite is designed around a simple but effective Swing Trading Strategy. The Indicator Suite is great for Stocks, Futures and Forex trading on multiple timeframes You can find the main Elliott Wave Indicator here  https://www.mql5.com/en/market/product/44034
FREE
This indicators automatically draws the   support and resistances   levels (key levels) for you once you've dropped it on a chart. It reduces the hustle of drawing and redrawing these levels every time you analyse prices on a chart. With it, all you have to do is drop it on a chart, adjust the settings to your liking and let the indicator do the rest. But wait, it gets better; the indicator is absolutely free! For more information:  https://youtu.be/rTxbPOBu3nY For more free stuff visit:  https
FREE
Basic Harmonic Pattern
Mehran Sepah Mansoor
4.64 (61)
Bu gösterge, piyasanın tersine dönme noktalarını tahmin eden en popüler Harmonik Kalıpları tanımlar. Bu harmonik modeller, forex piyasasında sürekli tekrar eden ve gelecekteki olası fiyat hareketlerini öneren fiyat oluşumlarıdır / Ücretsiz MT5 Sürümü Buna ek olarak, bu gösterge yerleşik bir piyasaya giriş sinyalinin yanı sıra çeşitli kar alma ve zararı durdurma sinyallerine de sahiptir. Harmonik formasyon göstergesi kendi başına al/sat sinyalleri sağlayabilse de, bu sinyallerin diğer teknik g
FREE
Free automatic Fibonacci is an indicator that automatically plots a Fibonacci retracement based on the number of bars you select on the BarsToScan setting in the indicator. The Fibonacci is automatically updated in real time as new highest and lowest values appears amongst the selected bars. You can select which level values to be displayed in the indicator settings. You can also select the color of the levels thus enabling the trader to be able to attach the indicator several times with differe
FREE
Индикатор реализован для определения классического канала движения цены, который используется на крупных биржевых площадках. Не перерисовывается Синий уровень - это уровень поддержки  Красный уровень - это уровень сопротивления  Белый уровень - является Pivot-уровнем  Настройки Period_SEC  - ввод  значения периода . Примечание:  Индикатор определяет уровни только на пятизначных котировках! Метод торговли:  Открытие позиций осуществляется от уровней , именно на их значениях происходит отскок цены
FREE
PZ Penta O MT4
PZ TRADING SLU
2.25 (4)
The Penta-O is a 6-point retracement harmonacci pattern which usually precedes big market movements. Penta-O patterns can expand and repaint quite a bit. To make things easier this indicator implements a twist: it waits for a donchian breakout in the right direction before signaling the trade. The end result is an otherwise repainting indicator with a very reliable trading signal. The donchian breakout period is entered as an input. [ Installation Guide | Update Guide | Troubleshooting | FAQ | A
FREE
Peak Trough Analysis is the great tool to detect peaks and troughs in your chart. Peak Trough Analysis tool can use three different peaks and troughs detection algorithm. The three algorithm include the orignal Fractals Indicator by Bill Williams, the Modified Fractals indicator and ZigZag indicator. You can use this peak and trough analysis tool to detect the price pattern made up from Equilibrium Fractal-Wave process. For further usage, there are good guide line on how to use this peak trough
FREE
This is a Multi-Time-Frame Zigzag indicator You can change parameters of Zigzag, include Zigzag Depth, Zigzag Deviation, Zigzag Backstep. You can choose which Time Frame to display Zigzag by turn ShowXXX to true or false (ShowXXX = ShowM1, ShowM5, ShowM15...). Noted: Lower Time Frame Zigzag will not display on Higher Time Frame. Example: Your current Time Frame is H1, you can not see Zigzag of M1 to M30 even you turn them on.
Necessary for traders: tools and indicators Waves automatically calculate indicators, channel trend trading Perfect trend-wave automatic calculation channel calculation , MT4 Perfect trend-wave automatic calculation channel calculation , MT5 Local Trading copying Easy And Fast Copy , MT4 Easy And Fast Copy , MT5 Local Trading copying For DEMO Easy And Fast Copy , MT4 DEMO Easy And Fast Copy , MT5 DEMO The homeopathic indicator is also called the CCI indicator. The CCI indicator was propos
FREE
UPD1 Fibo Levels
Vitaliy Kuznetsov
5 (3)
Gösterge, belirtilen mum sayısını analiz eder ve maksimum-minimuma dayalı Fibonacci seviyeleri oluşturur. Seviyeler yeniden inşa edildiğinden, aralığın sağ tarafıyla ilgileniyoruz. Fiyat seviyelere manyetiktir ve bir dokunuşa tepki verir. Bir düzeltmeden sonra bir trend giriş noktası bulmak için bu aracı kullanın. Sol tarafta seviyelerin mükemmel bir şekilde yükseldiğini görürsek, hareketin sonunu en uç noktada bulduğumuzu varsayabiliriz. Tüm çizgiler tamponlar veya nesneler (seçiminiz) aracılığ
FREE
ScalperX
Mustafa Sabir
First of all, it is worth highlighting here that this Trading Indicator is Non Repainting, Non Redrawing and Non Lagging, which makes it ideal for manual trading. Never repaint and recalculate Once an arrow appears it never disappears, the signal comes at the opening of the new candle You will now be more profitable with this indicator You can do swing trading or scalping trading The indicator helps you identify the trend Can be optimized across all pairs and time frames Blue arrow is for buyin
FREE
Basic Fibonacci Calculation Indicator  shows Trend, Stoploss, Profit 1,2,3, will show you your daily Highs and your Daily Lows , it will also show you where it expects the price to move to.  best time frame is H1 or higher .  For  a better system that also includes my Non-repaint Indicator please check out my paid Fibo Indicator  https://www.mql5.com/en/market/product/82323
FREE
Download the free version   here. Divergence Divergence refers to when the price of a currency pair moves in one direction while the trend indicator is moving in the opposite direction. With divergence, there can be positive and negative signals. Divergences in Forex trading are quite common signals of technical analysis. These are basic early Forex signals indicating the trend reversal and filter false signals. Application of this indicator It is usually not easy to detect divergences by the t
FREE
Double Price Channel   Price channel indicator for a certain number of bars specified in the settings. Indicator lines represent dynamic support or resistance levels. The upper limit is the price maximum for a certain number of periods, the lower one is the minimum. Unlike moving averages, which are based on close prices, the indicator is not “distracted” by small fluctuations. It will be recalculated only if the boundaries change. If the latter happens, then it is worth seriously thinking abou
FREE
Trend arrow Indicator
NGUYEN NGHIEM DUY
3.23 (13)
Trend arrow Indicator is an arrow Indicator used as an assistant tool for your trading strategy. The indicator analyzes the standard deviation of bar close for a given period and generates a buy or sell signals if the deviation increases. It good to combo with Martingale EA to follow Trend and Sellect Buy Only/Sell Only for EA work Semi-Automatic. You can use this  Indicator with any EAs in my Products.
FREE
Gold Indicator
Ahmed Alaaeldin Abdulrahman Ahmed Elherzawi
5 (1)
This indicator uses horizontal lines to identify support and resistance levels based on Zigzag legs and On-Balance Volume (OBV) analysis. Here is a summary of how the indicator works: Resistance and Support Lines : A horizontal line above the current price level indicates resistance. A horizontal line below the current price level indicates support. Drawing Horizontal Lines : Draw horizontal lines on every Zigzag leg within the last X legs, where X is a specified number (e.g., 10). Only the most
FREE
Destek ve Direnç Seviyeleri Bulucu: Destek ve Direnç Seviyeleri Bulucu, ticarette teknik analizi geliştirmek için tasarlanmış gelişmiş bir araçtır. Dinamik destek ve direnç seviyeleriyle donatılmış olup, yeni anahtar noktalar grafikte ortaya çıktıkça gerçek zamanlı olarak adapte olur ve böylece dinamik ve tepkisel bir analiz sunar. Benzersiz çoklu zaman dilimi yeteneği, kullanıcıların istedikleri zaman diliminde farklı zaman dilimlerinden destek ve direnç seviyelerini göstermelerine olanak ta
FREE
We Trade Live Trend Levels
Ian Andrew Nicholson
5 (4)
We Trade Live Trend Levels  This indicator is a fantastic addition to the We Trade Live Trend Max this helps filter out noise and helps with better entries into a trade this add on is a must have and we use it all the time along side We Trade Live Trend Max this is a fantastic tool to help with entering a trade and exiting a trade,  This indicator Calculates  Volume strength  indicating levels of support and resistance for a trade, measures momentum in a market making buying or selling into the
FREE
WPR LB bar AM
Andriy Matviyevs'kyy
The indicator identifies the strength of the trend based on the points where the WPR indicator exceeds the overbought and oversold levels. The indicator does not redraw. This indicator: Suitable for all markets;  Not redrawn; Intuitive and simple; It can be useful for both beginners and experienced traders; Allows you to identify market entry points where there is a high probability of a significant price movement sufficient for a successful transaction; Settings: Ind_Period (>1)   - period of
FREE
RSI Bands MT4
Pierce Vallieres
RSI Bands is a powerful indicator which displays an upper and lower band corresponding to the RSI overbought and oversold levels. The band shows what price must be reached during that specific candle in order for the RSI overbought/oversold level to be reached. This is an extremely useful tool for spotting when a trend has begun and when a trend is about to end. The indicator provides buffers, allowing you to use it in your own Expert Advisor. Please message me if you have any questions. CURRE
FREE
TrendPlus
Sivakumar Subbaiya
4.21 (14)
Trend Plus   Trendplus  Indicator   Time Frame: Suitable for any time frame.  Purpose: Trend Prediction. Blue and red candle indicate the buy and sell call respectively. Buy: When the blue candle is formed buy call is initiated. close the buy trades when the next red candle will formed.   Sell: When the Red candle is formed Sell call is initiated. close the Sell trades when the next blue candle will formed.   Happy trade!!
FREE
SR indicator
Alexander Chertnik
SR is a support and resistance indicator, it shows major highs and lows by different colors. The color of a level is changing if the last high or low are touching it. After the closing of a bar above or below level, it will delete it. extern inputs: loop for candles / colors / drawing time *This indicator signal is not perfect and have to be used with other market analysis and confirmations.
FREE
Description The base of this indicator is an ZigZag algorithm based on ATR and Fibo retracement. This indicator is not redrawing in sense that the ZigZag's last shoulder is formed right after the appropriate conditions occur on the market. The shoulder doesn't change its direction afterwards (can only continue). Note:  An indicator with advanced possibilities is also available. Indicator input parameters The input parameters allow to change the sensitivity of the ZigZag. ATR period ATR mul
FREE
Bu ürünün alıcıları ayrıca şunları da satın alıyor
Gann Made Easy
Oleg Rodin
4.92 (77)
Gann Made Easy , bay teorisini kullanarak ticaretin en iyi ilkelerine dayanan, profesyonel ve kullanımı kolay bir Forex ticaret sistemidir. WD Gann. Gösterge, Zararı Durdur ve Kâr Al Seviyeleri dahil olmak üzere doğru SATIN AL ve SAT sinyalleri sağlar. PUSH bildirimlerini kullanarak hareket halindeyken bile işlem yapabilirsiniz. Lütfen satın aldıktan sonra benimle iletişime geçin! Alım satım ipuçlarımı ve harika bonus göstergelerini ücretsiz olarak sizinle paylaşacağım! Muhtemelen Gann ticaret y
TPSpro RFI Levels
Roman Podpora
4.85 (20)
Reversal First Impulse levels (RFI)    INSTRUCTIONS        RUS       -       ENG              R ecommended to use with an indicator   -   TREND PRO -  Version MT5 A key element in trading is zones or levels from which decisions to buy or sell a trading instrument are made. Despite attempts by major players to conceal their presence in the market, they inevitably leave traces. Our task was to learn how to identify these traces and interpret them correctly. Main functions: Displaying active zones
Atomic Analyst
Issam Kassas
5 (3)
Öncelikle belirtmek gerekir ki bu Ticaret Göstergesi Yeniden Çizim Yapmaz, Gecikmez ve Gecikme Göstermez, bu da hem manuel hem de robot ticareti için ideal hale getirir. Kullanıcı kılavuzu: ayarlar, girişler ve strateji. Atom Analisti, Piyasada Daha İyi Bir Avantaj Bulmak İçin Fiyatın Gücünü ve Momentumunu Kullanan PA Fiyat Hareketi Göstergesidir. Gürültüleri ve Yanlış Sinyalleri Kaldırmaya ve Ticaret Potansiyelini Artırmaya Yardımcı Olan Gelişmiş Filtrelerle Donatılmıştır. Birden fazla katma
Gold Stuff
Vasiliy Strukov
4.89 (262)
Gold Stuff, özellikle altın için tasarlanmış bir trend göstergesidir ve herhangi bir finansal enstrümanda da kullanılabilir. Gösterge yeniden çizilmez ve gecikmez. Önerilen zaman dilimi H1. Bu göstergede tam otomatik Uzman Danışman EA Gold Stuff çalışır. Profilimde bulabilirsiniz. Ayarları ve kişisel bir bonusu almak için satın alma işleminden hemen sonra benimle iletişime geçin!  Güçlü Destek ve Trend Tarayıcı göstergemizin ücretsiz bir kopyasını pm'den alabilirsiniz. Ben! AYARLAR Ok Ç
TPSproTREND PrO
Roman Podpora
4.78 (18)
TPSpro TRENDPRO  - is a trend indicator that automatically analyzes the market and provides information about the trend and each of its changes, as well as giving signals for entering trades without redrawing! The indicator uses each candle, analyzing them separately. referring to different impulses - up or down impulse. Exact entry points into transactions for currencies, crypto, metals, stocks, indices!  -  Version MT5               DETAILED DESCRIPTION                R ecommended to use with
Trend Punch
Mohamed Hassan
5 (14)
Manual guide:   Click here WEEKEND SALE PROMO:   $65 ONLY!  -- Next price is  $120 .  This indicator is unstoppable when combined with our other indicator called  Support & Resistance . After purchase, send us a message and you will get it   for  FREE as a BONUS! I like to use Trend Punch on XAUUSD on the M1 timeframe & higher ones!  Introducing Trend Punch , the revolutionary forex trend indicator that will transform the way you trade! Trend Punch is uniquely designed to provide
ŞU ANDA %26 INDIRIMLI Yeni Başlayanlar veya Uzman Tüccarlar için En İyi Çözüm! Bu Gösterge benzersiz, yüksek kaliteli ve uygun fiyatlı bir ticaret aracıdır çünkü bir dizi tescilli özellik ve yeni bir formül ekledik. Sadece BİR grafik ile 28 Forex çifti için Döviz Gücünü okuyabilirsiniz! Yeni bir trendin veya scalping fırsatının tam tetik noktasını belirleyebildiğiniz için ticaretinizin nasıl gelişeceğini hayal edin? Kullanım kılavuzu: buraya tıklayın Bu ilk olan, orijinal! Değersiz bir
Scalper Inside PRO
Alexey Minkov
4.74 (58)
An exclusive indicator that utilizes an innovative algorithm to swiftly and accurately determine the market trend. The indicator automatically calculates opening, closing, and profit levels, providing detailed trading statistics. With these features, you can choose the most appropriate trading instrument for the current market conditions. Additionally, you can easily integrate your own arrow indicators into Scalper Inside Pro to quickly evaluate their statistics and profitability. Scalper Inside
Legacy of Gann
Pavel Zamoshnikov
4.83 (12)
The indicator very accurately determines the levels of the possible end of the trend and profit fixing. The method of determining levels is based on the ideas of W.D.Gann, using an algorithm developed by his follower Kirill Borovsky. Extremely high reliability of reaching levels (according to K. Borovsky  - 80-90%) Indispensable for any trading strategy – every trader needs to determine the exit point from the market! Precisely determines targets on any timeframes and any instruments (forex, met
Fiyat tersine döndükçe ve geri çekildikçe piyasa yapısından elde edilen kâr değişir. Piyasa yapısını tersine çevirme uyarısı göstergesi, bir trendin veya fiyat hareketinin ne zaman tükenmeye yaklaştığını ve tersine dönmeye hazır olduğunu tanımlar. Genellikle bir geri dönüş veya büyük bir geri çekilme meydana gelmek üzereyken meydana gelen piyasa yapısındaki değişiklikler konusunda sizi uyarır. Gösterge, olası bir tükenme noktasının yakınında her yeni yüksek veya düşük oluştuğunda, başlangıçta
Advanced Supply Demand
Bernhard Schweigert
4.92 (313)
CURRENTLY 26% OFF !! Best Solution for any Newbie or Expert Trader! This indicator is a unique, high quality and affordable trading tool because we have incorporated a number of proprietary features and a new formula. With this update, you will be able to show double timeframe zones. You will not only be able to show a higher TF but to show both, the chart TF, PLUS the higher TF: SHOWING NESTED ZONES. All Supply Demand traders will love it. :) Important Information Revealed Maximize the potenti
Şu anda %20 İNDİRİMLİ! Herhangi bir Acemi veya Uzman Tüccar için En İyi Çözüm! Bu gösterge paneli yazılımı 28 döviz çifti üzerinde çalışıyor. Ana göstergelerimizden 2'sine (Gelişmiş Para Birimi Gücü 28 ve Gelişmiş Para Birimi Dürtüsü) dayanmaktadır. Tüm Forex piyasasına harika bir genel bakış sağlar. Gelişmiş Para Birimi Gücü değerlerini, para birimi hareket hızını ve tüm (9) zaman dilimlerinde 28 Forex çifti için sinyalleri gösterir. Trendleri ve / veya scalping fırsatlarını belirlemek içi
M1 Arrow
Oleg Rodin
5 (14)
Piyasanın iki temel ilkesine dayanan bir gün içi stratejisi. Algoritma, ek filtreler kullanarak hacimlerin ve fiyat dalgalarının analizine dayanmaktadır. Göstergenin akıllı algoritması, yalnızca iki piyasa faktörü bir araya geldiğinde bir sinyal verir. Gösterge, daha yüksek zaman çerçevesinin verilerini kullanarak M1 grafiğinde belirli bir aralıktaki dalgaları hesaplar. Ve dalgayı doğrulamak için gösterge, hacme göre analizi kullanır. Bu gösterge hazır bir ticaret sistemidir. Bir tüccarın ihtiya
FX Volume
Daniel Stein
4.6 (35)
Sabah Brifingimiz aracılığıyla ayrıntılar ve ekran görüntüleri ile günlük piyasa güncellemenizi alın burada mql5 ve on Telegram ! FX Volume, bir brokerin bakış açısından piyasa duyarlılığı hakkında GERÇEK bir fikir veren İLK ve TEK hacim göstergesidir. COT raporlarından çok daha hızlı bir şekilde, brokerlar gibi kurumsal piyasa katılımcılarının Forex piyasasında nasıl konumlandıklarına dair harika bilgiler sağlar. Bu bilgileri doğrudan grafiğinizde görmek, ticaretiniz için gerçek oyun değiştir
Enigmera
Ivan Stefanov
5 (3)
ENIGMERA: Pazarın çekirdeği https://www.enigmera.com Giriş Bu gösterge ve ticaret sistemi, finansal piyasalar için dikkate değer bir yaklaşımdır. ENIGMERA, destek ve direnç seviyelerini doğru bir şekilde hesaplamak için fraktal döngüleri kullanır. Gerçek birikim aşamasını gösterir ve yön ve hedefler verir.  İster bir trendde ister bir düzeltmede olalım çalışan bir sistem.  Nasıl çalışır? ENIGMERA üç çizgiden oluşur: destek/direnç çizgisi, hedef çizgisi ve sapma çizgisi. Sistem, geçmiş veril
FX Power MT4 NG
Daniel Stein
5 (11)
Sabah Brifingimiz burada mql5 ve on Telegram! FX Power MT4 NG , uzun zamandır çok popüler olan döviz gücü ölçerimiz FX Power'ın yeni neslidir. Peki bu yeni nesil güç ölçer ne sunuyor? Orijinal FX Power hakkında sevdiğiniz her şey PLUS GOLD/XAU güç analizi Daha da hassas hesaplama sonuçları Ayrı ayrı yapılandırılabilir analiz dönemleri Daha da iyi performans için özelleştirilebilir hesaplama limiti Özel çokluDaha fazlasını görmek isteyenler için örnek ayarlar Her grafikte en sevdiğiniz renkler i
Trend Screener
STE S.S.COMPANY
4.83 (88)
Trend Göstergesi, Trend Alım Satım ve Filtreleme için Çığır Açan Benzersiz Çözüm, Tüm Önemli Trend Özellikleriyle Tek Bir Araç İçinde Yerleştirildi! Forex, emtialar, kripto para birimleri, endeksler ve hisse senetleri gibi tüm sembollerde/araçlarda kullanılabilen %100 yeniden boyamayan çoklu zaman çerçevesi ve Çoklu para birimi göstergesidir. Trend Screener, grafikte noktalarla ok trend sinyalleri sağlayan etkili bir trend trend göstergesidir. Trend analizörü göstergesinde bulunan özellikler: 1.
GOLD Impulse with Alert
Bernhard Schweigert
4.56 (9)
Bu gösterge, 2 ürünümüz Advanced Currency IMPULSE with ALERT  +   Currency Strength Exotics  'in süper bir kombinasyonudur. Tüm zaman dilimleri için çalışır ve 8 ana para birimi artı bir Sembol için grafiksel olarak güç veya zayıflık dürtüsünü gösterir! Bu Gösterge, Altın, Egzotik Çiftler, Emtialar, Endeksler veya Vadeli İşlemler gibi herhangi bir sembol için para birimi gücü ivmesini göstermek için uzmanlaşmıştır. Türünün ilk örneğidir, Altın, Gümüş, Petrol, DAX, US30, MXN, TRY, CNH vb.
TakePropips Donchian Trend Pro
Eric John Pajarillaga Aldana
4.82 (17)
TakePropips Donchian Trend Pro   (MT4), Donchian Kanalı'nı kullanarak trendin yönünü otomatik olarak tespit eden ve size ticarete giriş ve çıkış sinyalleri sağlayan güçlü ve etkili bir araçtır! Bu çok işlevli gösterge, bir trend tarayıcı, ticaret sinyalleri, istatistiksel panel, tarayıcı, ticaret oturumları ve uyarı geçmişi panosu içerir. Size ticaret sinyalleri sağlamak ve çizelgeleri analiz ederek saatlerce tasarruf etmenizi sağlamak için tasarlanmıştır! Kullanım kılavuzunu ve kurulum kılavuzu
Özel MT4 göstergemizle başarılı forex ticaretinin sırrını keşfedin! Forex piyasasında nasıl başarıya ulaşacağınızı hiç merak ettiniz, riski en aza indirirken sürekli olarak kar kazandınız mı? İşte aradığınız cevap! Ticaret yaklaşımınızda devrim yaratacak tescilli MT4 göstergimizi tanıtmamıza izin verin. Benzersiz çok yönlülük Göstergemiz, Renko ve RangeBar Mum oluşumlarını tercih eden kullanıcılar için özel olarak tasarlanmıştır. Bu grafik türlerinin birçok deneyimli tüccar tarafından ter
PRO Renko Sistemi, RENKO grafikleri ticareti için özel olarak tasarlanmış son derece hassas bir ticaret sistemidir. Bu, çeşitli ticaret araçlarına uygulanabilen evrensel bir sistemdir. Sistemi etkin piyasa sana doğru ters sinyallerine erişim hakkı denilen ses nötralize eder. Göstergenin kullanımı çok kolaydır ve sinyal üretiminden sorumlu tek bir parametreye sahiptir. Aracı, seçtiğiniz herhangi bir ticaret aracına ve renko çubuğunun boyutuna kolayca uyarlayabilirsiniz. Yazılımımla karlı b
Öncelikle, bu Ticaret Aracının Non-Repainting, Non-Redrawing ve Non-Lagging Gösterge olduğunu vurgulamakta fayda var, bu da onu profesyonel ticaret için ideal hale getiriyor. Çevrimiçi kurs, kullanıcı kılavuzu ve demo. Akıllı Fiyat Hareketi Kavramları Göstergesi, hem yeni hem de deneyimli tüccarlar için çok güçlü bir araçtır. İleri ticaret fikirlerini, Inner Circle Trader Analizi ve Smart Money Concepts Ticaret Stratejileri gibi 20'den fazla kullanışlı göstergeyi bir araya getirerek bir araya g
MT4 için Astronomi Göstergesini Tanıtıyoruz: En İleri Göksel Ticaret Arkadaşınız Ticaret deneyiminizi göksel seviyelere yükseltmeye hazır mısınız? MT4 için devrim niteliğindeki Astronomi Göstergemizi arayın. Bu yenilikçi araç karmaşık algoritmaları kullanarak eşsiz astronomik içgörüler ve hassas hesaplamalar sunmak için geleneksel ticaret göstergelerini aşmaktadır. Bilgi Evreni Parmaklarınızın Ucunda: Göksel verilerin hazinelerini açığa çıkaran kapsamlı bir paneli gözlemleyin. Gezegenlerin geo/h
Please send me Direct message on MQL5 CHAT after purchasing the Indicator for Training and Installation Support There are some additional files that is important to use with the Indicator . So be sure to contact me after purchasing the Indicator So that I can add you for training and support . If you find any difficulty with installation then send me Direct message here So that I can connect with you via Anydesk or Teamview for the product installation. " Smart Order Block Indicator " to find
Currency Strength Exotics
Bernhard Schweigert
4.88 (33)
ŞU ANDA %20 INDIRIMLI! Herhangi bir Acemi veya Uzman Tüccar için En İyi Çözüm! Bu Gösterge, Egzotik Çiftler Emtialar, Endeksler veya Vadeli İşlemler gibi herhangi bir sembol için para birimi gücünü göstermek için uzmanlaşmıştır. Türünün ilk örneğidir, Altın, Gümüş, Petrol, DAX, US30, MXN, TRY, CNH vb. gerçek para birimi gücünü göstermek için 9. satıra herhangi bir sembol eklenebilir. Bu benzersiz, yüksek kaliteli ve uygun fiyatlı bir ticaret aracıdır çünkü bir dizi tescilli özelliği ve yeni
ICT, SMC, SMART MONEY CONCEPTS, SMART MONEY, Smart Money Concept, Support and Resistance, Trend Analysis, Price Action, Market Structure, Order Blocks, BOS/CHoCH,   Breaker Blocks ,  Momentum Shift,   Supply&Demand Zone/Order Blocks , Strong Imbalance, HH/LL/HL/LH,    Fair Value Gap, FVG,  Premium  &   Discount   Zones, Fibonacci Retracement, OTE, Buy Side Liquidity, Sell Side Liquidity, BSL/SSL Taken, Equal Highs & Lows, MTF Dashboard, Multiple Time Frame, BigBar, HTF OB, HTF Market Structure, 
Currency Strength Wizard , başarılı ticaret için size hepsi bir arada çözüm sağlayan çok güçlü bir göstergedir. Gösterge, birden çok zaman dilimindeki tüm para birimlerinin verilerini kullanarak şu veya bu forex çiftinin gücünü hesaplar. Bu veriler, şu veya bu para biriminin gücünü görmek için kullanabileceğiniz, kullanımı kolay para birimi endeksi ve para birimi güç hatları biçiminde temsil edilir. İhtiyacınız olan tek şey, işlem yapmak istediğiniz tabloya göstergeyi eklemektir ve gösterge size
ECM Elite Channel is a volatility-based indicator, developed with a specific time algorithm, which consists of finding possible corrections in the market. This indicator shows two outer lines, an inner line (retracement line) and an arrow sign, where the channel theory is to help identify overbought and oversold conditions in the market. The market price will generally fall between the boundaries of the channel. If prices touch or move outside the channel, it's a trading opportunity. The
TrendDecoder Premium
Christophe Pa Trouillas
5 (6)
Aralıkları ve bir sonraki olası hamleleri belirleyin   |  Trendlerin en erken sinyallerini ve gücünü alın   |  Geri dönüşten önce net çıkışlar alın   |  Fiyatın test edeceği Fibo seviyelerini tespit edin Gecikmesiz, takip edilmeyen gösterge - manuel ve otomatik ticaret için ideal - tüm varlıklar ve tüm zaman birimleri için uygun Sınırlı süreli teklif >>   %50 İNDİRİM Satın aldıktan sonra, kişiselleştirilmiş ayarlar için bu kanaldan benimle iletişime geçin . MT5   sürümü:   buraya tıklayın Tam y
Indicator : RealValueIndicator Description : RealValueIndicator is a powerful tool designed specifically for trading on the EURUSD pair. This indicator analyzes all EUR and USD pairs, calculates their real currency strength values, and displays them as a single realistic value to give you a head start on price. This indicator will tell you moves before they happen if you use it right. RealValueIndicator allows you to get a quick and accurate overview of the EURUSD currency pair tops and bottoms,
Yazarın diğer ürünleri
DTM Hypertrend
Gabor Bocsak
5 (1)
SATIN ALDIKTAN SONRA BİR MESAJ VEYA YORUM BIRAKIN VE BONUS EA TİCARET ASİSTANINI GÖNDERECEĞİM! Hypertrend, mumları trendin gücüne göre renklendirecek çok güçlü bir görsel göstergedir. YENİDEN BOYAMA YAPILMAZ! Tüm çiftlerde ve zaman dilimlerinde çalışır! Ekran görüntülerini (GIF) kontrol edin! Sizin için trendi bulmak için özel filtreler ve osilatörler kullanıyor, bu nedenle grafiğe bakmaktan başka hiçbir şey yapmanıza gerek yok! Ayarlar: Sadece renkleri tercihinize göre değiştirin ve uy
ÇOKLU PARA BİRİMİ ve ÇOK ZAMANLI ÇERÇEVE ALIM VE SATIŞ UYARISI. OTOMATİK TAKİP DURDURMA VE RİSK ÖDÜLÜ KÂR AL! GÖSTERGE TARAMALARI VE PİYASAYI ANALİZ ETMEK, YAPACAK BİR ŞEYİNİZ YOK! TÜM PARA BİRİMLERİNİZİ 1 GRAFİKTE İŞLEM YAPIN!   Satın aldıktan sonra lütfen yorum bırakın benimle iletişime geçin, size ticaret asistanı EA'yı göndereceğim. Gösterge, en iyi ONAYLANMIŞ giriş noktalarını bulmak için çeşitli Osilatörler ve ekli filtreler kullanıyor, bu nedenle bu konuda endişelenmenize gerek yok
ZonePro Tedarik Talebi, 3 daha yüksek zaman dilimine kadar yeni, test edilmiş, kırılmış, eski ve iç içe geçmiş bölgeleri çizer ve bölgelere dokunulursa, girilirse veya kırılırsa veya ters mum bölgeyi terk ederse Uyarılar gönderir! YENİDEN BOYAMA YOK! Bölge bilgisi: Pip boyutu bölge daha yüksek bir zaman diliminde yuvalanmışsa   bölgenin test edilip edilmediği ve kaç kez Trend paneli (sol üst): Size zamanı gösterir Bir sonraki muma kadar süre Genel eğilim Kısa vadeli trend yönü Trendin
Ticaret oklarıyla Macd 2 satır göstergesi. İçerir : MACD sinyali ve MACD çizgisi 2 renkli histogram 0 seviye olası ticaret okları Nasıl okunur : çarpı işareti oluştuktan sonra gösterge size bir ok verecektir ve hızlı çizgi sıfır çizgisinin üstüne veya altına inecektir! Uygun risk yönetimini kullanın ve yüksek volatiliteye sahip haberlerle işlem yapmayın! DİĞER ÜRÜNLERE GÖZ ATIN: https://www.mql5.com/en/users/gabedk/seller
FREE
Filtrele:
İnceleme yok
İncelemeye yanıt