• Genel bakış
  • İncelemeler
  • Yorumlar

MA Killer MT4

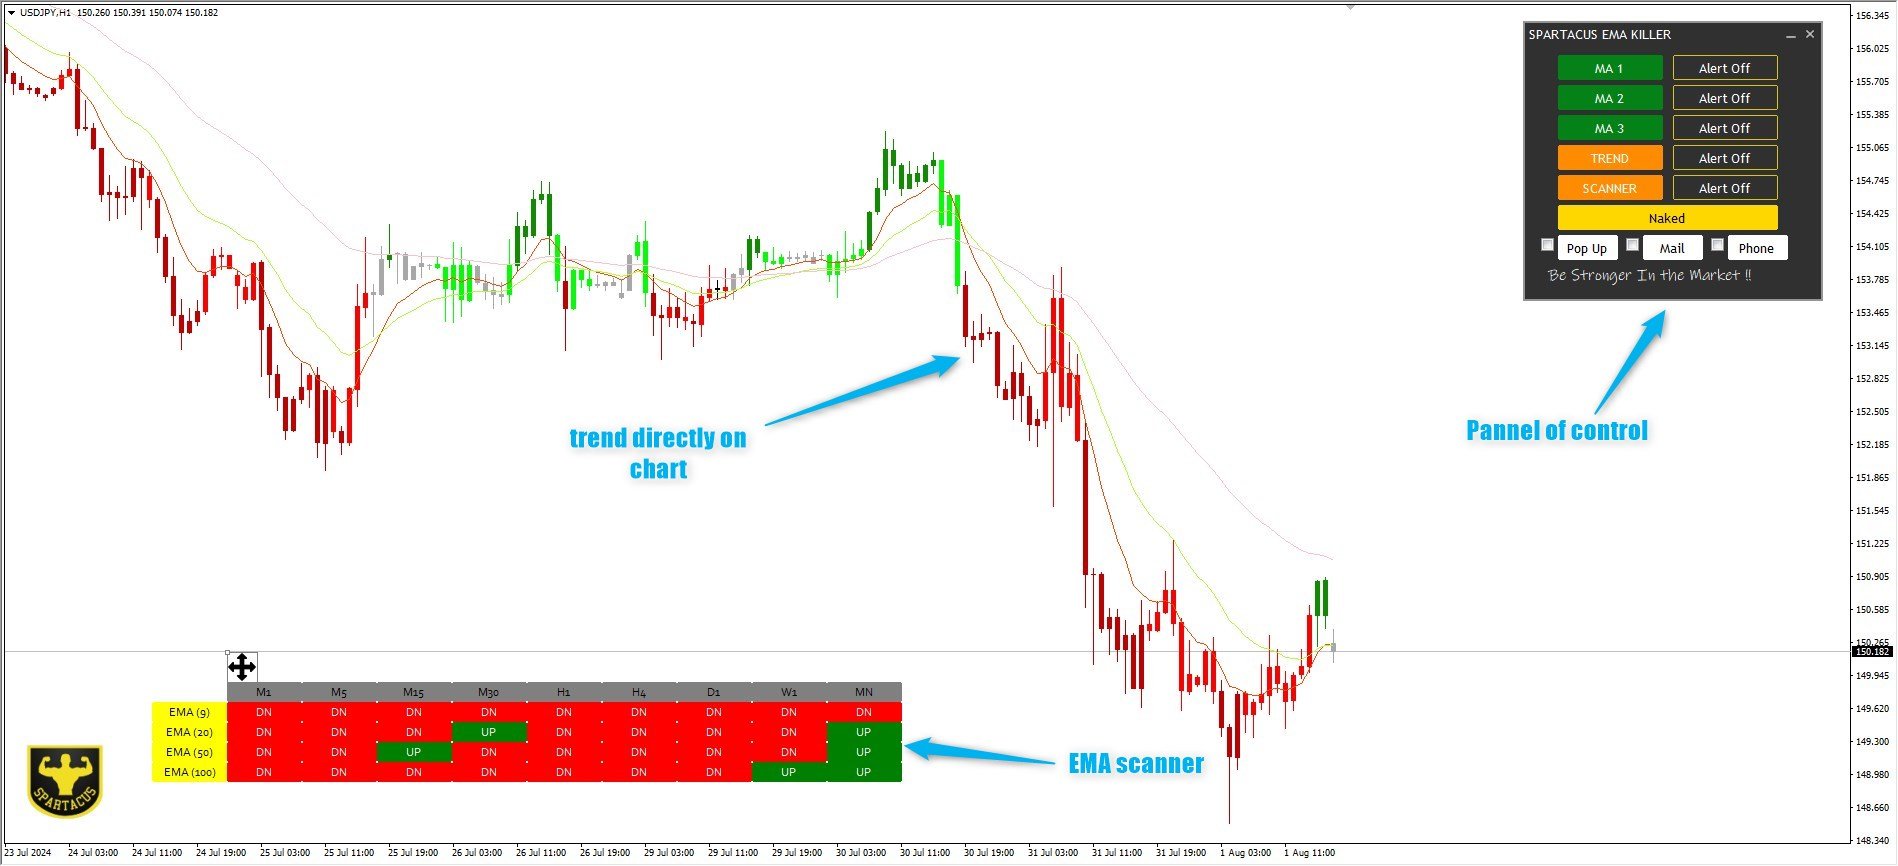
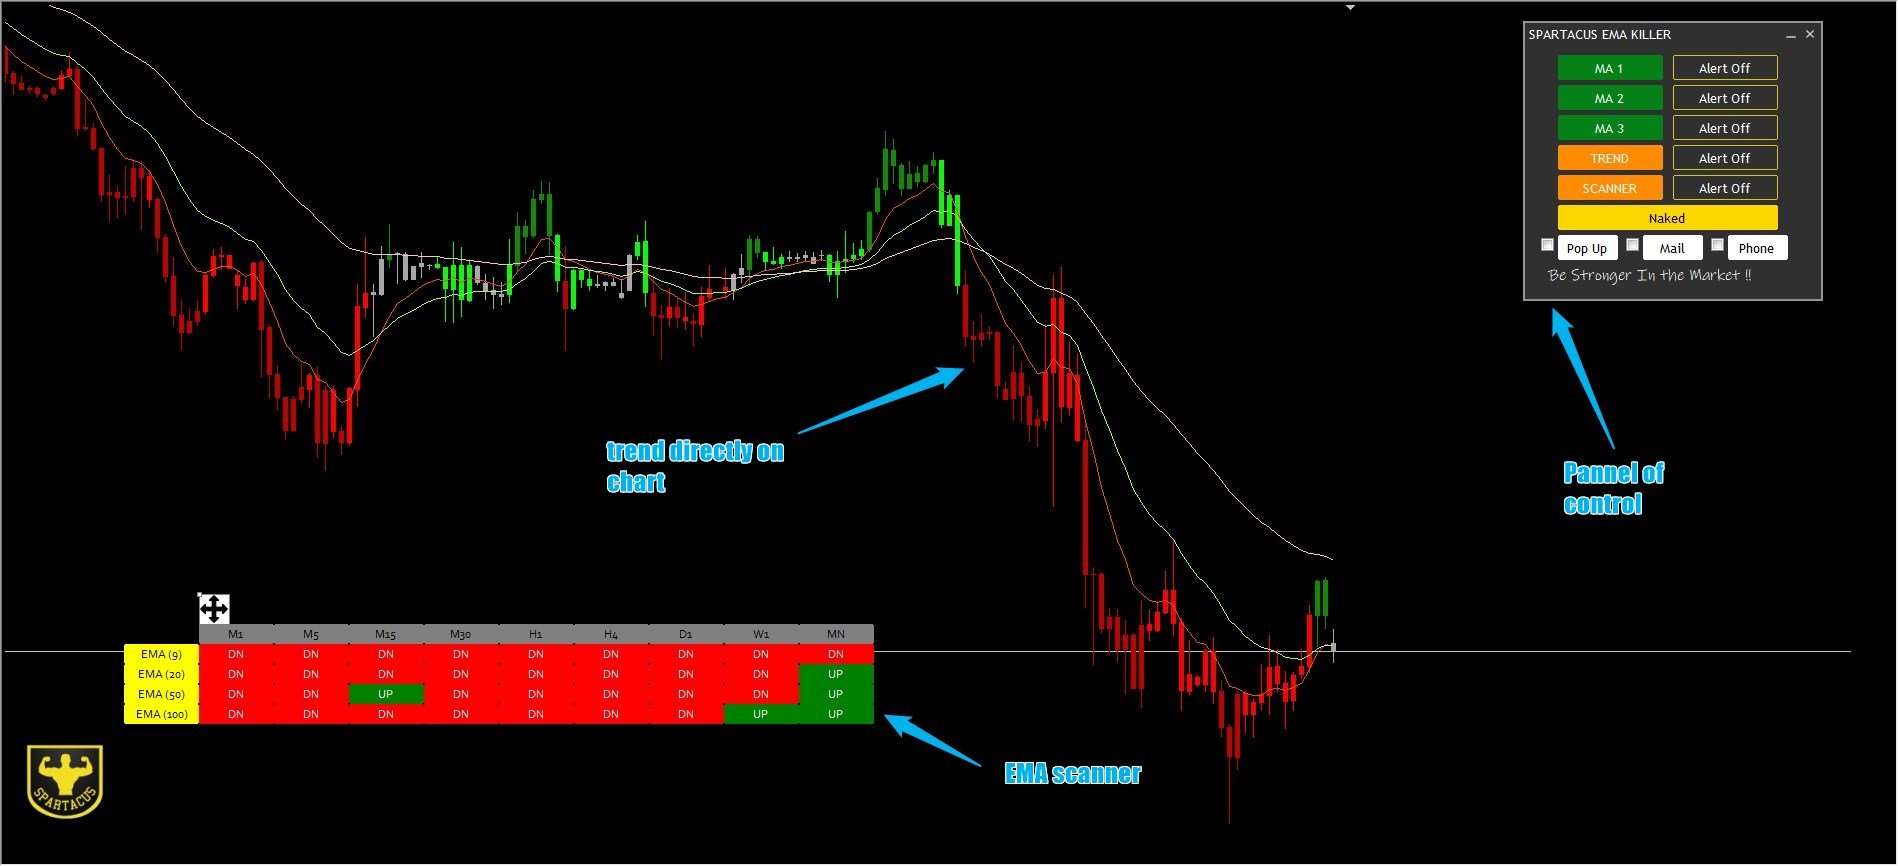
MA Öldürücü Göstergesi, hareketli ortalamaları kullanan yatırımcılar için nihai silahtır. Doğrudan bir yönetim paneli tarafından erişilebilen çeşitli araçları kullanan eksiksiz bir sistemdir. Araçları sayesinde piyasa hakkında genel bir bakışa sahip olursunuz ve bir pozisyona giriş için karar vermede değerli yardıma sahip olursunuz.

Şunlardan oluşur:

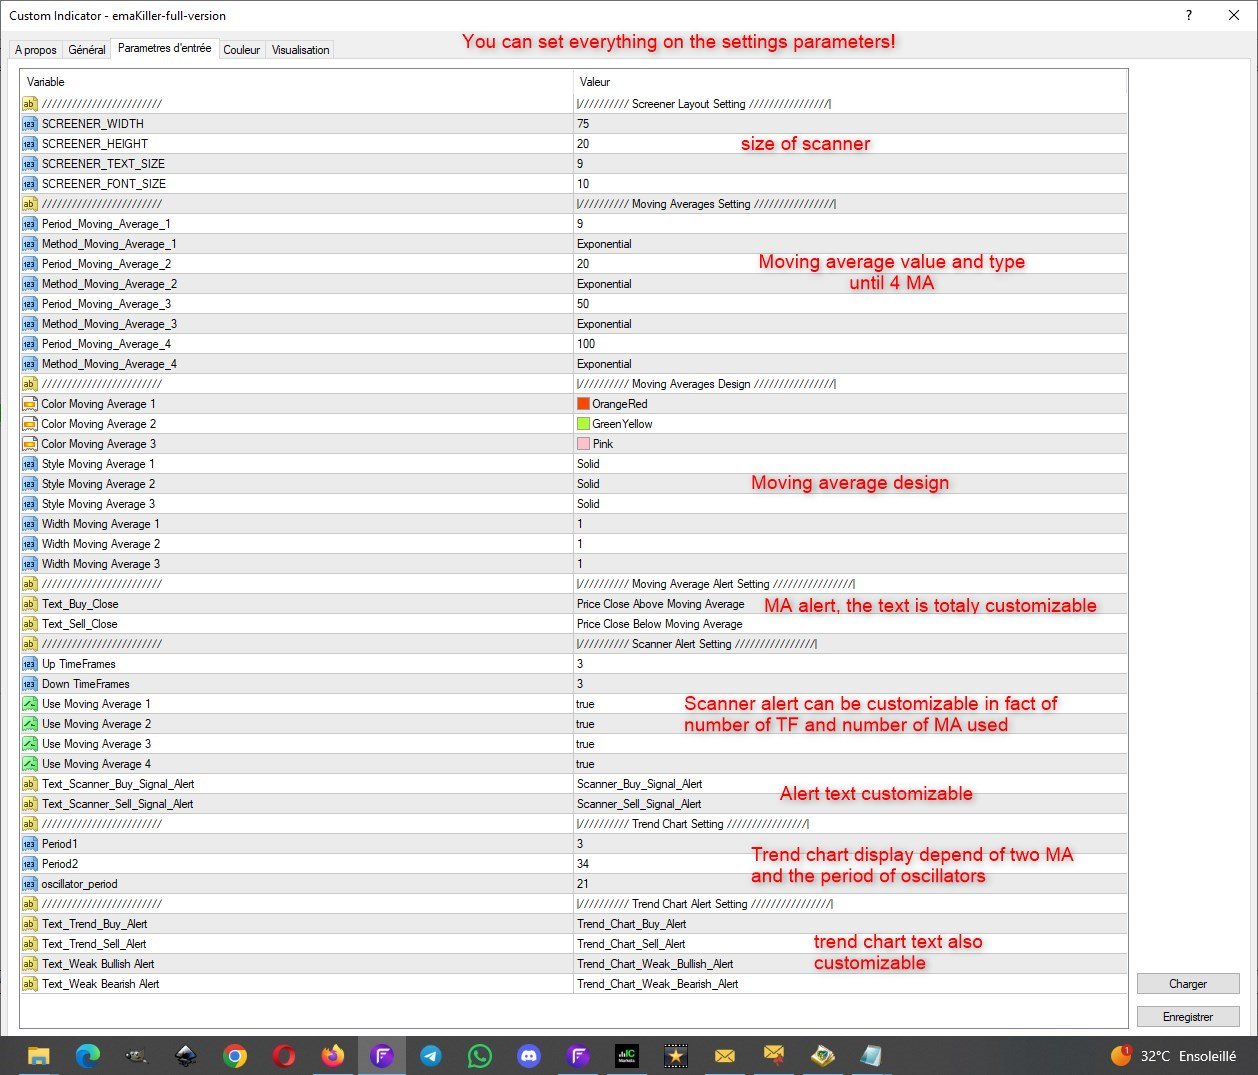
- Bir renk kodu kullanarak trendi doğrudan grafik üzerinde görüntüleyen Trend grafiği Ana göstergesi. Bu eğilim, iki hareketli ortalama ve birkaç osilatör kullanan bir algoritma tarafından hesaplanır.

- 9 zaman birimi üzerinden çeşitli hareketli ortalamalara (4'e kadar) göre fiyat konumunu görüntüleyen bir piyasa tarayıcısı olan Hareketli ortalama tarayıcı göstergesi.

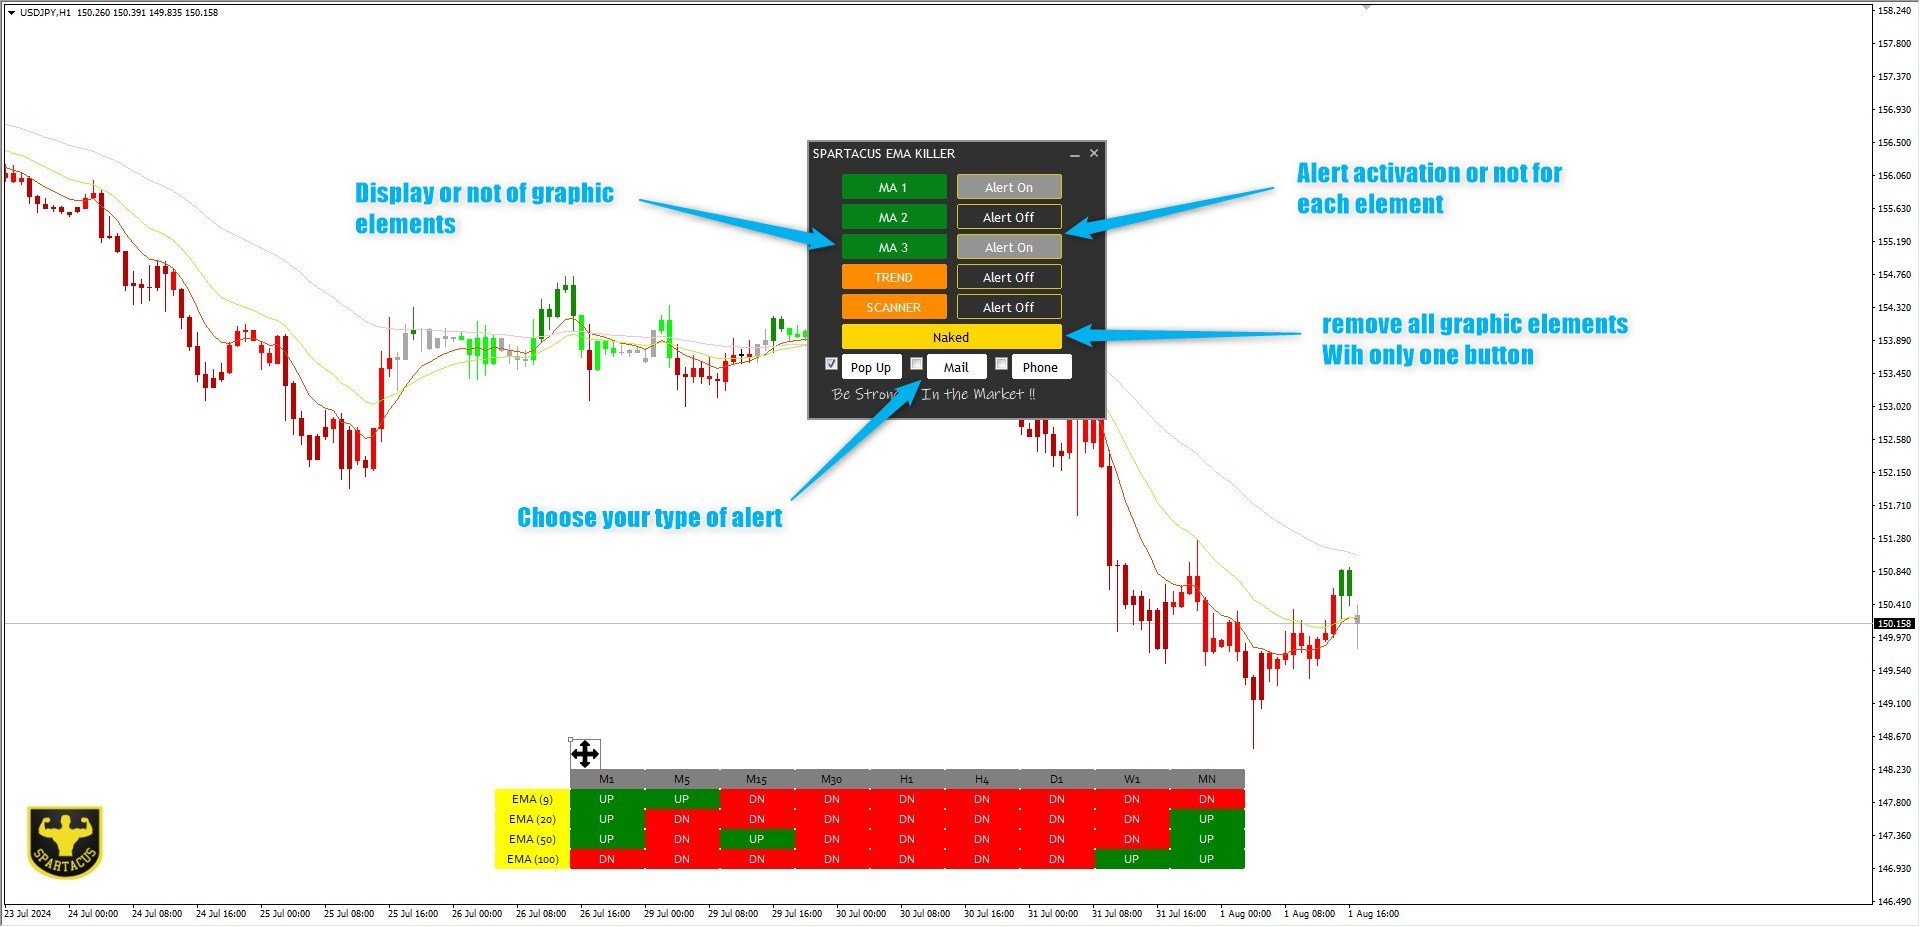
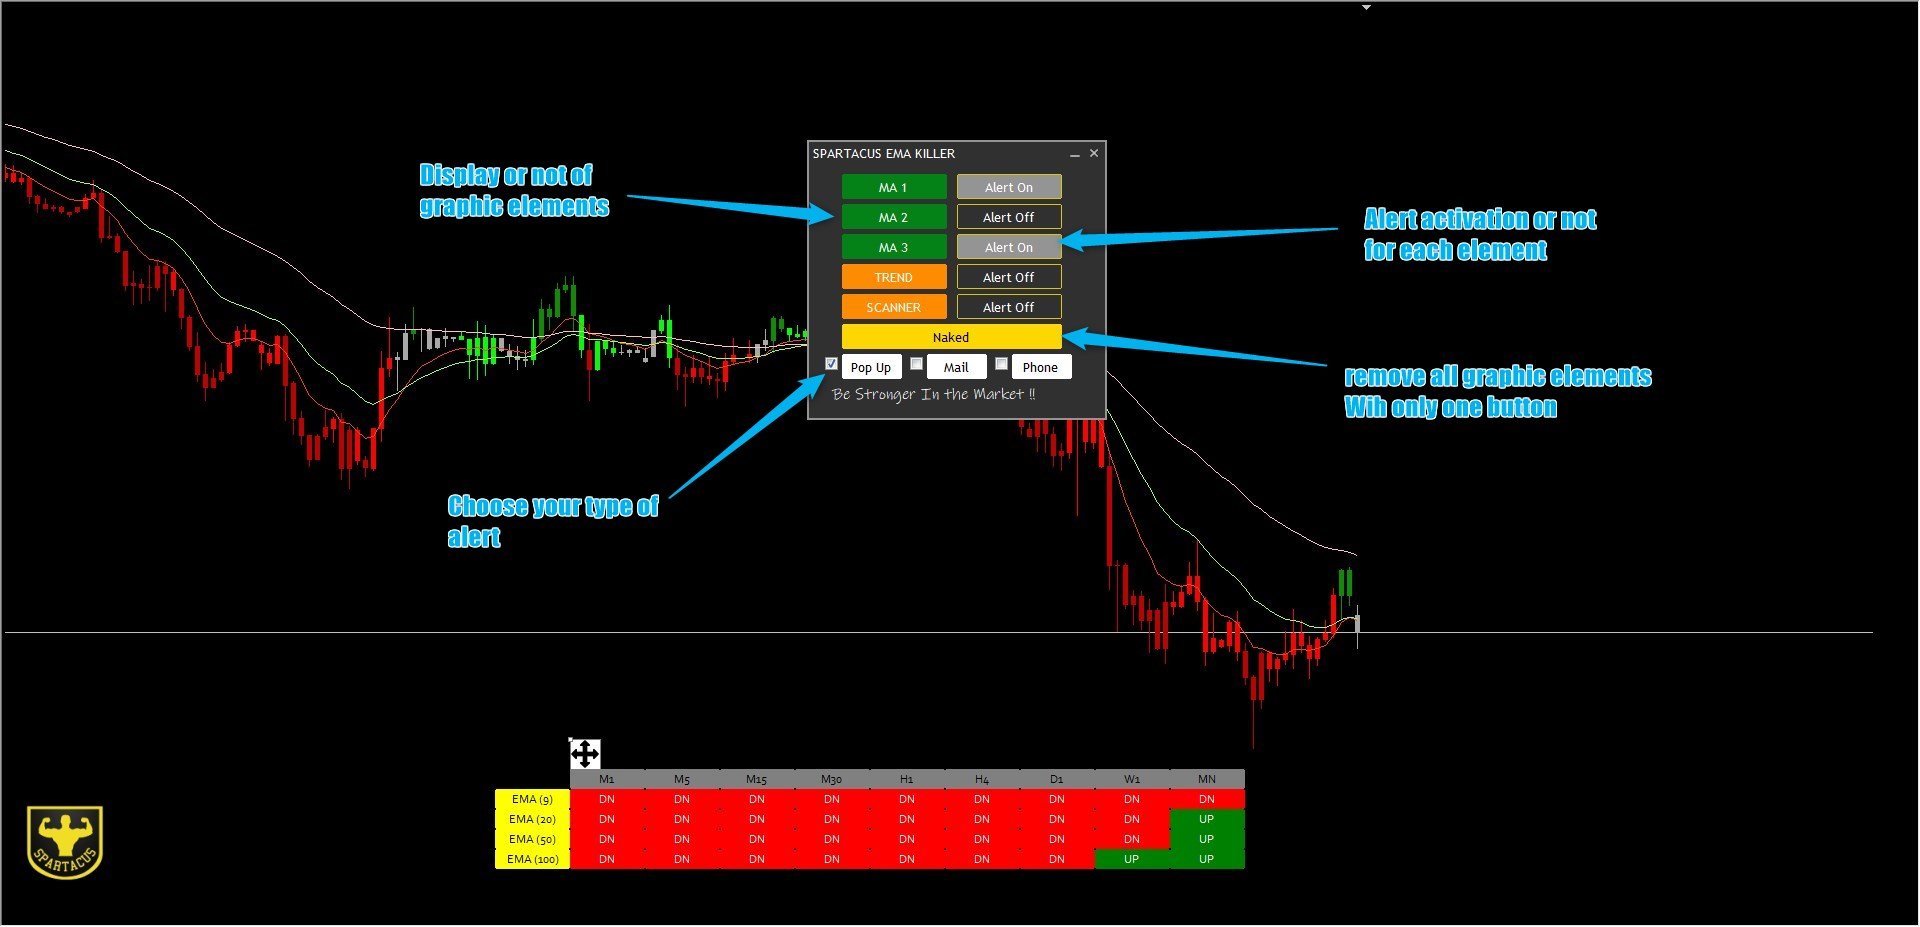
- Birkaç hareketli ortalamanın bağımsız olarak görüntülenip görüntülenmeyeceği. Gösterge sekmesi aracılığıyla bunları eklemenize veya kaldırmanıza gerek yoktur.


MT5 version


Her sistemin Açılır Pencerede, e-posta ve Anlık bildirim yoluyla alınabilecek uyarıları vardır. Uyarılar doğrudan kontrol paneli aracılığıyla etkinleştirilebilir veya etkinleştirilemez.

Her şey doğrudan grafikte görüntülenen bir kontrol paneli tarafından yönetiliyor. Bu yönetim paneli, tek bir tıklamayla her işlevi görüntüleyip görüntülememenize ve uyarıları tek bir tıklamayla yönetmenize olanak tanır.

Hatta tek tıklamayla tüm öğeleri kaldırmanıza olanak tanıyan "çıplak grafik" özelliğine bile sahiptir.

Yalnızca karar verme sürecinize konsantre olabilmeniz için her şey görevinizi kolaylaştırmak üzere tasarlandı.

Tüm sistem bileşenleri gösterge ayar parametreleri aracılığıyla ayarlanabilir.

Tüm uyarı metinleri özelleştirilebilir.


SPARTACUS©2024

Önerilen ürünler
VR Cub
Vladimir Pastushak
VR Cub , yüksek kaliteli giriş noktaları elde etmenin bir göstergesidir. Gösterge, matematiksel hesaplamaları kolaylaştırmak ve bir pozisyona giriş noktalarının aranmasını basitleştirmek için geliştirildi. Göstergenin yazıldığı ticaret stratejisi uzun yıllardan beri etkinliğini kanıtlamaktadır. Ticaret stratejisinin basitliği, acemi yatırımcıların bile başarılı bir şekilde ticaret yapmasına olanak tanıyan büyük avantajıdır. VR Cub, pozisyon açılış noktalarını ve Kâr Al ve Zararı Durdur hedef sev
Master Scalping M1 , trendi hızlı ve doğru bir şekilde belirlemek için bir algoritma kullanan yenilikçi bir göstergedir. Gösterge, pozisyonların açılış ve kapanış zamanını hesaplar, gösterge algoritmaları, bir ticarete girmek (bir varlık satın almak veya satmak) için ideal anları bulmanızı sağlar, bu da çoğu tüccar için işlemlerin başarısını artırır. Göstergenin faydaları: Kullanımı kolaydır, çizelgeyi gereksiz bilgilerle aşırı yüklemez. Herhangi bir strateji için bir filtre olarak kullanılabili
Noize Absorption Index MT4
Ekaterina Saltykova
5 (1)
Noize Absorption Index - is the manual trading system that measures the difference of pressure between bears forces and bulls forces. Green line - is a noize free index that showing curent situation. Zero value of index shows totally choppy/flat market.Values above zero level shows how powerfull bullish wave is and values below zero measures bearish forces.Up arrow appears on bearish market when it's ready to reverse, dn arrow appears on weak bullish market, as a result of reverse expectation. S
Owl smart levels
Sergey Ermolov
4.13 (23)
MT5 versiyonu  |  FAQ Owl Smart Levels Indicator ,   Bill Williams'ın gelişmiş fraktalları , piyasanın doğru dalga yapısını oluşturan Valable ZigZag ve kesin giriş seviyelerini gösteren   Fibonacci seviyeleri   gibi popüler piyasa analiz araçlarını içeren tek gösterge içinde eksiksiz bir ticaret sistemidir. pazara ve kar elde edilecek yerlere. Stratejinin ayrıntılı açıklaması Gösterge ile çalışma talimatı Baykuş Yardımcısı ticaretinde Danışman Yardımcısı Kullanıcıların özel sohbeti -> Satın ald
Bu, bir mumun kapanış fiyatını tahmin eden bir göstergedir. Gösterge öncelikle D1 çizelgelerinde kullanılmak üzere tasarlanmıştır. Bu gösterge hem geleneksel forex ticareti hem de ikili opsiyon ticareti için uygundur. Gösterge, bağımsız bir ticaret sistemi olarak kullanılabilir veya mevcut ticaret sisteminize ek olarak hareket edebilir. Bu gösterge, mevcut mumu analiz ederek mumun gövdesi içindeki belirli güç faktörlerini ve önceki mumun parametrelerini hesaplar. Böylece gösterge, piyasa hareket
Blahtech Market Profile
Blahtech Limited
4.46 (13)
Was: $249  Now: $99   Market Profile defines a number of day types that can help the trader to determine market behaviour. A key feature is the Value Area, representing the range of price action where 70% of trading took place. Understanding the Value Area can give traders valuable insight into market direction and establish the higher odds trade. It is an excellent addition to any system you may be using. Blahtech Limited presents their Market Profile indicator for the MetaTrader community. Ins
Gösterge, tarihsel olanlarla karşılaştırılabilecek güncel teklifler oluşturur ve bu temelde bir fiyat hareketi tahmini yapar. Gösterge, istenen tarihe hızlı navigasyon için bir metin alanına sahiptir. Seçenekler: Sembol - göstergenin göstereceği sembolün seçimi; SymbolPeriod - göstergenin veri alacağı dönemin seçimi; GöstergeRenk - gösterge rengi; Ters - doğru tırnakları tersine çevirir, yanlış - orijinal görünüm; Sonraki, tarihi girebileceğiniz ve 'enter' tuşuna basa
Trade with Gann on your side!! MASTER CIRCLE 360 CIRCLE CHART, originally created by Gann admitted that this is “The Mother of all charts”. It is one of the last studies that this great trader left for us. The numeric tab le is apparently quite simple like all the tables and is based on square numbers, the SQUARE OF 12 and is by evolution, one of the most important square numbers. Here we can find CYCLE, PRICE AND TIME thanks to angles and grades, to show past and future support and resistance.
Point61 Indicator
Evgeniy Machok
5 (1)
The Point61 indicator is the result of many years of monitoring of price behavior of currency pairs and metals. It is not a secret, that in times of uncertainty, traders are looking for possible levels of support and resistance - the point, where price should stop its movement. There are 2 possible scenarios at these points: 1. Reverse (correction) to the opposite direction; 2. Breakthrough to continue movement. Very often these points are used to set stop orders - TakeProfit or
Forex Gump
Andrey Kozak
2.75 (4)
Forex Gump is a fully finished semi-automatic trading system. In the form of arrows, signals are displayed on the screen for opening and closing deals. All you need is to follow the instructions of the indicator. When the indicator shows a blue arrow, you need to open a buy order. When the indicator shows a red arrow, you need to open a sell order. Close orders when the indicator draws a yellow cross. In order to get the most effective result, we recommend using the timeframes H1, H4, D1. There
This is a trend indicator without redrawing Developed instead of the binary options strategy (by the color of the Martingale candlestick) Also works well in forex trading When to open trades (binary options) A signal will appear in the place with a candle signaling the current candle It is recommended to open a deal for one candle of the current timeframe M1 and M5 When a blue dot appears, open a deal up When a red dot appears, open a trade down. How to open trades on Forex. When a signal is rec
The Th3Eng PipFinite indicator is based on a very excellent analysis of the right trend direction with perfect custom algorithms. It show the true direction and the best point to start trading. With StopLoss point and Three Take Profit points. Also it show the right pivot of the price and small points to order to replace the dynamic support and resistance channel, Which surrounds the price. And Finally it draws a very helpful Box on the left side on the chart includes (take profits and Stop loss
VR Grid
Vladimir Pastushak
5 (1)
VR Izgara göstergesi, kullanıcı tanımlı ayarlarla grafiksel bir ızgara oluşturmak için tasarlanmıştır . Standart ızgaradan farklı olarak, VR Izgarası dairesel seviyeler oluşturmak için kullanılır. Kullanıcının seçimine bağlı olarak tur seviyeleri arasındaki adım isteğe bağlı olabilir. Ek olarak, diğer göstergeler ve yardımcı programlardan farklı olarak VR Grid, zaman dilimi değiştiğinde veya terminal yeniden başlatıldığında bile ızgaranın konumunu korur . Ayarlar, set dosyaları, demo versiyonlar
FREE
HMA Trend Professional MT4
Pavel Zamoshnikov
4.67 (6)
Improved version of the free HMA Trend indicator (for MetaTrader 4) with statistical analysis. HMA Trend is a trend indicator based on the Hull Moving Average (HMA) with two periods. HMA with a slow period identifies the trend, while HMA with a fast period determines the short-term movements and signals in the trend direction. The main differences from the free version: Ability to predict the probability of a trend reversal using analysis of history data. Plotting statistical charts for analyz
Title : Market Bias Indicator - Oscillator-Based Trading Tool Introduction : Discover the potential of the "Market Bias Indicator," a revolutionary oscillator-based trading tool designed for precise market analysis. If you're in search of a robust alternative to traditional bias indicators, your quest ends here. Market Bias Indicator offers unparalleled accuracy in identifying market sentiment and is your gateway to confident trading decisions. Recommended Trading Pairs : Market Bias Indicator i
The indicator displays the data of the Stochastic oscillator from a higher timeframe on the chart. The main and signal lines are displayed in a separate window. The stepped response is not smoothed. The indicator is useful for practicing "manual" forex trading strategies, which use the data from several screens with different timeframes of a single symbol. The indicator uses the settings that are identical to the standard ones, and a drop-down list for selecting the timeframe. Indicator Parame
Predictor PRO MT4
Evgenii Aksenov
5 (1)
A new generation PROgressive indicator from INFINITY. Predictor PRO uses its own entry and exit calculation strategy. Indicator without redrawing signals! This is very important for real trading. The indicator can be used for any currency pairs, metals, cryptocurrencies or indices. The best time of the H1 chart. Unlike other indicators, Predictor PRO shows shows the Buy/Sell entry point and the Close exit point. Calculating the profit of all signals in points on the panel helps to choose th
Fibonacci retracement and extension line drawing tool Fibonacci retracement and extended line drawing tool for MT4 platform is suitable for traders who use  golden section trading Advantages: There is no extra line, no too long line, and it is easy to observe and find trading opportunities Trial version: https://www.mql5.com/zh/market/product/35884 Main functions: 1. Multiple groups of Fibonacci turns can be drawn directly, and the relationship between important turning points
Volume Profile Indicator for MT4 Gain a trading edge with the "Volume Profile" indicator for MetaTrader 4 (MT4). This advanced technical analysis tool allows you to precisely identify key support and resistance levels based on transaction volume. Easily visualize market areas of high interest, where trading volumes are highest, and use this information to make more informed trading decisions. Key Features: Clear and detailed visualization : The indicator displays volume histograms directly on th
The indicator displays a matrix of indicators across multiple timeframes with a sum total and optional alert. Custom indicators can also be added to the matrix, in a highly configurable way. The alert threshold can be set to say what percentage of indicators need to be in agreement for an alert to happen. The alerts can turned on/off via on chart tick boxes and can be set to notify to mobile or sent to email, in addition to pop-up. The product offers a great way to create an alert when multiple
TWO PAIRS SQUARE HEDGE METER INDICATOR Try this brilliant 2 pairs square indicator It draws a square wave of the relation between your two inputs symbols when square wave indicates -1 then it is very great opportunity to SELL pair1 and BUY Pair2 when square wave indicates +1 then it is very great opportunity to BUY pair1 and SELL Pair2 the inputs are : 2 pairs of symbols         then index value : i use 20 for M30 charts ( you can try other values : 40/50 for M15 , : 30 for M30 , : 10 for H1 ,
PipFinite Trend PRO
Karlo Wilson Vendiola
4.8 (1274)
Breakthrough Solution For Trend Trading And Filtering With All Important Features Built Inside One Tool! Trend PRO's smart algorithm detects the trend, filters out market noise and gives entry signals with exit levels. The new features with enhanced rules for statistical calculation improved the overall performance of this indicator. Important Information Revealed Maximize the potential of Trend Pro, please visit www.mql5.com/en/blogs/post/713938 The Powerful Expert Advisor Version Automa
[ZhiBiCCI] indicators are suitable for all cycle use, and are also suitable for all market varieties. [ZhiBiCCI] Green solid line is a reversal of bullish divergence. The green dotted line is a classic bullish divergence. [ZhiBiCCI] The solid line to the red is a reverse bearish divergence. The red dotted line is a classical bearish divergence. [ZhiBiCCI] can be set in the parameters (Alert, Send mail, Send notification), set to (true) to send instant signals to the alarm window, email, in
The Funicular
Daniil Kurmyshev
The Funicular is a functional indicator knowing all the rules of the market and performing constructions more accurate and faster than any professional analyst.  The Funicular helps you see the exact points of the "entrance", and it draws trends with great accuracy determinig their strength and fluctuation time. The main difference from the others is that it builds lines that are independent of timeframe allowing you to perceive the chart as a whole. Simply put, you need The Funicular, because i
For sure, this indicator has become very popular amongst traders. Through coding this indicator will give you the most accurate levels possible for your trading analysis. We have also added in the ability for you to receive alerts when the price breaks above or below a Support or Resistance lines! HOW TO USE The red rectangles represent your resistance/supply zone. The green rectangles represent your support/demand zone.  BONUS FEATURES We coded this indicator with the ability to switch between
The Riko Trend indicator is a revolutionary trend trading and filtering solution with all the important features of a trend tool built into one tool! The Riko Trend indicator is good for any trader, suitable for any trader for both forex and binary options. You don’t need to configure anything, everything is perfected by time and experience, it works great during a flat and in a trend. The Riko Trend indicator is a technical analysis tool for financial markets that reflects the current price
Trendiness Index
Libertas LLC
5 (3)
"The trend is your friend" is one of the best known sayings in investing, because capturing large trendy price movements can be extremely profitable. However, trading with the trend is often easier said than done, because many indicators are based on price reversals not trends. These aren't very effective at identifying trendy periods, or predicting whether trends will continue. We developed the Trendiness Index to help address this problem by indicating the strength and direction of price trend
We present you the indicator "Candle closing counter", which will become your indispensable assistant in the world of trading. That’s why knowing when the candle will close can help: If you like to trade using candle patterns, you will know when the candle will be closed. This indicator will allow you to check if a known pattern has formed and if there is a possibility of trading. The indicator will help you to prepare for market opening and market closure. You can set a timer to create a p
The Chaikin Oscillator is a technical indicator developed by Marc Chaikin that combines price and volume data to measure the accumulation and distribution of a financial instrument. It aims to identify potential buying and selling opportunities in the market. The Chaikin Oscillator is calculated by subtracting a 10-day exponential moving average of the Accumulation Distribution Line (ADL) from a 3-day exponential moving average of the ADL. Here's how to use the Chaikin Oscillator indicator in tr
PipFinite Energy Beam
Karlo Wilson Vendiola
3.8 (15)
Pipfinite creates unique, high quality and affordable trading tools. Our tools may or may not work for you, so we strongly suggest to try the Demo Version for MT4 first. Please test the indicator prior to purchasing to determine if it works for you. We want your good reviews, so hurry up and test it for free...we hope you will find it useful. Combo Energy Beam with Swing Control Strategy: Confirm swing pullback signals Watch Video: (Click Here) Energy Beam with Trend Laser Strategy: Confirm Tr
Bu ürünün alıcıları ayrıca şunları da satın alıyor
Gann Made Easy
Oleg Rodin
4.84 (57)
Gann Made Easy , bay teorisini kullanarak ticaretin en iyi ilkelerine dayanan, profesyonel ve kullanımı kolay bir Forex ticaret sistemidir. WD Gann. Gösterge, Zararı Durdur ve Kâr Al Seviyeleri dahil olmak üzere doğru SATIN AL ve SAT sinyalleri sağlar. PUSH bildirimlerini kullanarak hareket halindeyken bile işlem yapabilirsiniz. Lütfen satın aldıktan sonra benimle iletişime geçin! Alım satım ipuçlarımı ve harika bonus göstergelerini ücretsiz olarak sizinle paylaşacağım! Muhtemelen Gann ticaret y
Trend Punch
Mohamed Hassan
5 (11)
This indicator is unstoppable when combined with our other indicator called  Support & Resistance . After purchase, send us a message and you will get it   for  FREE as a BONUS! Introducing Trend Punch , the revolutionary forex trend indicator that will transform the way you trade! Trend Punch is uniquely designed to provide precise buy and sell arrows during strong market trends, making your trading decisions clearer and more confident. Whether you're trading major currency pairs or exotic sym
FX Power MT4 NG
Daniel Stein
5 (12)
Sabah Brifingimiz burada mql5 ve on Telegram! FX Power MT4 NG , uzun zamandır çok popüler olan döviz gücü ölçerimiz FX Power'ın yeni neslidir. Peki bu yeni nesil güç ölçer ne sunuyor? Orijinal FX Power hakkında sevdiğiniz her şey PLUS GOLD/XAU güç analizi Daha da hassas hesaplama sonuçları Ayrı ayrı yapılandırılabilir analiz dönemleri Daha da iyi performans için özelleştirilebilir hesaplama limiti Özel çokluDaha fazlasını görmek isteyenler için örnek ayarlar Her grafikte en sevdiğiniz renkler i
Gold Stuff
Vasiliy Strukov
4.89 (201)
Gold Stuff, özellikle altın için tasarlanmış bir trend göstergesidir ve herhangi bir finansal enstrümanda da kullanılabilir. Gösterge yeniden çizilmez ve gecikmez. Önerilen zaman dilimi H1. Bu göstergede tam otomatik Uzman Danışman EA Gold Stuff çalışır. Profilimde bulabilirsiniz. Ayarları ve kişisel bir bonusu almak için satın alma işleminden hemen sonra benimle iletişime geçin!  Güçlü Destek ve Trend Tarayıcı göstergemizin ücretsiz bir kopyasını pm'den alabilirsiniz. Ben! AYARLAR Ok Ç
ÜRÜNÜ SATIN ALMADAN ÖNCE LÜTFEN AŞAĞIDAKİ BİLGİLERİ OKUYUNUZ! Apollo Pips PLUS SP benzersiz bir üründür! YENİ "APOLLO PIPS" GÖSTERGEMİ ARTI TÜM İŞLEM GÖSTERGELERİME ERİŞİM İLE "SÜPER PAKET" BONUSUNU ALMAK İSTEYENLER İÇİN! Apollo Pips PLUS SP ürününü satın alarak aslında Apollo Pips göstergemin tamamen yeni bir versiyonunu satın almış oluyorsunuz. Göstergenin bu sürümü, geliştirilmiş bir algoritmaya ve kullanımı kolay bir parametreye sahiptir; bu, size göstergeyi herhangi bir piyasada ve herhangi
TPSproTREND PrO
Roman Podpora
4.78 (18)
TPSpro TREND PRO,   piyasayı otomatik olarak analiz eden, trend ve değişimlerinin her biri hakkında bilgi sağlayan, ayrıca yeniden çizmeden işlemlere girme sinyalleri veren bir trend göstergesidir! Gösterge her mumu ayrı ayrı analiz ederek kullanır. farklı dürtülere atıfta bulunur - yukarı veya aşağı dürtü. Para birimleri, kripto paralar, metaller, hisse senetleri ve endeksler için işlemlere tam giriş noktaları! Sürüm MT5                   GÖSTERGENİN TAM AÇIKLAMASI       Bunu -   RFI SEVİYELER
Trend Pulse
Mohamed Hassan
5 (3)
Please contact me after purchase to immediately get your PDF strategy + documentation for Trend Pulse !  Official release price of $89  (1 /50 copies left). Next price is $199 . Introducing Trend Pulse , a unique and robust indicator capable of detecting bullish, bearish, and even ranging trends! Trend Pulse uses a special algorithm to filter out market noise with real precision. If the current symbol is moving sideways, Trend Pulse will send you a ranging signal, letting you know that it'
Scalper Inside PRO
Alexey Minkov
4.69 (49)
An exclusive indicator that utilizes an innovative algorithm to swiftly and accurately determine the market trend. The indicator automatically calculates opening, closing, and profit levels, providing detailed trading statistics. With these features, you can choose the most appropriate trading instrument for the current market conditions. Additionally, you can easily integrate your own arrow indicators into Scalper Inside Pro to quickly evaluate their statistics and profitability. Scalper Inside
Currency Strength Wizard , başarılı ticaret için size hepsi bir arada çözüm sağlayan çok güçlü bir göstergedir. Gösterge, birden çok zaman dilimindeki tüm para birimlerinin verilerini kullanarak şu veya bu forex çiftinin gücünü hesaplar. Bu veriler, şu veya bu para biriminin gücünü görmek için kullanabileceğiniz, kullanımı kolay para birimi endeksi ve para birimi güç hatları biçiminde temsil edilir. İhtiyacınız olan tek şey, işlem yapmak istediğiniz tabloya göstergeyi eklemektir ve gösterge size
Atomic Analyst
Issam Kassas
5 (2)
Öncelikle belirtmek gerekir ki bu Ticaret Göstergesi Yeniden Çizim Yapmaz, Gecikmez ve Gecikme Göstermez, bu da hem manuel hem de robot ticareti için ideal hale getirir. Kullanıcı kılavuzu: ayarlar, girişler ve strateji. Atom Analisti, Piyasada Daha İyi Bir Avantaj Bulmak İçin Fiyatın Gücünü ve Momentumunu Kullanan PA Fiyat Hareketi Göstergesidir. Gürültüleri ve Yanlış Sinyalleri Kaldırmaya ve Ticaret Potansiyelini Artırmaya Yardımcı Olan Gelişmiş Filtrelerle Donatılmıştır. Birden fazla katma
RelicusRoad Pro
Relicus LLC
4.54 (80)
Şimdi 147 $ (birkaç güncellemeden sonra 499 $ 'a yükseliyor) - Sınırsız Hesaplar (PC'ler veya Mac'ler) RelicusRoad Kullanım Kılavuzu + Eğitim Videoları + Özel Discord Grubuna Erişim + VIP Durumu PİYASAYA BAKMAK İÇİN YENİ BİR YOL RelicusRoad, forex, vadeli işlemler, kripto para birimleri, hisse senetleri ve endeksler için dünyanın en güçlü ticaret göstergesidir ve yatırımcılara kârlı kalmaları için ihtiyaç duydukları tüm bilgileri ve araçları sağlar. Başlangıç ​​seviyesinden ileri seviyey
Şu anda %20 İNDİRİMLİ! Herhangi bir Acemi veya Uzman Tüccar için En İyi Çözüm! Bu gösterge paneli yazılımı 28 döviz çifti üzerinde çalışıyor. Ana göstergelerimizden 2'sine (Gelişmiş Para Birimi Gücü 28 ve Gelişmiş Para Birimi Dürtüsü) dayanmaktadır. Tüm Forex piyasasına harika bir genel bakış sağlar. Gelişmiş Para Birimi Gücü değerlerini, para birimi hareket hızını ve tüm (9) zaman dilimlerinde 28 Forex çifti için sinyalleri gösterir. Trendleri ve / veya scalping fırsatlarını belirlemek içi
Clear Breakout
Martin Alejandro Bamonte
"Breakout Buy-Sell" göstergesi, farklı piyasa seansları (Tokyo, Londra ve New York) sırasında fiyat kırılmalarına dayalı olarak potansiyel alım ve satım fırsatlarını belirlemek ve vurgulamak için tasarlanmıştır. Bu gösterge, traderların alım ve satım bölgelerini, ayrıca kâr alma (TP) ve zarar durdurma (SL) seviyelerini net bir şekilde görselleştirmelerine yardımcı olur. Kullanım Stratejisi Gösterge şu şekilde kullanılabilir: İlk Kurulum : Piyasa seansını seçin ve GMT farkını ayarlayın. Piyasa Gö
Trend Screener
STE S.S.COMPANY
4.79 (81)
Trend Göstergesi, Trend Alım Satım ve Filtreleme için Çığır Açan Benzersiz Çözüm, Tüm Önemli Trend Özellikleriyle Tek Bir Araç İçinde Yerleştirildi! Forex, emtialar, kripto para birimleri, endeksler ve hisse senetleri gibi tüm sembollerde/araçlarda kullanılabilen %100 yeniden boyamayan çoklu zaman çerçevesi ve Çoklu para birimi göstergesidir. Trend Screener, grafikte noktalarla ok trend sinyalleri sağlayan etkili bir trend trend göstergesidir. Trend analizörü göstergesinde bulunan özellikler: 1.
ŞU ANDA %31 INDIRIMLI !!! Yeni Başlayanlar veya Uzman Tüccarlar için En İyi Çözüm! Bu gösterge benzersiz, yüksek kaliteli ve uygun fiyatlı bir ticaret aracıdır çünkü bir dizi tescilli özellik ve gizli bir formül ekledik. Yalnızca BİR grafikle 28 döviz çiftinin tümü için Uyarılar verir. Yeni bir trendin veya scalping fırsatının tam tetik noktasını belirleyebildiğiniz için ticaretinizin nasıl gelişeceğini hayal edin! Yeni temel algoritmalar üzerine inşa edilen bu sistem, potansiyel işlemler
ŞU ANDA %26 INDIRIMLI Yeni Başlayanlar veya Uzman Tüccarlar için En İyi Çözüm! Bu Gösterge benzersiz, yüksek kaliteli ve uygun fiyatlı bir ticaret aracıdır çünkü bir dizi tescilli özellik ve yeni bir formül ekledik. Sadece BİR grafik ile 28 Forex çifti için Döviz Gücünü okuyabilirsiniz! Yeni bir trendin veya scalping fırsatının tam tetik noktasını belirleyebildiğiniz için ticaretinizin nasıl gelişeceğini hayal edin? Kullanım kılavuzu: buraya tıklayın Bu ilk olan, orijinal! Değersiz bir
PRO Renko Sistemi, RENKO grafikleri ticareti için özel olarak tasarlanmış son derece hassas bir ticaret sistemidir. Bu, çeşitli ticaret araçlarına uygulanabilen evrensel bir sistemdir. Sistemi etkin piyasa sana doğru ters sinyallerine erişim hakkı denilen ses nötralize eder. Göstergenin kullanımı çok kolaydır ve sinyal üretiminden sorumlu tek bir parametreye sahiptir. Aracı, seçtiğiniz herhangi bir ticaret aracına ve renko çubuğunun boyutuna kolayca uyarlayabilirsiniz. Yazılımımla karlı b
Gold Channel is a volatility-based indicator, developed with a specific timing algorithm for the XAUUSD pair, which consists of finding possible corrections in the market. This indicator shows two outer lines, an inner line (retracement line) and an arrow sign, where the theory of the channel is to help identify overbought and oversold conditions in the market. The market price will generally fall between the boundaries of the channel. If prices touch or move outside the channel it is a tra
Öncelikle, bu Ticaret Aracının Non-Repainting, Non-Redrawing ve Non-Lagging Gösterge olduğunu vurgulamakta fayda var, bu da onu profesyonel ticaret için ideal hale getiriyor. Çevrimiçi kurs, kullanıcı kılavuzu ve demo. Akıllı Fiyat Hareketi Kavramları Göstergesi, hem yeni hem de deneyimli tüccarlar için çok güçlü bir araçtır. İleri ticaret fikirlerini, Inner Circle Trader Analizi ve Smart Money Concepts Ticaret Stratejileri gibi 20'den fazla kullanışlı göstergeyi bir araya getirerek bir araya g
NAM Order Blocks
NAM TECH GROUP, CORP.
5 (1)
MT4 Multi-timeframe Order Blocks detection indicator. Features - Fully customizable on chart control panel, provides complete interaction. - Hide and show control panel wherever you want. - Detect OBs on multiple timeframes. - Select OBs quantity to display. - Different OBs user interface. - Different filters on OBs. - OB proximity alert. - ADR High and Low lines. - Notification service (Screen alerts | Push notifications). Summary Order block is a market behavior that indicates order collection
PZ Trend Trading
PZ TRADING SLU
4.8 (5)
Capture every opportunity: your go-to indicator for profitable trend trading Special Offer: Purchase now to receive free bonuses worth $159! (Read more for details) Trend Trading is an indicator designed to profit as much as possible from trends taking place in the market, by timing pullbacks and breakouts. It finds trading opportunities by analyzing what the price is doing during established trends. [ Installation Guide | Update Guide | Troubleshooting | FAQ | All Products ] Trade financial
TPSpro RFI Levels
Roman Podpora
4.8 (20)
Reversal First Impulse levels (RFI)    INSTRUCTIONS        RUS       -       ENG              R ecommended to use with an indicator   -   TPSpro  TREND PRO -  Version MT5 A key element in trading is zones or levels from which decisions to buy or sell a trading instrument are made. Despite attempts by major players to conceal their presence in the market, they inevitably leave traces. Our task was to learn how to identify these traces and interpret them correctly. Main functions: Displaying activ
Order Block Hunter
Noha Mohamed Fathy Younes Badr
5 (1)
Order block hunter indicator is the best indicator for  hunt the order blocks that area where there has been a large concentration of limit orders waiting to be executed Order blocks are identified on a chart by observing previous price action and looking for areas where the price experienced significant movement or sudden changes in direction .This indicator does that for you by using very complicated codes and helps you to take the best areas To buy and sell because it make marks at the best a
Scalper Vault
Oleg Rodin
5 (22)
Scalper Vault , başarılı bir scalping için ihtiyacınız olan her şeyi size sağlayan profesyonel bir scalping sistemidir. Bu gösterge, forex ve ikili opsiyon tüccarları tarafından kullanılabilecek eksiksiz bir ticaret sistemidir. Önerilen zaman çerçevesi M5'tir. Sistem size trend yönünde doğru ok sinyalleri sağlar. Ayrıca size üst ve alt sinyaller ve Gann piyasa seviyeleri sağlar. Göstergeler, PUSH bildirimleri dahil her türlü uyarıyı sağlar. Göstergeyi satın aldıktan sonra lütfen benimle iletişim
M1 Arrow
Oleg Rodin
4.67 (12)
Piyasanın iki temel ilkesine dayanan bir gün içi stratejisi. Algoritma, ek filtreler kullanarak hacimlerin ve fiyat dalgalarının analizine dayanmaktadır. Göstergenin akıllı algoritması, yalnızca iki piyasa faktörü bir araya geldiğinde bir sinyal verir. Gösterge, daha yüksek zaman çerçevesinin verilerini kullanarak M1 grafiğinde belirli bir aralıktaki dalgaları hesaplar. Ve dalgayı doğrulamak için gösterge, hacme göre analizi kullanır. Bu gösterge hazır bir ticaret sistemidir. Bir tüccarın ihtiya
Backtest and Read Overview before purchase. Chart patterns have been a topic of debate among traders; some believe they are reliable signalers, while others do not. Our Chart Patterns All-in-One indicator displays various chart patterns to help you test these theories for yourself. The profitability of these patterns is not a reflection of the indicator's effectiveness but rather an evaluation of the patterns themselves. The Chart Patterns All-in-One indicator is an excellent tool for visualizin
Advanced Supply Demand
Bernhard Schweigert
4.9 (271)
CURRENTLY 26% OFF !! Best Solution for any Newbie or Expert Trader! This indicator is a unique, high quality and affordable trading tool because we have incorporated a number of proprietary features and a new formula. With this update, you will be able to show double timeframe zones. You will not only be able to show a higher TF but to show both, the chart TF, PLUS the higher TF: SHOWING NESTED ZONES. All Supply Demand traders will love it. :) Important Information Revealed Maximize the potenti
Break and Retest
Mohamed Hassan
3.83 (12)
This Indicator only places quality trades when the market is really in your favor with a clear break and retest. Patience is key with this price action strategy! If you want more alert signals per day, you increase the number next to the parameter called: Support & Resistance Sensitivity.  After many months of hard work and dedication, we are extremely proud to present you our  Break and Retest price action indicator created from scratch. One of the most complex indicators that we made with ove
AW Trend Predictor
AW Trading Software Limited
4.65 (26)
Tek bir sistemde trend ve arıza seviyelerinin kombinasyonu. Gelişmiş bir gösterge algoritması piyasa gürültüsünü filtreler, trendi, giriş noktalarını ve olası çıkış seviyelerini belirler. Gösterge sinyalleri, sinyal geçmişinin etkinliğini gösteren en uygun araçları seçmenize izin veren istatistiksel bir modüle kaydedilir. Gösterge Kâr Al ve Zararı Durdur işaretlerini hesaplar. Kılavuz ve talimat ->   Burada   / MT5 versiyonu ->   Burada Gösterge ile nasıl ticaret yapılır: Trend Predictor ile iş
Sense
Ivan Stefanov
SENSE, seçilen GANN yöntemlerini fraktal hesaplamalarla birleştiren otomatik bir sistemdir. Sistem bize işlemlerin nerede açılacağını ve kapatılacağını söyler. Artık karmaşık hesaplamalarla zaman kaybetmenize gerek yok - SENSE sizin için her şeyi yapar. Sadece göstergeyi yükleyin. Temel ilkeler: Fiyat beyaz çizgilerin üzerinde olduğunda piyasa yükselişe geçer Beyaz çizgilerin üzerinde satın alın, altında durun Yeşil çizgiler yukarı yönlü hedeflerdir Fiyat beyaz çizgilerin altında olduğu
Yazarın diğer ürünleri
Trend Master Chart MT5
Frederic Jacques Collomb
5 (1)
Trend Master Chart ihtiyacınız olan trend göstergesidir. Grafiği kaplar ve farklı pazar trendlerini/hareketlerini tanımlamak için renk kodlamasını kullanır. İki hareketli ortalamayı ve farklı osilatörleri birleştiren bir algoritma kullanır. Bu üç elementin periyotları değiştirilebilir. Herhangi bir zaman diliminde ve herhangi bir Çiftte çalışır. Bir bakışta yükseliş veya düşüş trendini ve bu trende farklı giriş noktalarını tespit edebileceksiniz. Örneğin, belirgin bir yükseliş eğilimi sırasın
FREE
Trend Master Chart MT4
Frederic Jacques Collomb
Trend Master Chart ihtiyacınız olan trend göstergesidir. Grafiği kaplar ve farklı pazar trendlerini/hareketlerini tanımlamak için renk kodlamasını kullanır. İki hareketli ortalamayı ve farklı osilatörleri birleştiren bir algoritma kullanır. Bu üç elementin periyotları değiştirilebilir. Herhangi bir zaman diliminde ve herhangi bir Çiftte çalışır. Bir bakışta yükseliş veya düşüş trendini ve bu trende farklı giriş noktalarını tespit edebileceksiniz. Örneğin, belirgin bir yükseliş eğilimi sırasın
FREE
RSI Pro Analyser MT4
Frederic Jacques Collomb
RSI Pro Analyser Göstergesi, aynı anda birden fazla zaman diliminde bilinçli kararlar vermek isteyen yatırımcılar için tasarlanmış güçlü bir araçtır. Bu gösterge aşırı alım, aşırı satış ve trend sinyalleri sağlamak için RSI'yı kullanarak piyasaya giriş fırsatlarını tanımlamayı kolaylaştırır . Farklı piyasa koşullarını gösteren açık ve belirgin renk kodları sayesinde okuma kolaylığı sağlaması en büyük avantajıdır. Gösterge, RSI değerlerini ve ilgili sinyalleri beş farklı zaman diliminde (D,H4,
Trend Grafiği Histogramı, iki hareketli ortalama ve birkaç osilatör kullanan bir algoritmaya dayalı bir göstergedir. Renk kodu sayesinde trendi hızlı bir şekilde tanımlamanıza ve en büyük piyasa hareketlerinden yararlanmanıza olanak tanır. Açık renkler trendi, koyu renkler dürtüleri, gri ise pazara girmemeniz gerektiğini belirtir. MT5 versiyonu burada. Giriş parametreleri: - 1. Dönem (hızlı dönem) - 2. Dönem (yavaş dönem) - Osilatör periyodu İki tür uyarıyı etkinleştirebilirsiniz
Moving Average Scanner, grafiği değiştirmeden, birkaç zaman dilimindeki trendi bir bakışta görmek için mükemmel, çok zaman dilimli bir tarayıcıdır. 9 zaman birimi üzerinden seçtiğiniz 4'e kadar hareketli ortalamayı kullanabilir. Tamamen yapılandırılabilir ve basitçe "sürükle ve bırak" yöntemiyle grafik üzerinde herhangi bir yere taşınabilir. Hareketli ortalamalar 4 farklı hesaplama yöntemiyle yapılandırılabilir. Ayrıca hareketli ortalamaların sayısına ve dönem sayısına göre uyarılar da aya
Trend Grafiği Histogramı, iki hareketli ortalama ve birkaç osilatör kullanan bir algoritmaya dayalı bir göstergedir. Renk kodu sayesinde trendi hızlı bir şekilde tanımlamanıza ve en büyük piyasa hareketlerinden yararlanmanıza olanak tanır. Açık renkler trendi, koyu renkler dürtüleri, gri ise pazara girmemeniz gerektiğini belirtir. MT4 versiyonu burada. Giriş parametreleri: - 1. Dönem (hızlı dönem) - 2. Dönem (yavaş dönem) - Osilatör periyodu İki tür uyarıyı etkinleştirebilirsiniz:
RSI Pro Analyser MT5
Frederic Jacques Collomb
RSI Pro Analyser Göstergesi, aynı anda birden fazla zaman diliminde bilinçli kararlar vermek isteyen yatırımcılar için tasarlanmış güçlü bir araçtır. Bu gösterge aşırı alım, aşırı satış ve trend sinyalleri sağlamak için RSI'yı kullanarak piyasaya giriş fırsatlarını tanımlamayı kolaylaştırır . Farklı piyasa koşullarını gösteren açık ve belirgin renk kodları sayesinde okuma kolaylığı sağlaması en büyük avantajıdır. Gösterge, RSI değerlerini ve ilgili sinyalleri beş farklı zaman diliminde (D,H4,
Filtrele:
İnceleme yok
İncelemeye yanıt