Buy sell stars
- Göstergeler
- Guner Koca
- Sürüm: 1.0
- Etkinleştirmeler: 20
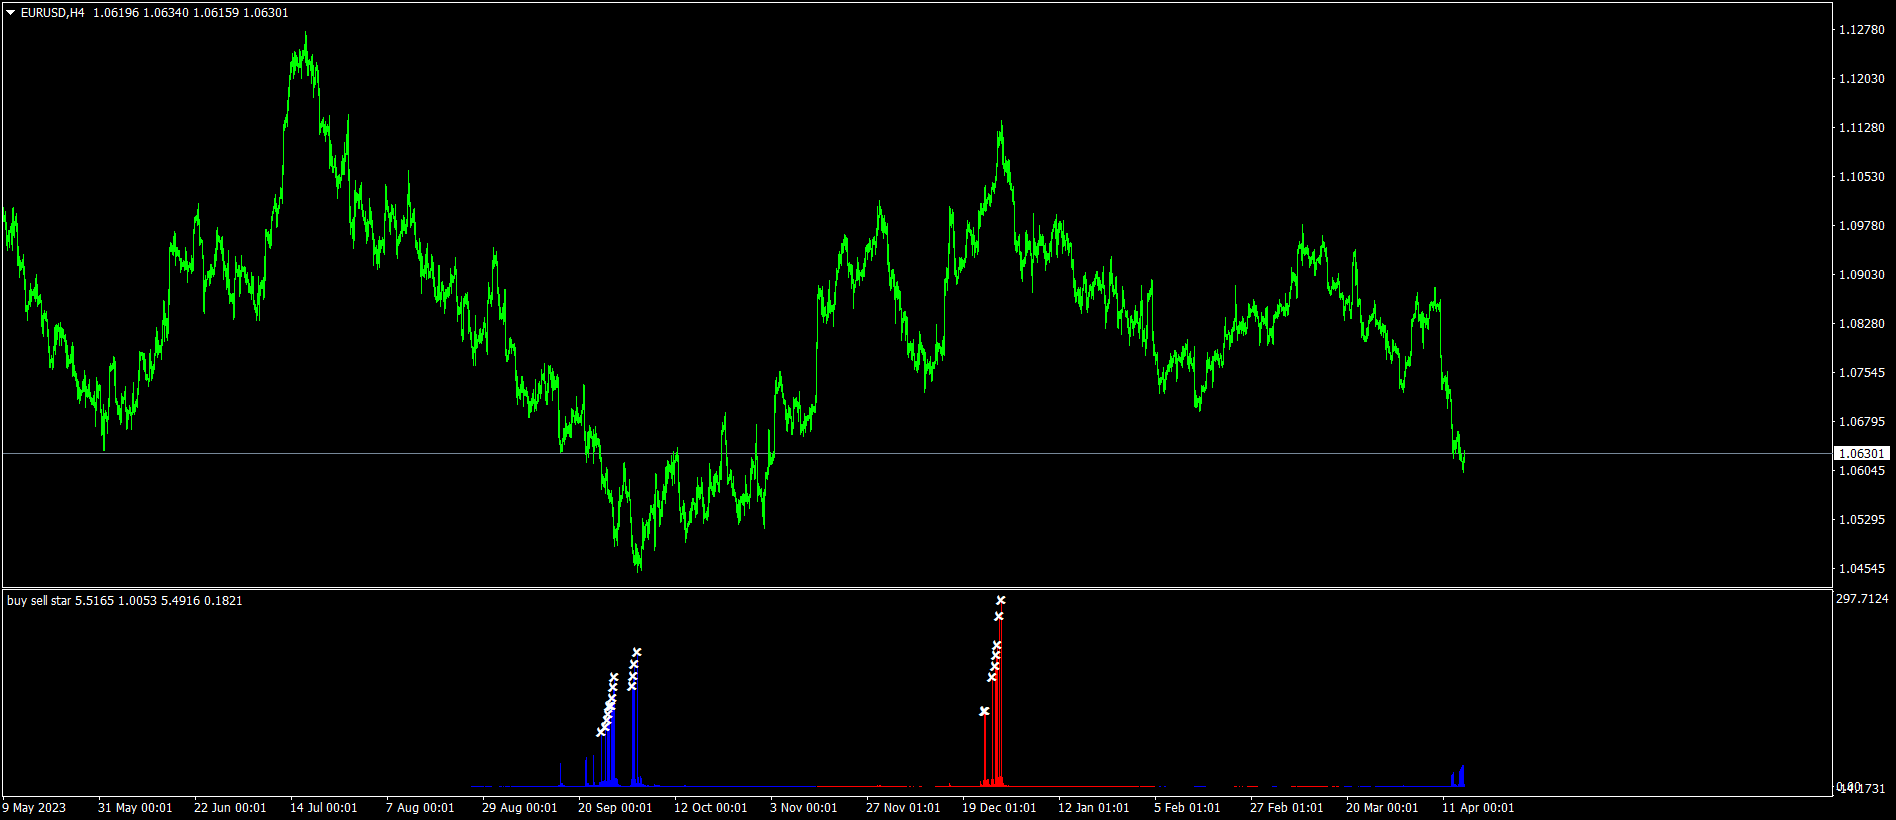
buy sell star indicator has a different algoritms then up down v6 and buy sell histogram indicators.
so that i put this a another indicator on market.
it is no repaint and all pairs and all time frame indicator.
it need minimum 500 bars on charts.
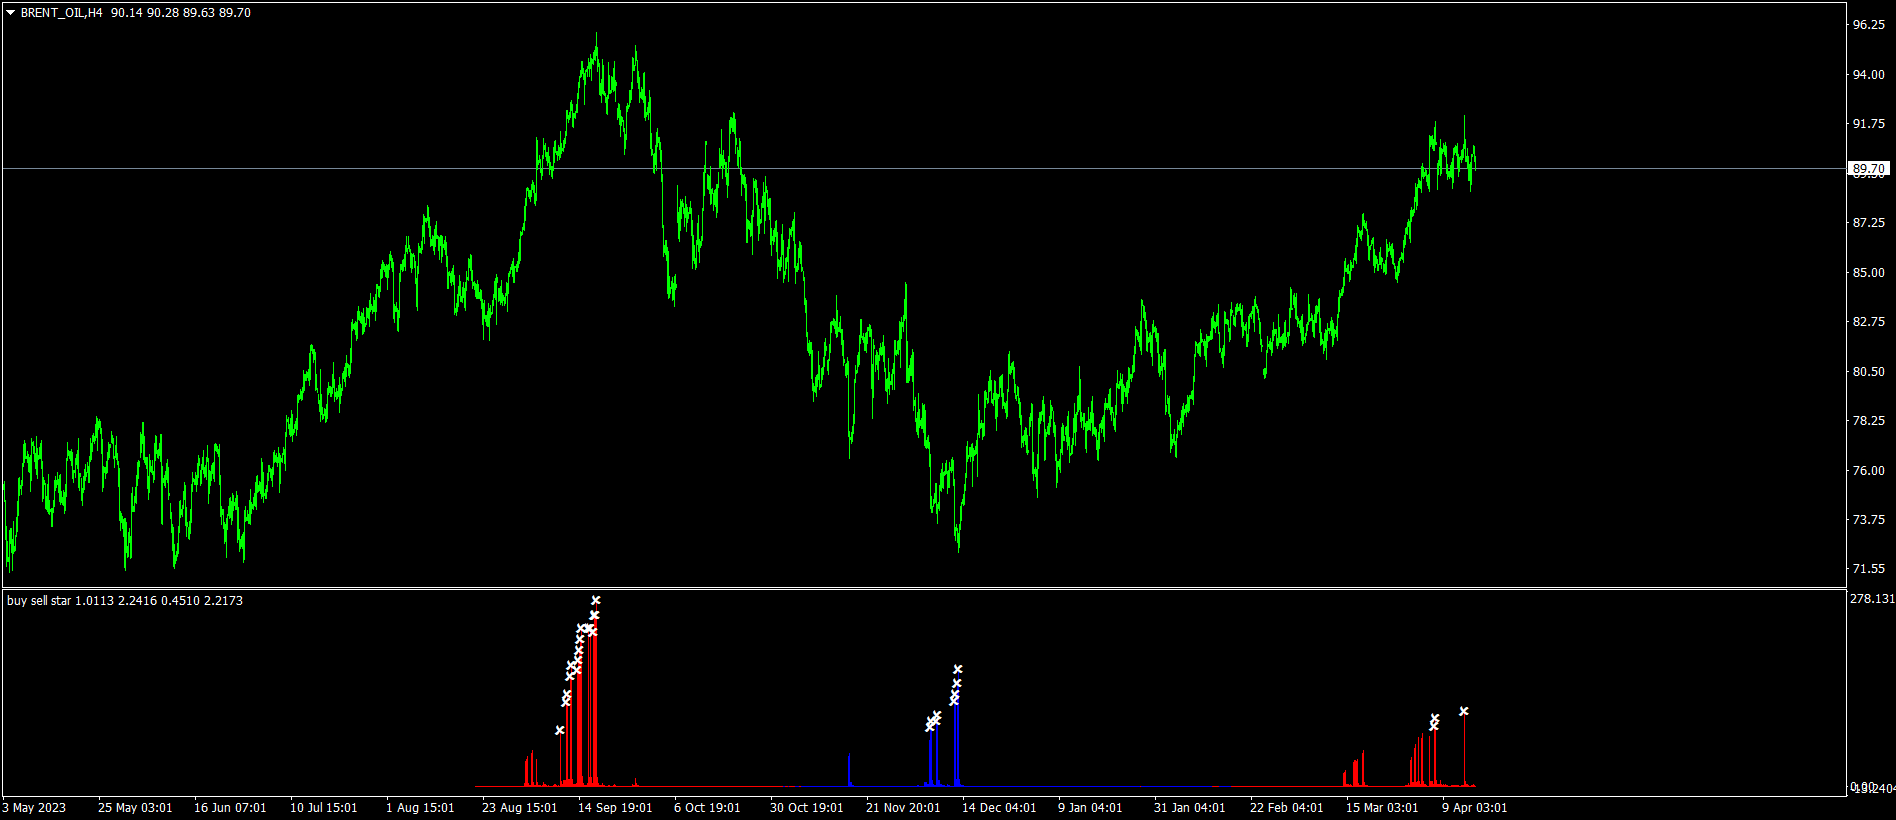
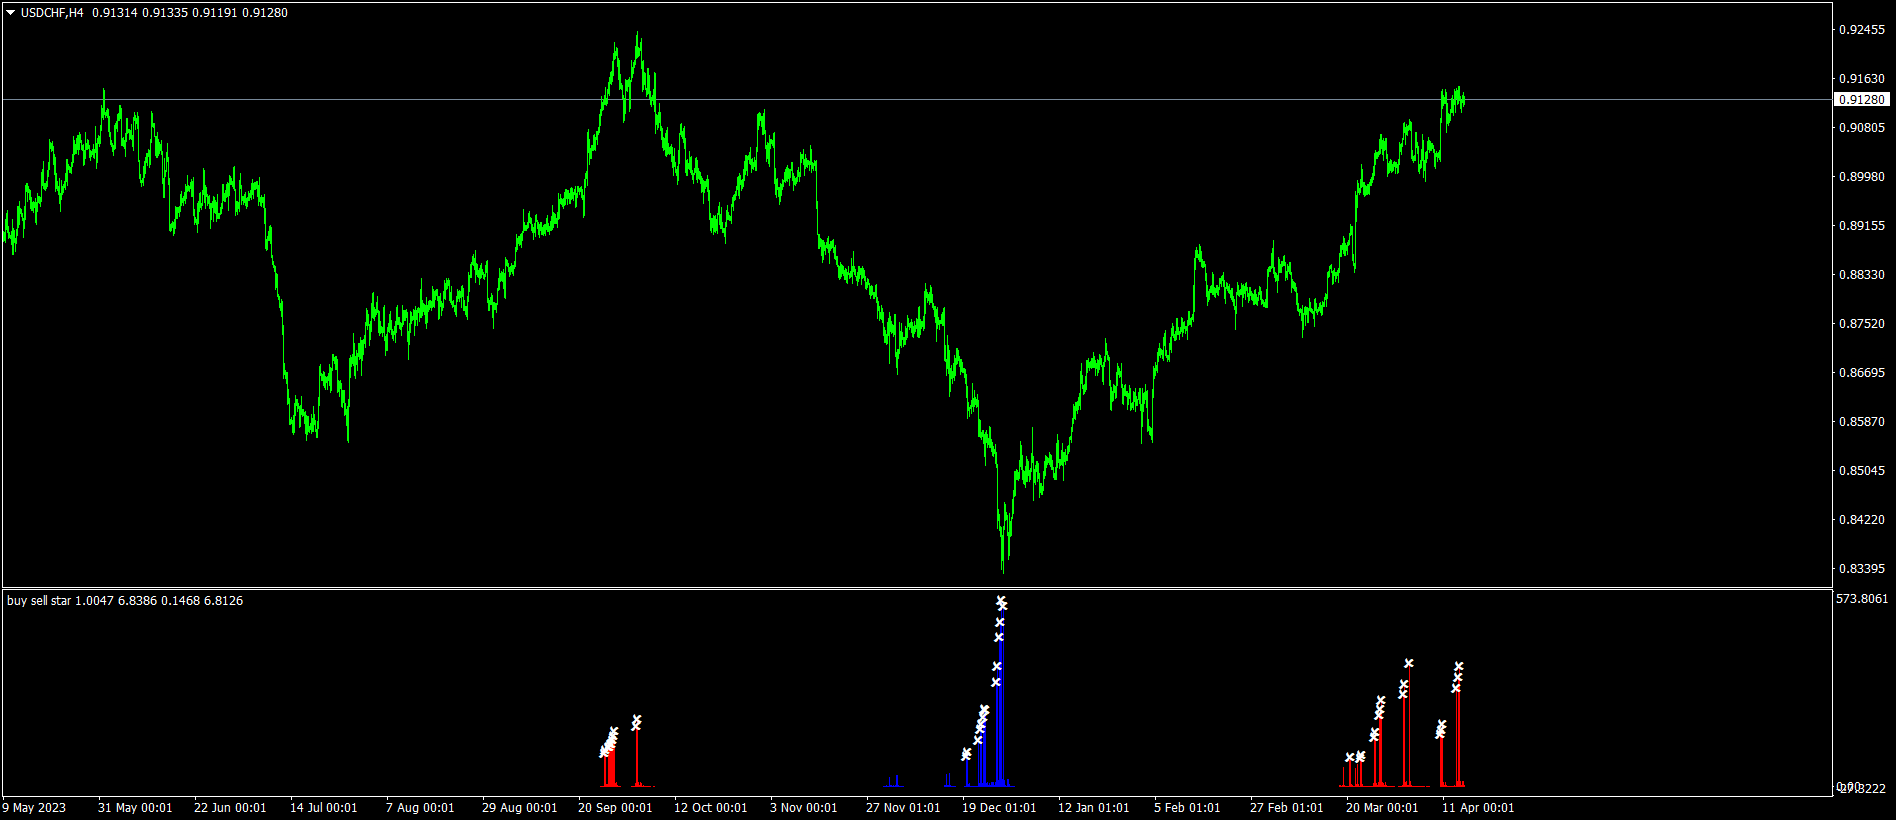
when the white x sign on the red histogram that is sell signals.
when the white x sign on the blue histogram that is sell signals.
this indicator does not guarantie the win.price can make mowement on direction opposite the signals.
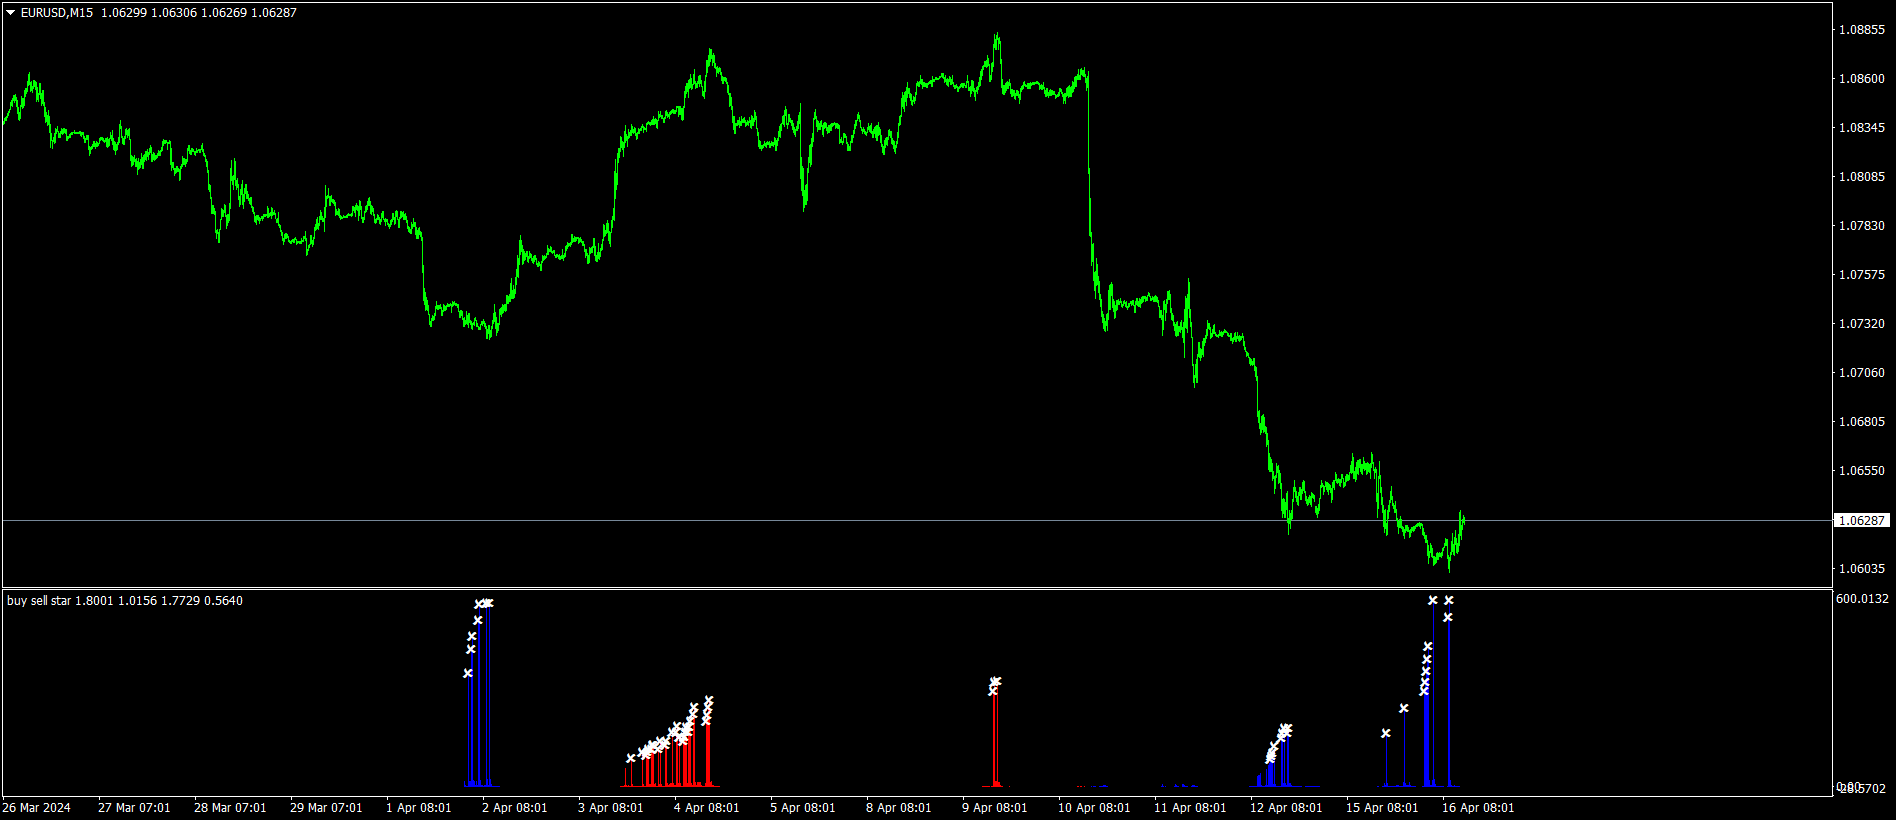
this is multi time frame indicator and need to look all time frames.
sometimes after 1h buy signal ,sell signal can be on the 15m chart.