B4S ChartExplorer
- Göstergeler
- Henry Waribu Macharia
- Sürüm: 2.0
- Güncellendi: 1 Haziran 2024
- Etkinleştirmeler: 5
Brief Description:
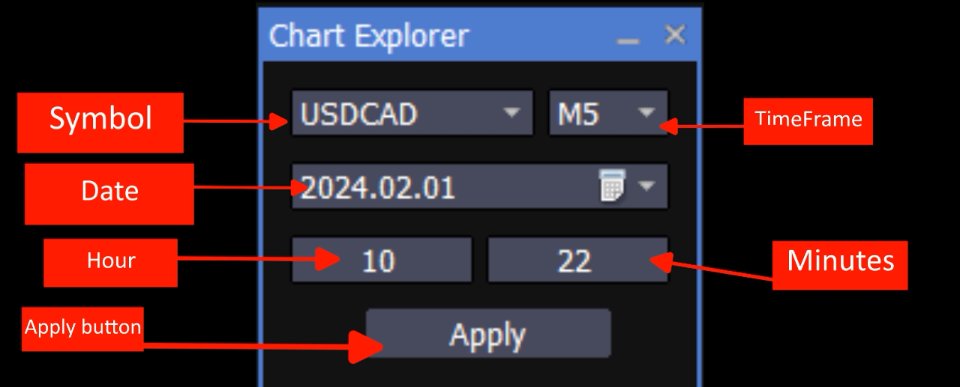
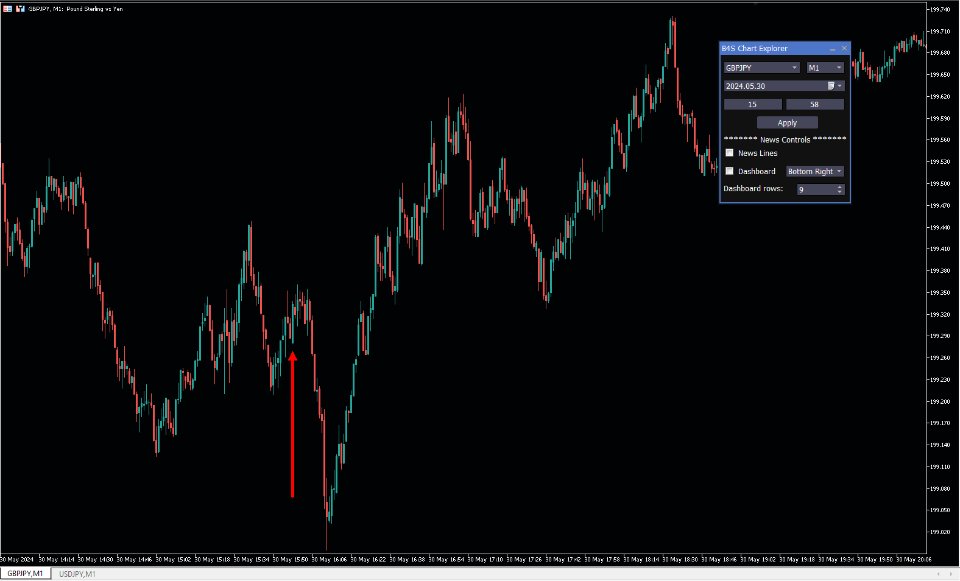
An advanced navigation, news display, and control panel indicator designed to revolutionize your chart analysis experience. Seamlessly navigate through timeframes, dates, and times with an intuitive control panel, and stay informed with visually represented detailed news events. Now with enhanced features and improvements for an even better trading experience.
Key Features:
- User-Friendly Control Panel:
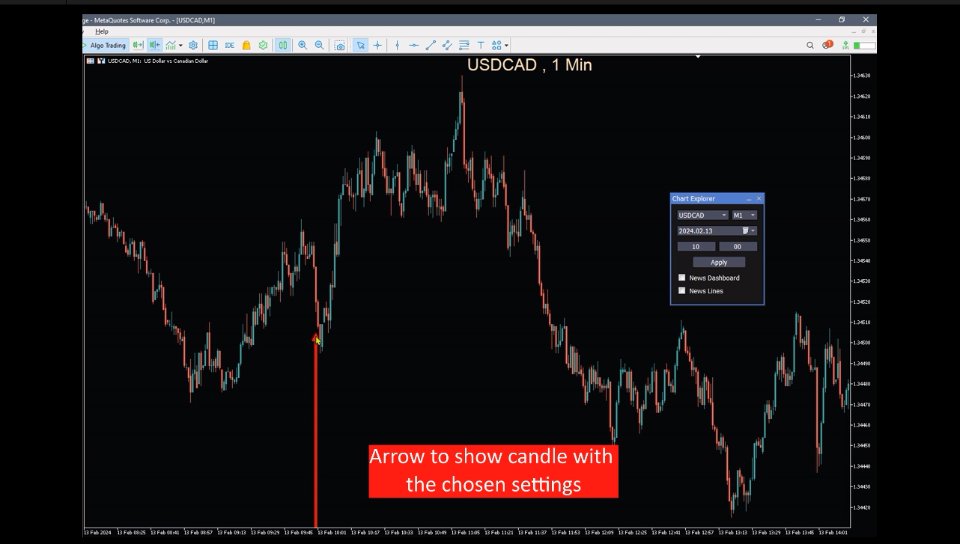
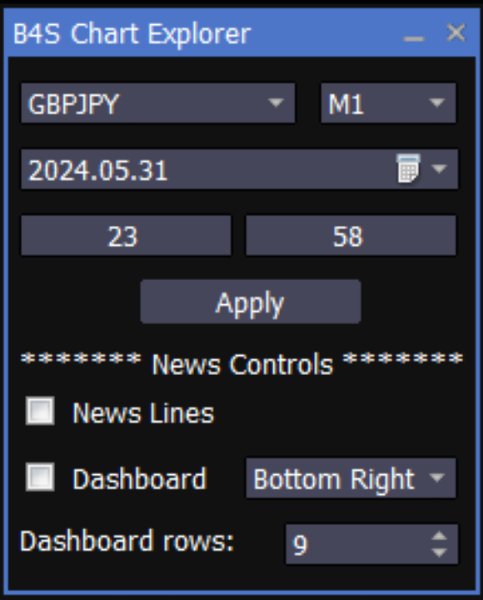
- Easily navigate through timeframes, dates, and times.
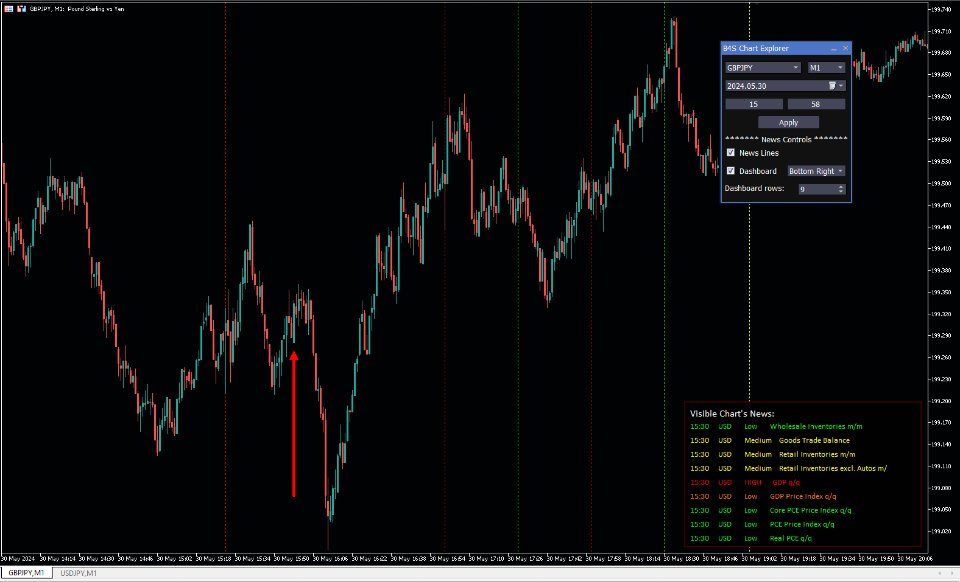
- Enable or disable the display of news events with a simple checkbox control.
- New: Customize news dashboard position and choose the number of items to display.
- Seamless Navigation:
- Effortlessly navigate through various timeframes, dates, and times with our user-friendly panel. Gain a comprehensive view of historical and real-time data to make informed trading decisions.
- News Visualizations:
- Take charge of your analysis by enabling or disabling the display of news within the visible chart range. Our indicator ensures that you have complete control over the information presented on your chart.
- View news events as vertical lines or in a comprehensive dashboard. Dashboard allows for a quick overview, while vertical lines pinpoint news datetimes on the chart.
- New: Improved organization of items in the news modal for better readability and analysis.
- Modal Dialog for In-Depth News Details:
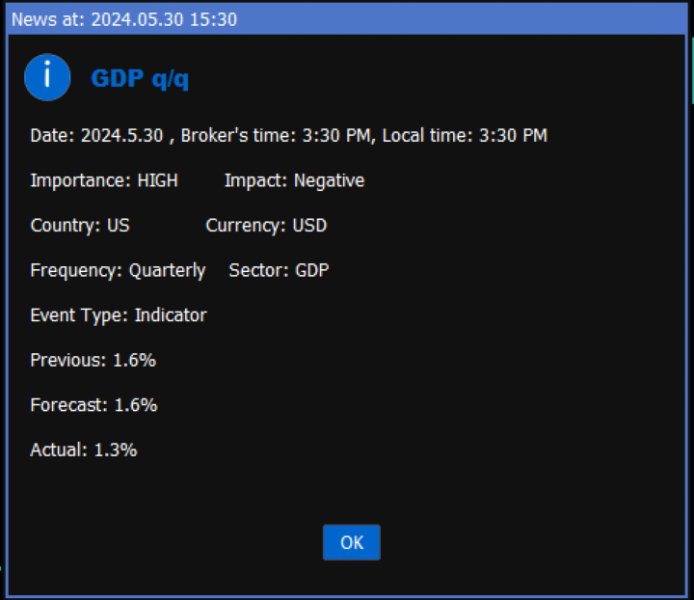
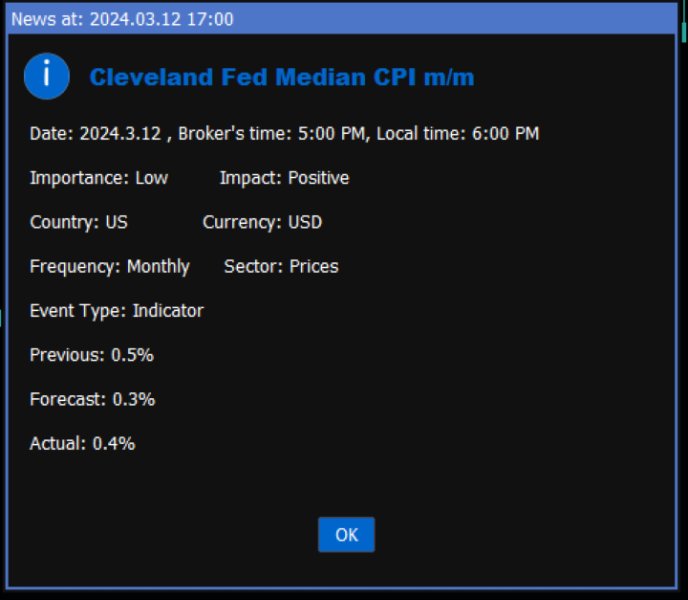
- For a more detailed analysis, simply click on a news event in the dashboard. A modal dialog will promptly appear, offering comprehensive information about the selected news event. Dive into key details without leaving your chart.
- New: Show news event times in both broker's time zone and local time zone.
- Persistent User Preferences:
- Set your preferred settings once, and they will be saved for future restarts.
- Modify saved settings easily using a Boolean toggle in the input section.
- News Customizations:
- Specify country codes for relevant news.
- Define personal high-impact news terms to focus on essential events.
Settings:
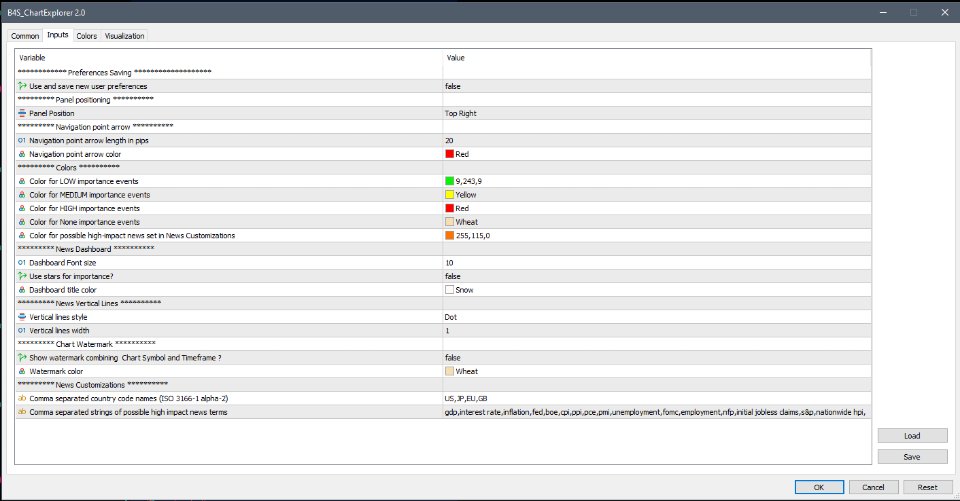
- Preferences Saving: Choose whether to save your personalized settings for future restarts. This feature allows you to set your preferred configurations once and ensures they persist across different trading sessions. Easily toggle between saved settings and make adjustments as needed for a seamless and consistent user experience.
- Panel Positioning: Optimize your chart layout by selecting the position of the control panel. Tailor the panel placement to suit your preferences, ensuring easy access and visibility without cluttering your trading environment.
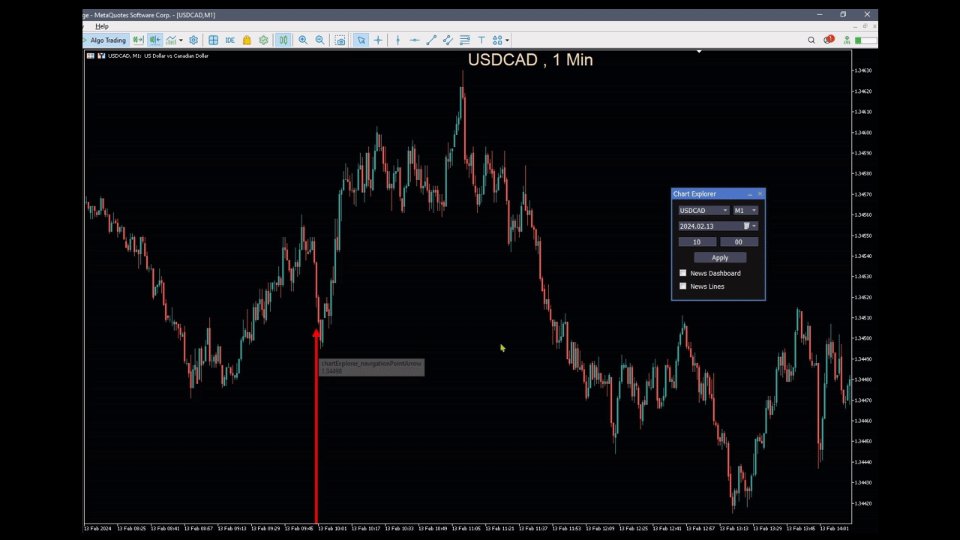
- Navigation Point Arrow: Customize the appearance of the navigation point arrow for easy identification. Adjust the arrow length and color to enhance visibility and streamline your navigation through different timeframes, dates, and times.
- News Customizations: Tailor the indicator to your specific needs with news-related settings. Define the country codes for relevant news and set possible high-impact news terms. Personalize the visual representation of news events with distinct colors for different importance levels.
- Dashboard Customization: Configure the news dashboard to meet your preferences. Choose its position on the chart, set the number of events displayed, and adjust the font size for optimal readability. Optionally use importance stars to enhance the visual representation of news events in the dashboard.
- Vertical Lines Customization: Fine-tune the appearance of vertical lines representing news events. Specify the number of weeks for which vertical lines are plotted, choose the line style and width for clear visibility on the chart.
- Color Customization: Personalize the colors associated with different news event importance levels. Easily distinguish between low, moderate, and high-impact events, as well as events with no assigned importance. Enhance the visual appeal of your chart while staying informed.
- Save and Toggle Settings: Save your preferred settings effortlessly. Activate changes with a simple toggle, allowing you to update your configurations on the go. This user-friendly approach ensures that you have the flexibility to adapt your settings according to evolving market conditions.
Why ChartExplorer?
- Historical Insights: Delve into the past to analyze how different news events influenced market trends. Gain a comprehensive understanding of historical market reactions to news, empowering you to make informed decisions.
- Strategic Adaptation: Armed with historical data, adapt your trading strategy based on how the market responded to specific news events in the past. Anticipate potential market reactions and refine your approach for optimal results.
- Risk Mitigation: Identify patterns in market behavior following news releases. Use this knowledge to anticipate and mitigate potential risks, enhancing your risk management strategies.
How:
- Navigate Seamlessly: Effortlessly navigate through different timeframes, dates, and times using the user-friendly control panel. Review past market conditions with precision and speed.
- Visualize News Events: Enable the display of news events within the visible chart range. Visually represent news events as vertical lines or explore a comprehensive dashboard view. Click on news events for detailed information.
- Persistently Saved Settings: Set your preferred analysis parameters once, and the B4S ChartExplorer saves them for future restarts. Adjust saved settings easily when needed to adapt to changing market conditions.
The Results:
- Informed Decision-Making: Leverage historical analysis to make well-informed decisions based on past market behavior. Anticipate potential market movements and respond proactively to changing conditions.
- Strategic Optimization: Optimize your trading strategy by learning from historical data. Identify what worked in the past and refine your approach for improved performance in the future.
- Enhanced Confidence: Gain confidence in your trading decisions by understanding the historical context of market movements. Use this confidence to navigate volatile markets with greater assurance.
- Efficient Risk Management: Develop more robust risk management strategies by recognizing patterns in market reactions. Mitigate risks effectively and protect your capital with a deeper understanding of historical trends.
Related Topics:
- B4S
- B4S Indicators
- #Historical Market Analysis
- #Historical Market Insights
- #Post-Market Analysis
- #News Event Impact Analysis
- #Technical Analysis Tools
- #Trading Strategy Optimization
- #Market News Visualization
- #Timeframe Navigation Tools
- #Charting Tools for Traders
- #Market Volatility Analysis
- #Chart Navigation Techniques
- #Price Action Analysis
- #Backtesting Strategies with News Events
- #Historical Data Visualization
- #Technical Analysis Patterns
- #Market Trend Analysis
- #Backtesting Navigation Tools
- #Navigating Historical Market Trends
- #Maximizing Insights with Historical Data
- #Backtesting Tools
- #Analyzing Market Dynamics
- #Historical Market Performance Analysis
- #Backtesting Indicators
