Quintet EMA
- Göstergeler
- Jithin Sajan Sajan
- Sürüm: 1.2
Kindly rate and comment about the product for upgradation & Support
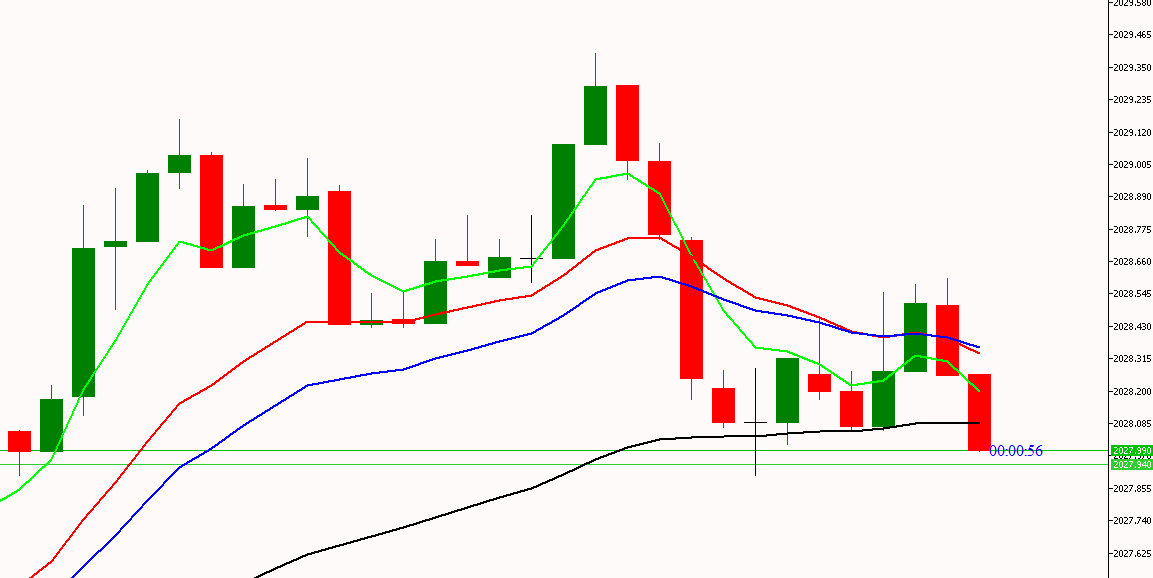
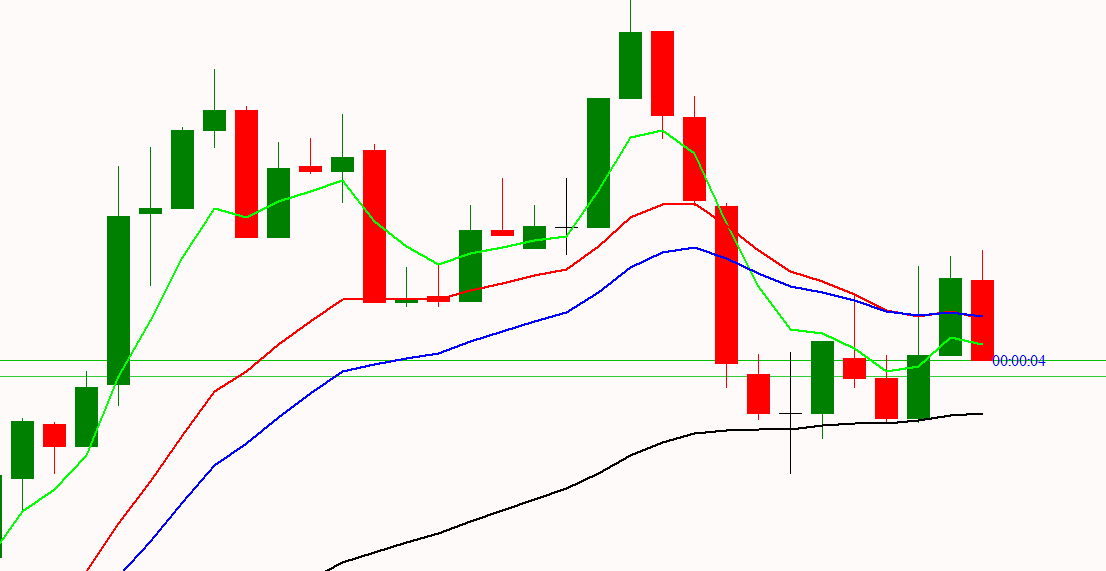
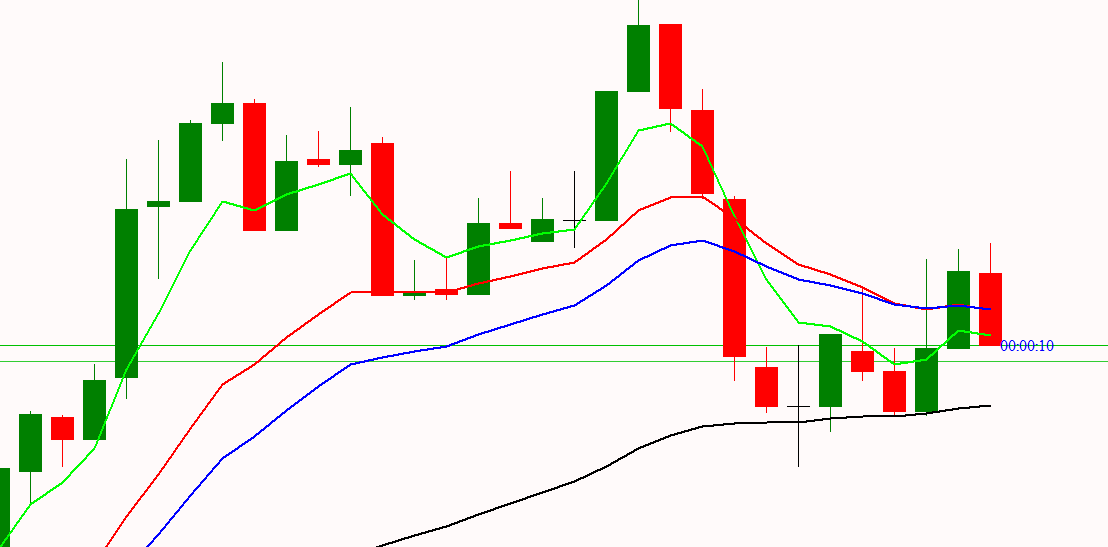
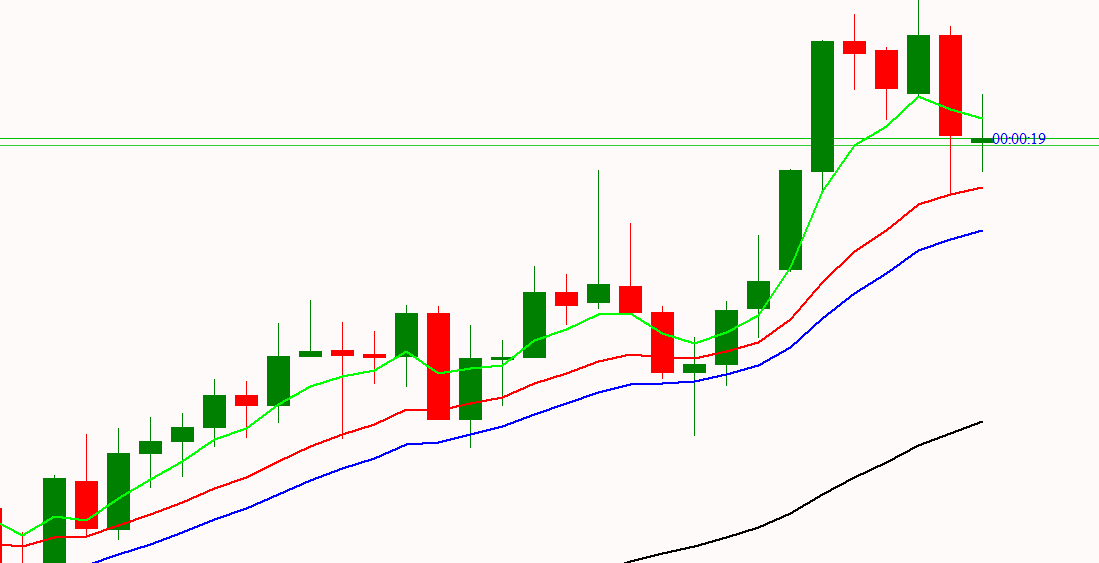
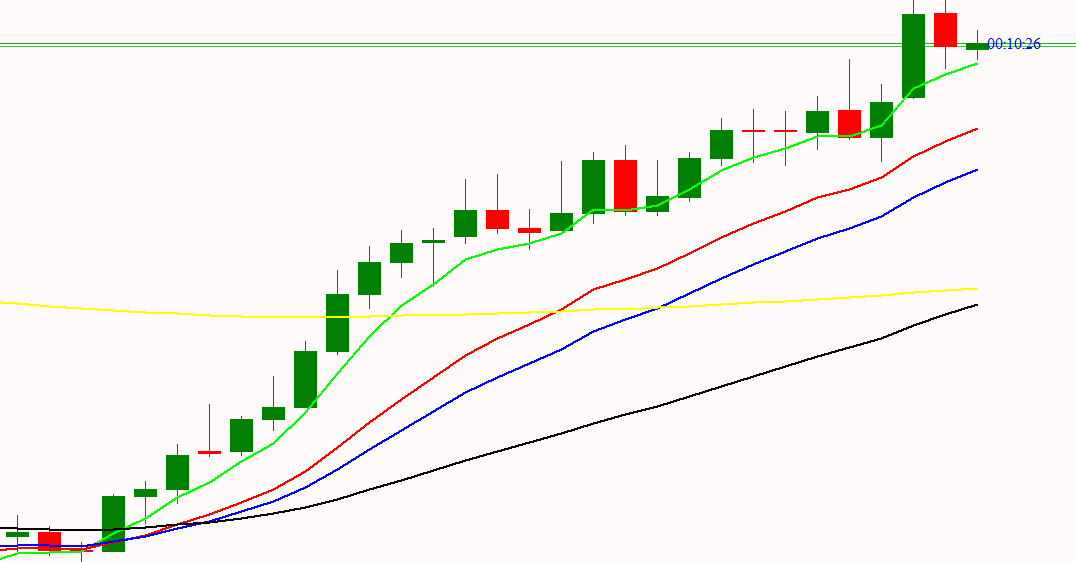
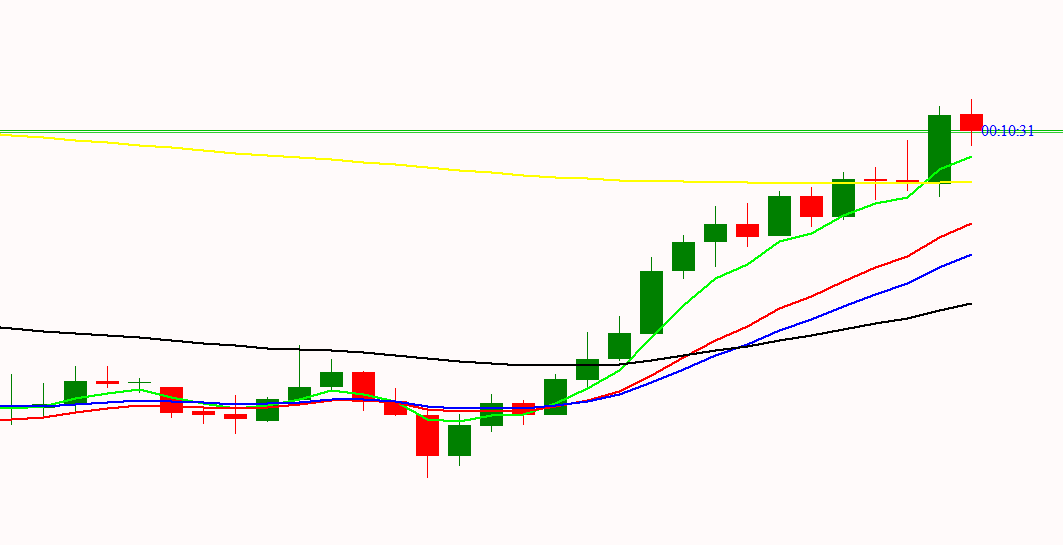
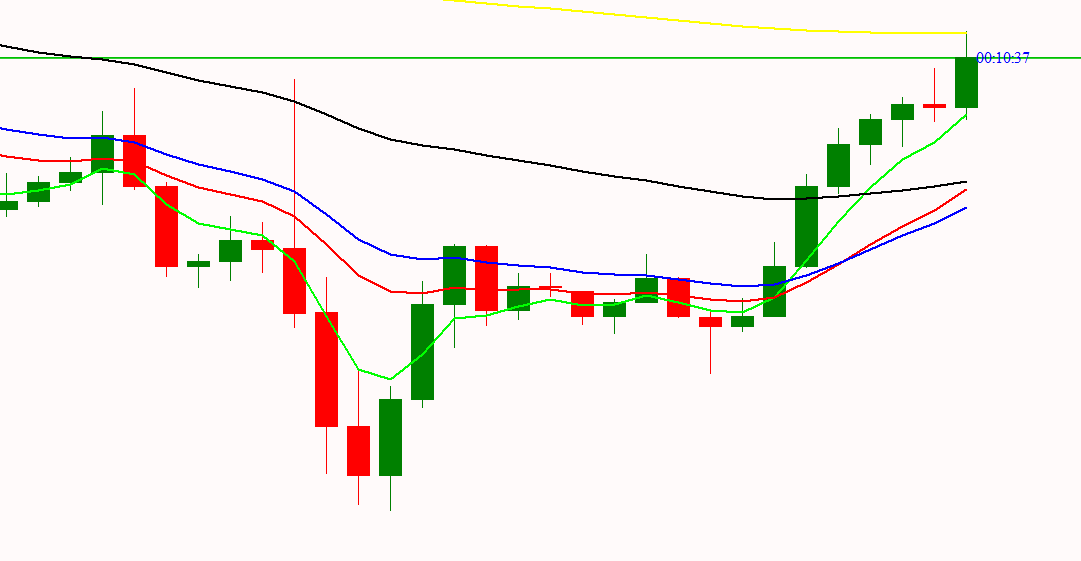
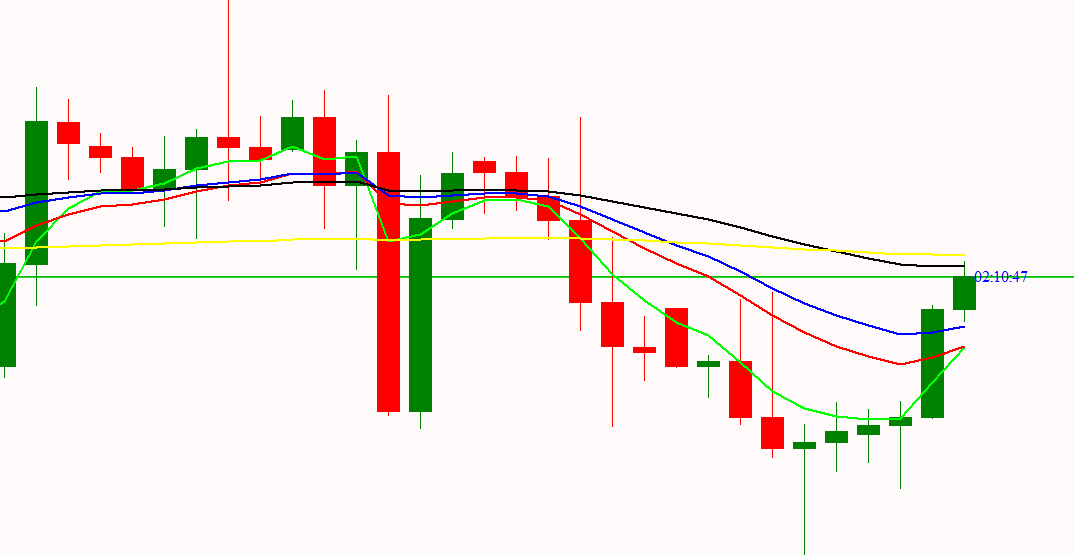
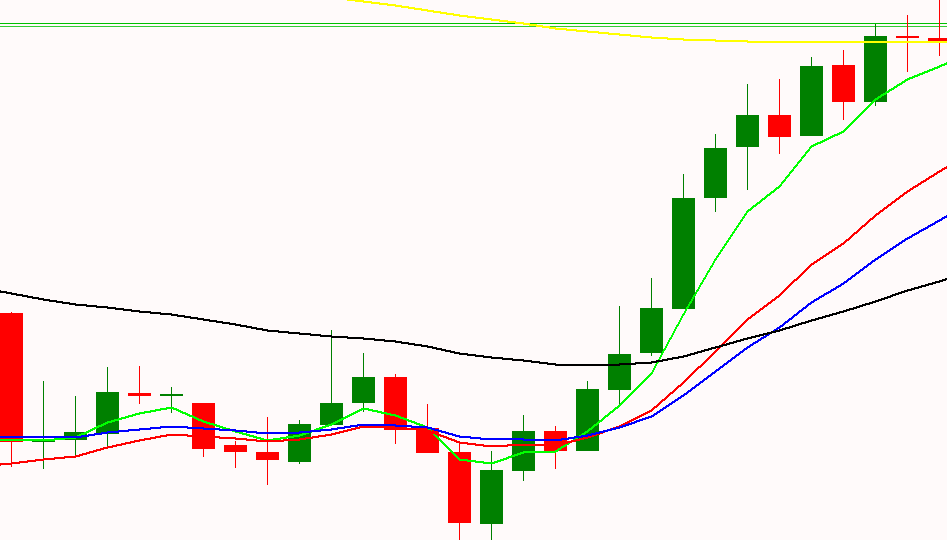
The 5 EMA is plotted in green color ( Lime ).
The 14 EMA is plotted in red color ( Red ).
The 20 EMA is plotted in blue color ( Blue ).
The 200 EMA is plotted in black color ( Black ).
The 200 EMA is plotted in yellow color ( Yellow ).
The Quarter EMA that provided calculates and plots four Exponential Moving Averages (EMAs) on the chart using different periods: 5, 14, 20, and 200. Each EMA is represented by a different color on the chart. Here's a description of each EMA:
-
5 EMA (Exponential Moving Average): The 5 EMA is a short-term moving average that gives more weight to recent price data. It reacts quickly to price changes and provides a smoother representation of recent price trends. Traders often use the 5 EMA to identify short-term trends and potential entry or exit points for trades.
-
14 EMA (Exponential Moving Average): The 14 EMA is a medium-term moving average. It strikes a balance between responsiveness to recent price movements and smoothing out noise. Traders use the 14 EMA to gauge the direction of medium-term trends and confirm potential trade signals.
-
20 EMA (Exponential Moving Average): The 20 EMA is also a medium-term moving average. It is similar to the 14 EMA but places slightly more weight on recent price data. Traders often use the 20 EMA in conjunction with other EMAs to identify potential trend reversals and trade entries.
-
50 EMA (Exponential Moving Average): The 50 EMA is a long-term moving average. It smooths out price data over a longer period and is often used to identify the overall direction of long-term trends. Traders and investors commonly use the 200 EMA to determine the prevailing market trend and make strategic decisions.
-
200 EMA (Exponential Moving Average): The 200 EMA is a long-term moving average. It smooths out price data over a longer period and is often used to identify the overall direction of long-term trends. Traders and investors commonly use the 200 EMA to determine the prevailing market trend and make strategic decisions.
By plotting these four EMAs on the chart, the indicator can provide valuable insights into the market's short-term, medium-term, and long-term trends. Traders can use the crossovers of these EMAs or their relationship to price action to make informed trading decisions. For example, a golden cross (where the short-term EMA crosses above the long-term EMA) is often considered a bullish signal, while a death cross (where the short-term EMA crosses below the long-term EMA) is considered bearish. Similarly, the distance between price and these EMAs can indicate the strength of a trend or potential overbought/oversold conditions.
Please note that the indicator uses the Exponential Moving Average (EMA) calculation method, which places more weight on recent prices. Traders should consider combining this indicator with other technical analysis tools and risk management techniques for a comprehensive trading strategy.