TW Session MT4
- Göstergeler
- Altan Karakaya
- Sürüm: 1.2
- Güncellendi: 2 Mart 2024
- Etkinleştirmeler: 5
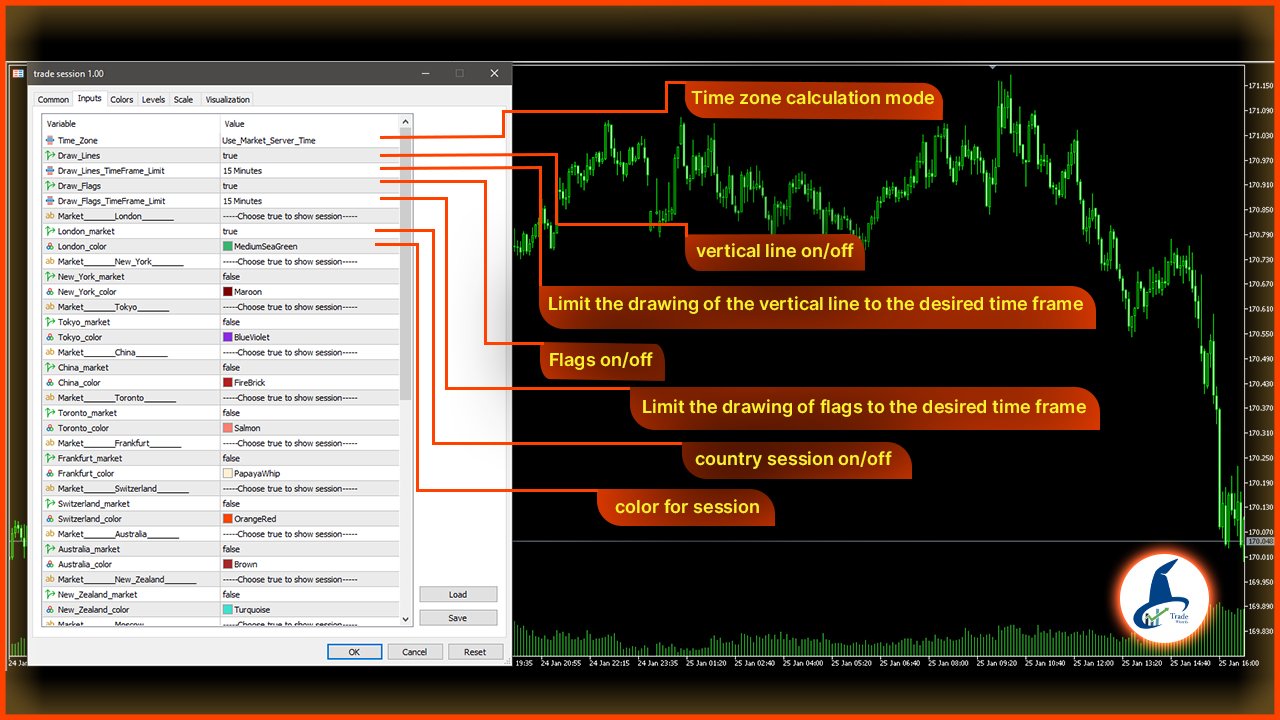
Bu ürün, broker sunucunuzun saat dilimine göre 15 ülkenin işlem seanslarını ve grafik sıkışıklığını önlemek için istediğiniz ayarlara göre çeşitli görüntüleme modlarını görüntülemek ve kullanıcının istediği zamana göre seans ayarlama imkanı sunmak üzere tasarlanmıştır.
Forex piyasasında güneş asla batmaz, ancak ritmi farklı işlem seanslarının ritmine göre dans eder. Bu oturumları, örtüşmelerini ve benzersiz atmosferlerini anlamak, piyasaya karşı değil, piyasaya karşı hareket etmek isteyen herhangi bir forex yatırımcısı için çok önemlidir.
| Tokyo | China | London | Canada | New York | Moscow | Saudi Arabia | ... | |
| USDJPY | *** | * | *** | |||||
| AUDJPY | *** | |||||||
| NZDUSD | * | *** | ||||||
| EURAUD | ** | |||||||
| GBPUSD | *** | *** | ||||||
| EURCHF | *** | |||||||
| USDCHF | * | *** | ||||||
| GBPJPY | *** | *** | ||||||
| EURUSD | *** | *** | ||||||
| USDCAD | *** | *** | ||||||
| EURCAD | *** | |||||||
| XAUUSD | * | ** | ** | **** | ||||
| BRN | * | **** | ** | ** | ||||
| WTI | * | **** | ** | ** |
- Oturum süresini piyasa izlenme süresine dönüştürün
- Kişiselleştirme olanağıyla 15 ülkenin oturumlarına erişim
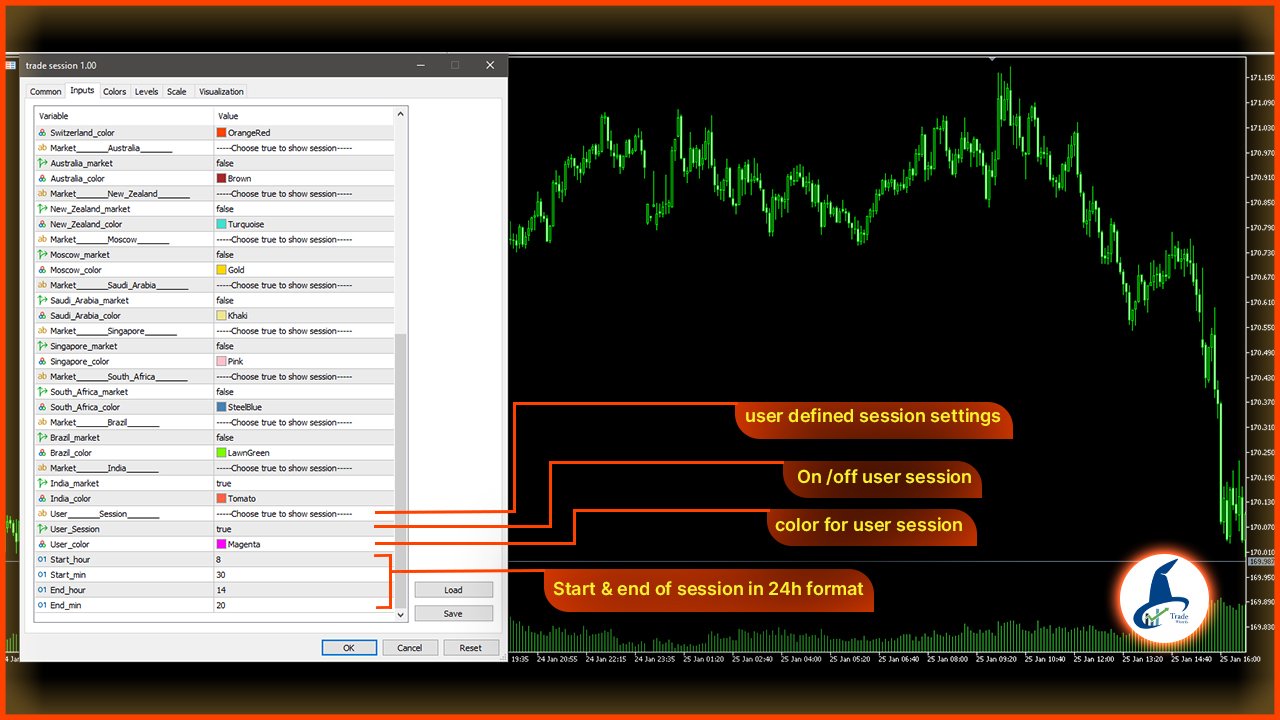
- Kişisel oturum oluşturma yeteneği
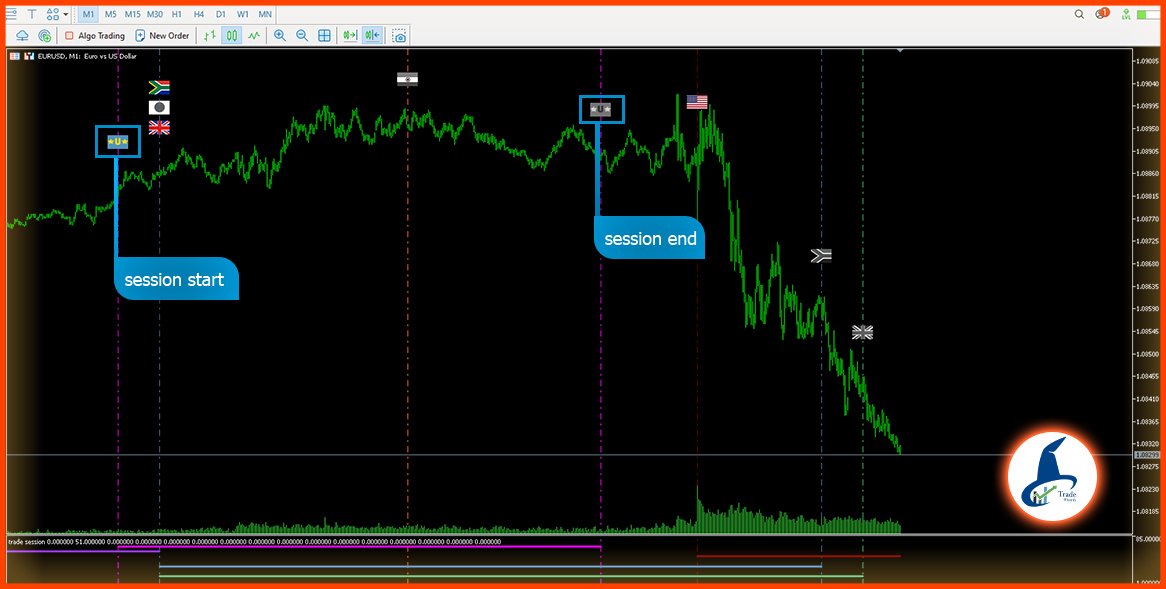
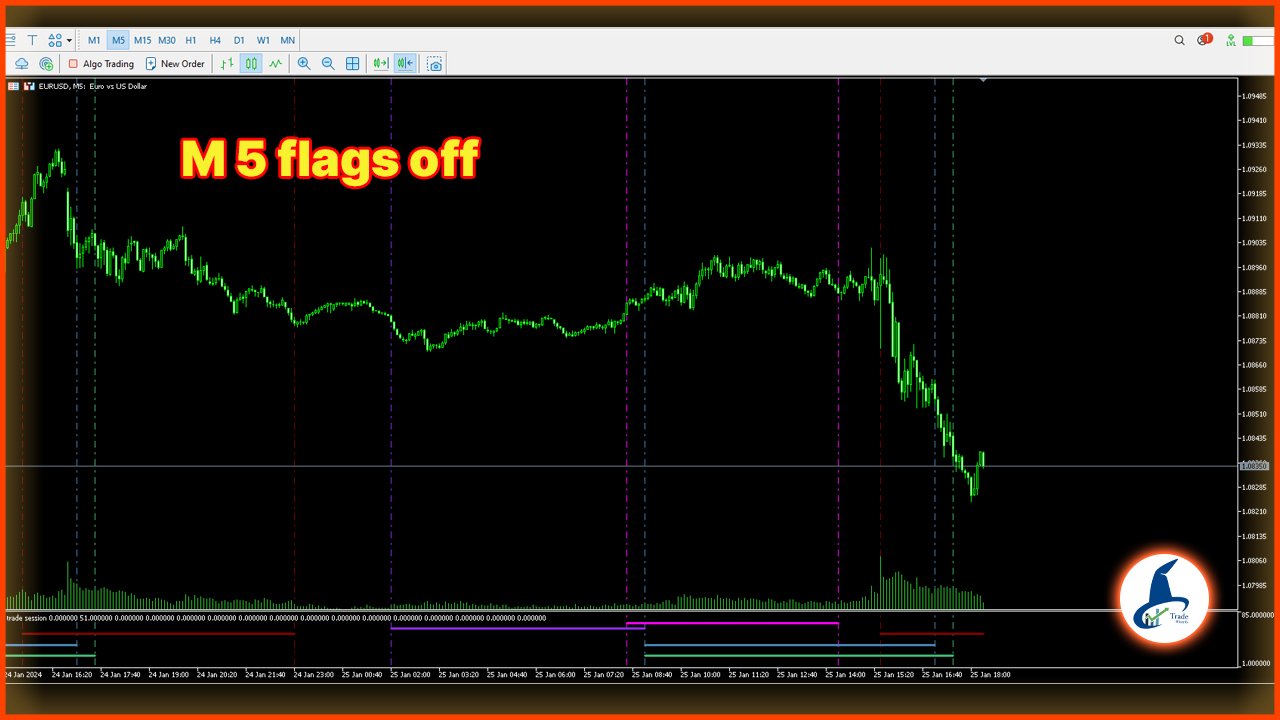
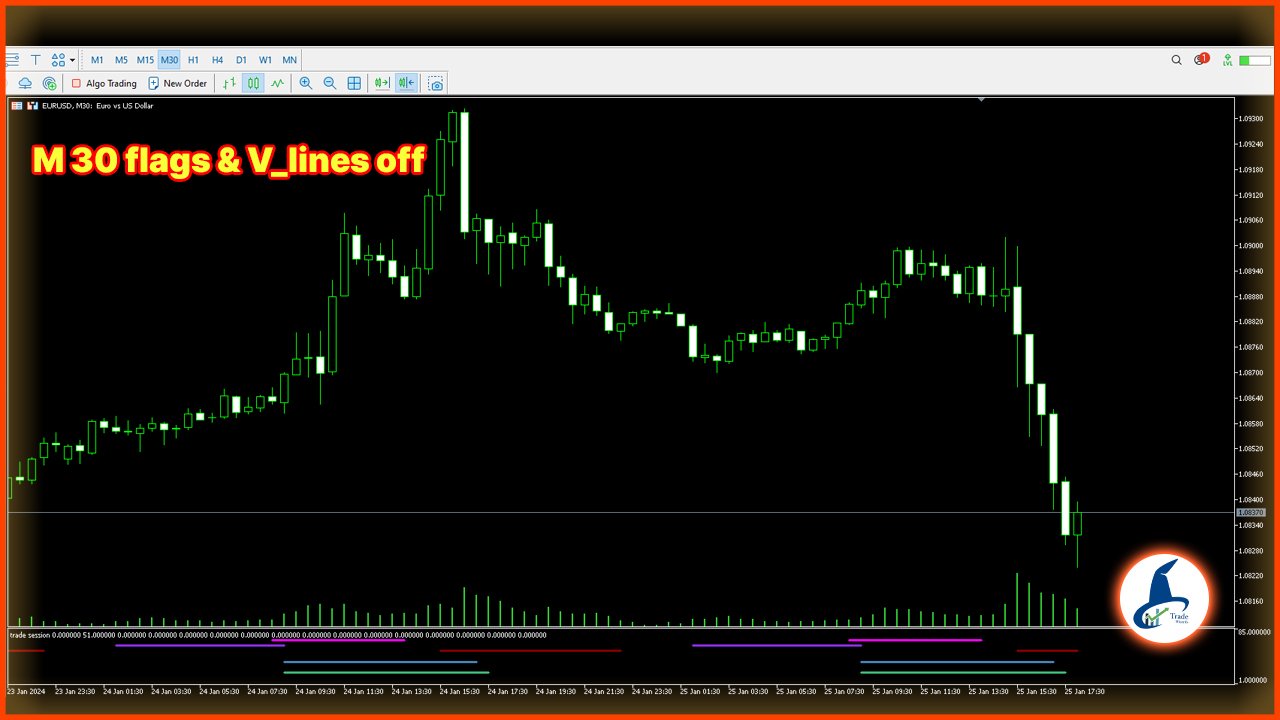
- Seansları kişisel ayarlarla 3 görüntüleme modunda gösterin: Osilatör olarak, Grafikte seansın başında ve sonunda bayrak, Grafikte dikey çizgiler
- Görüntüleme modlarını kullanıcının istediği zaman dilimiyle sınırlama
- Her oturum için özel renk ayarları
Her işlem seansı, ülkenin yerel saatindeki bir saate göre yapılır ve ülkenin saat dilimine göre (GMT) ve (Yaz saati uygulaması) temel alınarak farklı bir saat ayarlanır. Ayrıca grafiğiniz, komisyoncunuzun sunucusunun saat dilimindeki mumları izler. Bu nedenle, seansın tam açılış mumunu elde etmek için zaman farkları komisyoncunun saat dilimine göre hesaplanmalıdır. Bu araç bu zaman farkı hesaplamalarını gerçekleştirir ve işinizi kolaylaştırır.
Farklı para birimlerinin alım satımı için farklı seanslar ve 4'ten fazla ana seans etkilidir. Bu araçta 15 farklı ülkeye ait döviz çiftleri, endeksler ve emtialar üzerinde etkili olan seanslar hazırlanmakta ve kullanıcının ihtiyacına göre aktif hale getirilebilmektedir.
[İNGİLTERE, ABD, HİNDİSTAN, SİNGAPUR, ÇİN, KANADA, AVUSTRALYA, JAPONYA, YENİ ZELANDA, ALMANYA, RUSYA, İSVİÇRE, GÜNEY AFRİKA, BREZİLYA, SUUDİ ARABİSTAN]
Belirli bir zaman dilimine bağlı bir işlem stratejiniz varsa ve bu göstergede tanımlanan seansların dışında ise istediğiniz süreyi görüntülemeniz mümkündür.
Daha fazla doğruluk ve hassas mum çubuğu tanımlaması için grafikte dikey çizgiler görüntülenen her seansın başlangıcı ve bitişi.


Kullanıcı incelemeye herhangi bir yorum bırakmadı