• Genel bakış
  • İncelemeler
  • Yorumlar
  • Yenilikler

Master OBV

🚀 MasterOBV: Pazar Trendlerini Hassasiyetle Yönetin!

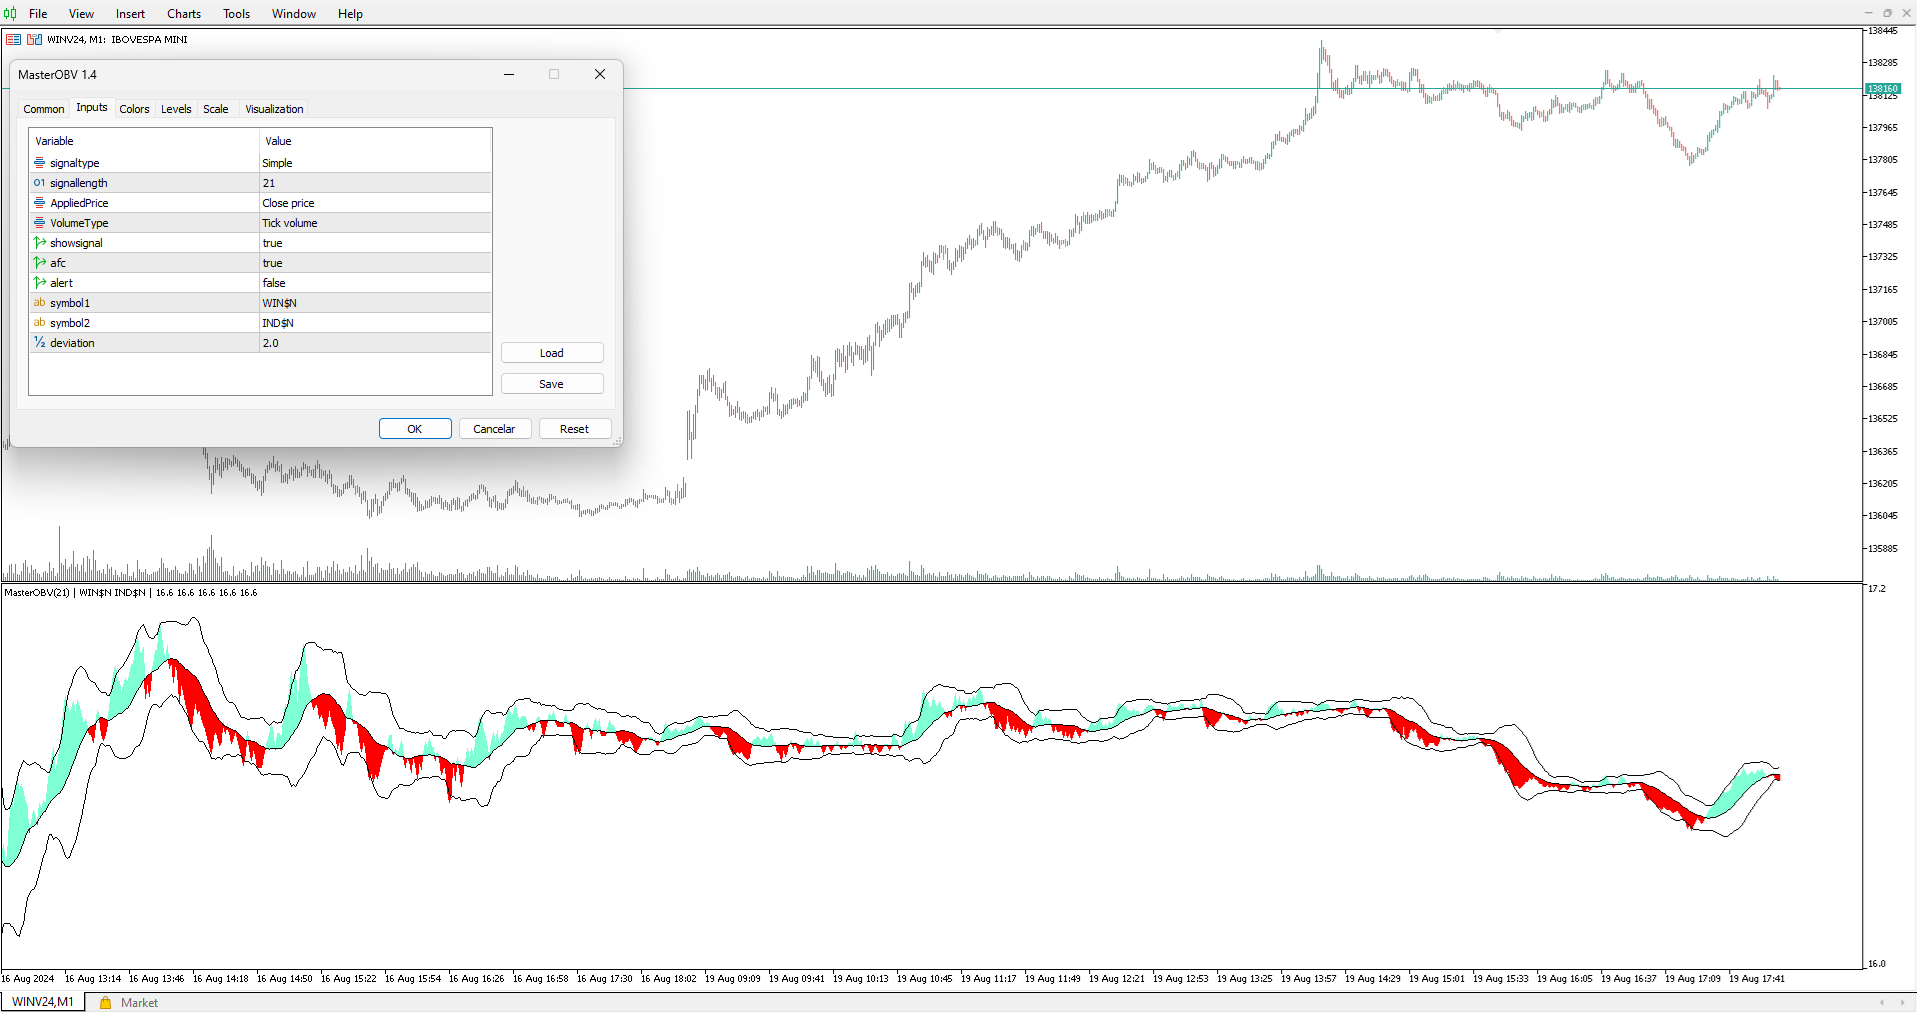
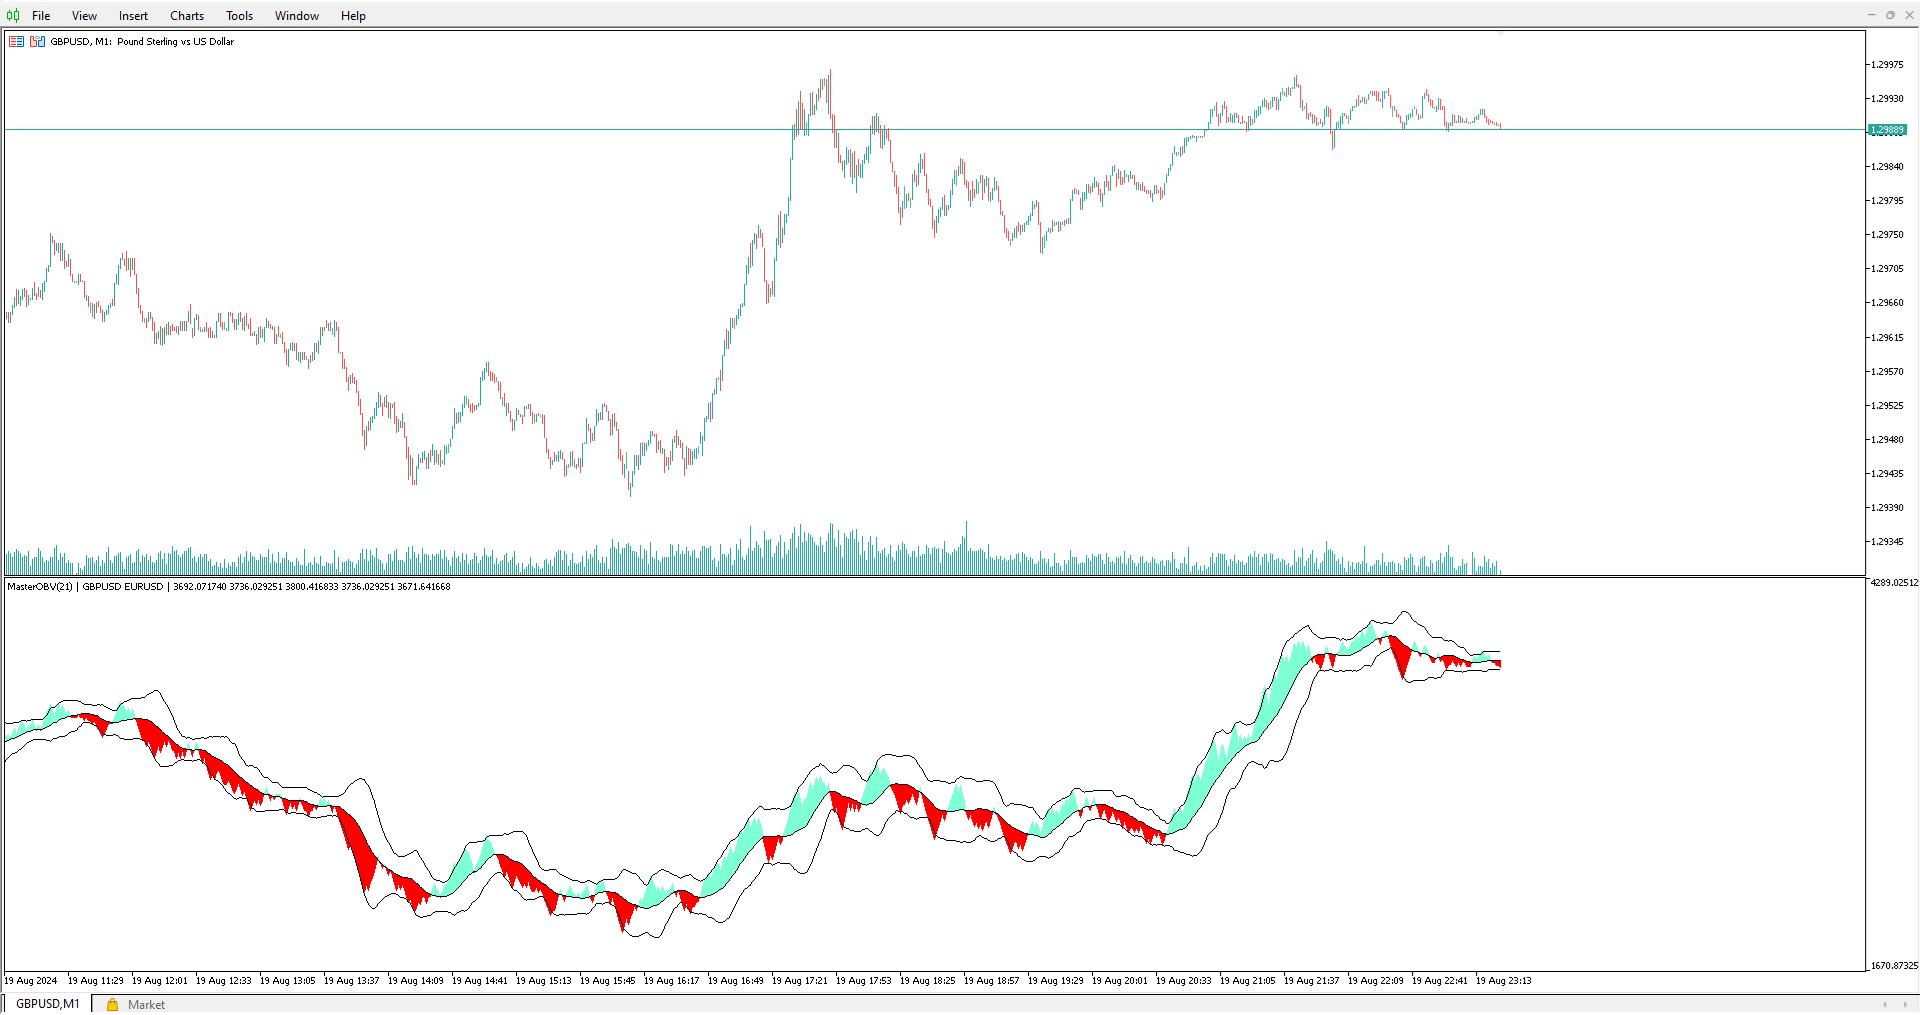
MasterOBV, hacim, pozitif korelasyon ve Hareketli Ortalama (MA) kombinasyonunu kullanarak finansal piyasalarda trendleri tanımlama yeteneğini artıran bir teknik analiz göstergesidir.

🔍 Ana Özellikler:

  • 📊 Akıllı Hacim: Ticaret hacmini analiz ederek trend gücündeki önemli değişimleri belirler.
  • 🔗 Pozitif Korelasyon: Korele olmuş varlıkları dahil ederek daha geniş ve doğru bir bakış açısı sağlar, çiftlerin hacmine dayalı olarak fiyat kayması potansiyelini güçlendirir.
  • 📈 Görsel Kanallar: Görsel kanalları kullanarak trendlerin devam ve dönüş potansiyelini net ve doğru bir şekilde değerlendirir, sezgisel bir görsel analiz sunar.
  • 📉 Düzeltilmiş Hareketli Ortalama: MA, fiyat dalgalanmalarını yumuşatarak temel trend yönünü daha kolay tanımlamanızı sağlar.

🎯 Neden MasterOBV'yi Seçmelisiniz?

  • Karar Güvencesi: Birden fazla faktörü entegre ederek giriş ve çıkış kararlarınızı güvenle almanızı sağlar.
  • 🌐 Kapsamlı Analiz: Sadece fiyatı değil, aynı zamanda hacmi, varlık korelasyonunu ve görsel kanalları da dikkate alarak piyasanın tam bir görünümünü sunar.
  • 🚀 Fiyat Kayma Potansiyeli: Aynı yönde hareket eden korele çiftleri kullanarak fiyat kayma fırsatlarını güçlendirir ve ticaret stratejilerinizin etkisini maksimize eder.

🔗 Sınırsız sürüme buradan erişin


Önerilen ürünler
The Rocket Trend indicator is trending. The indicator draws two-color points connected by lines along the chart. This is a trend indicator, it is an algorithmic indicator. It is easy to work and understand when a blue circle appears, you need to buy, when a red one appears, sell. The indicator is used for scalping and pipsing, and has proven itself well. Rocket Trend is available for analyzing the direction of the trend for a specific period of time. Ideal for novice traders learning the laws o
TrendDetect
Pavel Gotkevitch
The Trend Detect indicator combines the features of both trend indicators and oscillators. This indicator is a convenient tool for detecting short-term market cycles and identifying overbought and oversold levels. A long position can be opened when the indicator starts leaving the oversold area and breaks the zero level from below. A short position can be opened when the indicator starts leaving the overbought area and breaks the zero level from above. An opposite signal of the indicator can
KT Horizontal Lines MT5
KEENBASE SOFTWARE SOLUTIONS
In MetaTrader, plotting multiple   horizontal lines   and then tracking their respective price levels can be a hassle. This indicator automatically plots multiple horizontal lines at equal intervals for setting price alerts, plotting support and resistance levels, and other manual purposes. This indicator is suitable for Forex traders who are new and looking for chances to make quick profits from buying and selling. Horizontal lines can help traders find possible areas to start trading when the
To download MT4 version please click here . This is the exact conversion from TradingView: "WaveTrend [LazyBear]" By "zeusuk3". One of the coolest indicators out there to detect overbought and oversold zones. It can be used as a part of more complicated strategy and for confirming a potential trade setup. There are buffers to use in EAs also. The indicator is loaded light and non-repaint. - You can message in private chat for further changes you need. Thanks for downloading 
Ortalama geri dönüş ticareti için profesyonel ve nicel bir yaklaşım uygulayan benzersiz gösterge. Fiyatın tahmin edilebilir ve ölçülebilir bir şekilde ortalamaya döndüğü ve yön değiştirdiği gerçeğinden yararlanır, bu da nicel olmayan ticaret stratejilerinden büyük ölçüde daha iyi performans gösteren net giriş ve çıkış kurallarına izin verir. [ Installation Guide | Update Guide | Troubleshooting | FAQ | All Products ] Ticaret sinyallerini temizle Ticaret yapmak inanılmaz derecede kolay Özelleş
Simetrik üçgen, asimetrik üçgen veya dik açılı üçgen gibi Üçgen modeli için Model Gezgini, Yükselen kama veya Düşen kama gibi Kama modeli, Genişleme modeli ve Trend Kanalı Bu gösterge, mevcut kalıpların yanı sıra geçmiş kalıpları da araştırır, Trend çizgisini veya üçgeni manuel olarak çizerek zamandan tasarruf etmeye çalışanlar ve bunu grafikte en iyi kalıpları çizmenin otomatik analizi için kullanmak isteyenler için en iyi göstergedir. Özellikler : - En iyi deseni ayarlamak ve bulmak içi
Düz ve trend belirleme göstergesi. Fiyat, iki histogramdan ve iki çizgiden (kırmızı ve mavi) herhangi birinin altındaysa, bu bir satış bölgesidir. Göstergenin bu sürümünü satın alırken, bir gerçek ve bir demo hesabı için MT4 sürümü - hediye olarak (almak için bana özel mesaj yazın)! Fiyat, iki histogramdan ve iki çizgiden (kırmızı ve mavi) herhangi birinin üzerindeyse, bu bir satın alma bölgesidir. MT4 versiyonu: https://www.mql5.com/en/market/product/3793 Fiyat iki satır arasında veya
Was: $249  Now: $99   Market Profile defines a number of day types that can help the trader to determine market behaviour. A key feature is the Value Area, representing the range of price action where 70% of trading took place. Understanding the Value Area can give traders valuable insight into market direction and establish the higher odds trade. It is an excellent addition to any system you may be using. Inspired by Jim Dalton’s book “Mind Over Markets”, this indicator is designed to suit the
The Antique Trend Indicator is a revolutionary trend trading and filtering solution with all the important features of a trend tool built into one tool! The Antique Trend indicator is good for any trader, suitable for any trader both for Forex and binary options. There is no need to configure anything, everything has been perfected by time and experience, it works great during flats and trends. The Antique Trend indicator is a tool for technical analysis of financial markets, reflecting curre
Fibrillar
Vitalii Zakharuk
It is very easy to use the Fibrillar indicator, since the simplest is to look at the chart and act according to the indications of the colored arrows. The algorithm takes into account the measurement of prices, and this method also focuses on measuring each of the price drops (H / C, H / O, LC, LO) - which gives more detailed information, but also more averaged. When calculating this indicator, logarithmic gains are first calculated at the closing price, which allows you to filter out the tre
PULLBACK HUNTER What is every trader's cherished dream? To see without delay the places where the reversal will happen. This, of course, is from the category of magic, though... nothing is impossible. But for now I've prepared for you an indicator that marks in real time the end of corrections to the current movement or in short - catches pullbacks.What is the main point? Many people practice rebounds when the price moves in the direction of the open position. And they do them on the formation o
The Supernova Momentums indicator simplifies the visual perception of the price chart and reduces the time for analysis: if there is no signal, the deal is not opened, and if an opposite signal appears, it is recommended to close the current position. This arrow indicator is designed to determine the trend. Supernova Momentums implements a trend trading strategy, filters out market noise, and includes all the necessary features in one tool. Its work is based on automatically determining the c
A powerful oscillator that provide Buy and Sell signals by calculating the investor liquidity. The more liquidity the more buy possibilities. The less liquidity the more sell possibilities. Please download the demo and run a backtest! HOW IT WORKS: The oscillator will put buy and sell arrow on the chart in runtime only . Top value is 95 to 100 -> Investors are ready to buy and you should follow. Bottom value is 5 to 0 -> Investors are ready to sell and you should follow. Alert + sound will app
Your Trend Friend
Luigi Nunes Labigalini
5 (1)
The trend is your friend! Look at the color of the indicator and trade on that direction. It does not  repaint. After each candle is closed, that's the color of the trend. You can focus on shorter faster trends or major trends, just test what's most suitable for the symbol and timeframe you trade. Simply change the "Length" parameter and the indicator will automatically adapt. You can also change the color, thickness and style of the lines. Download and give it a try! There are big movements
Best SAR MT5
Ashkan Hazegh Nikrou
5 (1)
Acıklama:  Forex piyasasında (PSAR) Profesyonel ve populate göstergelerden Birine Dayanan Yeni ücretsiz göstergemizi tanıtmaktan mutluluk duyuyoruz (PSAR) drank gösterge orijinal Parabolik SAR göstergesinde Yeni bir değişikliktir pro SAR göstergesinde noktalar ve Fiyat tablosu arasındaki geçişi görebilirsiniz, drank crossover bir sinyal değil, hareketin sonu potansiyeli hakkında konuşun, yeni mavi nokta ile satın almaya başlayabilir ve ilk mavi noktadan bir atr önce stop loss koyabilirsiniz v
FREE
Upgraded - Stars added to indentify Areas you can scale in to compound on your entry  when buying or selling version 2.4 Upgraded Notifications and alerts added version 2.3 *The indicator is suitable for all pairs fromm  Deriv pairs (Vix,jump,boom & crash indices) , Currencies, cryptos , stocks(USA100, USA30 ), and metals like gold etc. How does it work? Increasing the period make it more stable hence will only focus on important entry points However  lowering the period will mean the indica
Bu indikatör, her sipariş için önceden belirlediğiniz TP ve SL Değerlerini (o para biriminde) grafiklerde (işlem/sipariş satırına kapalı) gösterecek ve her sipariş için kar ve zararınızı tahmin etmenize çok yardımcı olacaktır. Ayrıca size PIP değerlerini de gösterir. gösterilen format "Kâr veya Zararımızın Döviz Değerleri / PIP değerlerimiz" şeklindedir. TP Değeri Yeşil Renkte ve SL Değeri Kırmızı Renkte gösterilecektir. Herhangi bir sorunuz veya daha fazla bilgi için lütfen fxlife.asia@hotma
Provided Trend is a complex signal formation indicator. As a result of the work of internal algorithms, you can see only three types of signals on your chart. The first is a buy signal, the second is a sell signal, and the third is a market exit signal. Options: CalcFlatSlow - The first parameter that controls the main function of splitting the price chart into waves. CalcFlatFast - The second parameter that controls the main function of splitting the price chart into waves. CalcFlatAvg - Par
The indicator determines the state of the market: trend or flat. The state of the market is determined by taking into account volatility. The flat (trading corridor)is displayed in yellow. The green color shows the upward trend. The red color shows the downward trend. The height of the label corresponds to the volatility in the market. The indicator does not redraw . Settings History_Size   - the amount of history for calculation. Period_Candles  - the number of candles to calculate the
This indicator uses the metaquotes ZigZag indicator as base to plot fibonacci extension and fibonacci retracement based in the Elliot waves. A fibonacci retracement will be plotted on every wave draw by the ZigZag. A fibonacci extension will be plotted only after the 2nd wave. Both fibonacci will be updated over the same wave tendency. Supporting until 9 consecutive elliot waves. Parameters: Depth: How much the algorithm will iterate to find the lowest and highest candles Deviation: Amoun
True Day
Aurthur Musendame
5 (1)
True Days is a tool designed specifically for the trader who wants to catch intraday volatility in price charts.  True day makes it easier for the trader to avoid trading in the dead zone - a period in time where markets are considered dead or non volatile. The trader can concentrate on finding opportunities only during periods of profound market movements. By default the indicator gives you a true day starting at 02:00 to 19:00 hours GMT+2. You can adjust according to your Time Zone. By deafult
FREE
Premium seviye, %80'den fazla doğru tahmin doğruluğuna sahip benzersiz bir göstergedir! Bu gösterge en iyi Ticaret Uzmanları tarafından iki aydan uzun süredir test edilmiştir! Yazarın göstergesini başka hiçbir yerde bulamazsınız! Ekran görüntülerinden bu aracın doğruluğunu kendiniz görebilirsiniz! 1, sona erme süresi 1 mum olan ikili opsiyon ticareti için harikadır. 2 tüm döviz çiftleri, hisse senetleri, emtialar, kripto para birimleri üzerinde çalışır Talimatlar: Kırmızı ok görün
ACB Breakout Arrows MT5
KEENBASE SOFTWARE SOLUTIONS
5 (1)
The ACB Breakout Arrows indicator provides a crucial entry signal in the market by detecting a special breakout pattern. The indicator constantly scans the chart for a settling momentum in one direction and provide the accurate entry signal right before the major move. Get multi-symbol and multi-timeframe scanner from here - Scanner for ACB Breakout Arrows MT 5 Key features Stoploss   and Take Profit levels are provided by the indicator. Comes with a MTF Scanner dashboard which tracks the br
ATrend
Zaha Feiz
4.5 (2)
ATREND: Nasıl Çalışır ve Nasıl Kullanılır ### Nasıl Çalışır "**ATREND**" göstergesi, MT5 platformu için tasarlanmış olup, traderlara sağlam alım ve satım sinyalleri sağlamak amacıyla teknik analiz metodolojilerinin bir kombinasyonunu kullanır. Bu gösterge, öncelikle volatilite ölçümü için Ortalama Gerçek Aralık (ATR) kullanır ve potansiyel piyasa hareketlerini belirlemek için trend tespit algoritmalarıyla birleştirir. Satın aldıktan sonra bir mesaj bırakın ve özel bir bonus hediyesi kazanın. 39
PZ Trend Trading MT5
PZ TRADING SLU
3.67 (3)
Capture every opportunity: your go-to indicator for profitable trend trading Special Offer: Purchase now to receive free bonuses worth $159! (Read more for details) Trend Trading is an indicator designed to profit as much as possible from trends taking place in the market, by timing pullbacks and breakouts. It finds trading opportunities by analyzing what the price is doing during established trends. [ Installation Guide | Update Guide | Troubleshooting | FAQ | All Products ] Trade financial
Basic Support and Resistance   Göstergimiz, teknik analizinizi artırmak için ihtiyacınız olan çözümdür.Bu gösterge, destek ve direnç seviyelerini grafikte yansıtmanıza olanak tanır/ MT4 sürümü Özellikler Fibonacci seviyelerinin entegrasyonu: Fibonacci seviyelerini destek ve direnç seviyelerinin yanı sıra görüntüleme seçeneğiyle, göstergemiz size piyasa davranışı ve olası tersine dönme alanları hakkında daha derin bir fikir verir. Performans Optimizasyonu: Genişletilmiş satırları yalnızca he
The new update makes this indicator a complete tool for studying, analyzing and operating probabilistic patterns. It includes: On-chart Multi-asset percentage monitor. Configurable martingales. Twenty-one pre-configured patterns, including Mhi patterns and C3. An advanced pattern editor to store up to 5 custom patterns. Backtest mode to test results with loss reports. Trend filter. Hit operational filter. Martingale Cycles option. Various types of strategies and alerts. Confluence between patter
RevCan Trend Entry MT5
A K M Syedur Rahman
5 (1)
[75% OFF - SALE ENDS SOON] - RevCan Trend Entry Point   is a trend based trade alert indicator for serious traders. It does all the price and chart analysis all by itself, and whenever it finds any potential high quality trading opportunity(Buy or Sell) using its revolutionized price prediction algorithms, it sends instant trade alert directly on the chart, MT4 terminal and on the mobile device.  The trade signals will be visible on the chart as Up and Down arrows, while the instant audible ale
Medias colors
Sergio Domingues
O indicador media colors se baseia num canal que pode ser criado a partir de duas médias Media colors  é um indicador de tendência utilizado no trading para identificar a direção predominante do mercado. Pode ser baseado na Média Móvel Simples (SMA) e na  Média Móvel Exponencial  (EMA) que dá mais peso aos preços mais recentes, tornando-a mais sensível às mudanças de preço. Como Funciona: Cálculo:   A EMA é calculada aplicando um fator de suavização aos preços de fechamento de um ativo financeir
The Riko Trend indicator is a revolutionary trend trading and filtering solution with all the important features of a trend tool built into one tool! The Riko Trend indicator is good for any trader, suitable for any trader for both forex and binary options. You don’t need to configure anything, everything is perfected by time and experience, it works great during a flat and in a trend. The Riko Trend indicator is a technical analysis tool for financial markets that reflects the current price
Bu ürünün alıcıları ayrıca şunları da satın alıyor
Atomic Analyst MT5
Issam Kassas
4.6 (20)
Öncelikle belirtmek gerekir ki bu Ticaret Göstergesi Yeniden Çizim Yapmaz, Gecikmez ve Gecikme Göstermez, bu da hem manuel hem de robot ticareti için ideal hale getirir. Kullanıcı kılavuzu: ayarlar, girişler ve strateji. Atom Analisti, Piyasada Daha İyi Bir Avantaj Bulmak İçin Fiyatın Gücünü ve Momentumunu Kullanan PA Fiyat Hareketi Göstergesidir. Gürültüleri ve Yanlış Sinyalleri Kaldırmaya ve Ticaret Potansiyelini Artırmaya Yardımcı Olan Gelişmiş Filtrelerle Donatılmıştır. Birden fazla katmanl
Öncelikle, bu Ticaret Sistemi'nin Non-Repainting, Non-Redrawing ve Non-Lagging Göstergesi olduğunu vurgulamak önemlidir, bu da hem manuel hem de robot ticareti için ideal hale getirir. Online kurs, kılavuz ve ön ayarları indir. "Smart Trend Trading System MT5", yeni ve deneyimli tüccarlar için özelleştirilmiş kapsamlı bir ticaret çözümüdür. 10'dan fazla premium göstergeyi birleştiriyor ve 7'den fazla sağlam ticaret stratejisi sunuyor, bu da çeşitli piyasa koşulları için esnek bir seçim yapar. Tr
TPSpro RFI Levels MT5
Roman Podpora
4.67 (9)
Reversal First Impulse levels (RFI)      INSTRUCTIONS        RUS       -       ENG              R ecommended to use with an indicator   -   TPSpro  TREND PRO -  Version MT4                 A key element in trading is zones or levels from which decisions to buy or sell a trading instrument are made. Despite attempts by major players to conceal their presence in the market, they inevitably leave traces. Our task was to learn how to identify these traces and interpret them correctly. Main functi
TPSproTREND PrO MT5
Roman Podpora
4.89 (9)
TPSpro TREND PRO  - is a trend indicator that automatically analyzes the market and provides information about the trend and each of its changes, as well as giving signals for entering trades without redrawing! The indicator uses each candle, analyzing them separately. referring to different impulses - up or down impulse. Exact entry points into transactions for currencies, crypto, metals, stocks, indices!  Version MT4               DETAILED DESCRIPTION               R ecommended to use with an
Gold Stuff mt5
Vasiliy Strukov
4.9 (185)
Gold Stuff mt5, özellikle altın için tasarlanmış bir trend göstergesidir ve herhangi bir finansal enstrümanda da kullanılabilir. Gösterge yeniden çizilmez ve gecikmez. Önerilen zaman dilimi H1. Ayarları ve kişisel bir bonusu almak için satın alma işleminden hemen sonra benimle iletişime geçin!  Güçlü Destek ve Trend Tarayıcı göstergemizin ücretsiz bir kopyasını pm'den alabilirsiniz. Ben!   AYARLAR Ok Çiz - açık kapalı. grafik üzerinde oklar çizmek. Uyarılar - sesli uyarılar kapalı. E-post
Quantum Trend Sniper
Bogdan Ion Puscasu
4.92 (48)
Tanıtım       Kuantum Trend Keskin Nişancı Göstergesi   , trend tersine dönmeleri belirleme ve ticaret yapma şeklinizi değiştiren çığır açan MQL5 Göstergesi! 13 yılı aşkın ticaret tecrübesine sahip deneyimli tüccarlardan oluşan bir ekip tarafından geliştirilmiştir.       Kuantum Trend Keskin Nişancı Göstergesi       trend dönüşlerini son derece yüksek doğrulukla belirlemenin yenilikçi yolu ile ticaret yolculuğunuzu yeni zirvelere taşımak için tasarlanmıştır. ***Kuantum Trend Keskin Nişancı Gö
Top indicator for MT5   providing accurate signals to enter a trade without repainting! It can be applied to any financial assets:   forex, cryptocurrencies, metals, stocks, indices .  Watch  the video  (6:22) with an example of processing only one signal that paid off the indicator! MT4 version is here It will provide pretty accurate trading signals and tell you when it's best to open a trade and close it. Most traders improve their trading results during the first trading week with the help of
FX Volume MT5
Daniel Stein
4.94 (17)
Sabah Brifingimiz aracılığıyla ayrıntılar ve ekran görüntüleri ile günlük piyasa güncellemenizi alın burada mql5 ve on Telegram ! FX Volume, bir brokerin bakış açısından piyasa duyarlılığı hakkında GERÇEK bir fikir veren İLK ve TEK hacim göstergesidir. COT raporlarından çok daha hızlı bir şekilde, brokerlar gibi kurumsal piyasa katılımcılarının Forex piyasasında nasıl konumlandıklarına dair harika bilgiler sağlar. Bu bilgileri doğrudan grafiğinizde görmek, ticaretiniz için gerçek oyun değiştir
TrendMaestro5
Stefano Frisetti
note: this indicator is for METATRADER4, if you want the version for METATRADER5 this is the link:  https://www.mql5.com/it/market/product/108106 TRENDMAESTRO ver 2.4 TRENDMAESTRO recognizes a new TREND in the bud, he never makes mistakes. The certainty of identifying a new TREND is priceless. DESCRIPTION TRENDMAESTRO identifies a new TREND in the bud, this indicator examines the volatility, volumes and momentum to identify the moment in which there is an explosion of one or more of these data a
Şimdi 147 $ (birkaç güncellemeden sonra 499 $ 'a yükseliyor) - Sınırsız Hesaplar (PC'ler veya Mac'ler) RelicusRoad Kullanım Kılavuzu + Eğitim Videoları + Özel Discord Grubuna Erişim + VIP Durumu PİYASAYA BAKMAK İÇİN YENİ BİR YOL RelicusRoad, forex, vadeli işlemler, kripto para birimleri, hisse senetleri ve endeksler için dünyanın en güçlü ticaret göstergesidir ve yatırımcılara kârlı kalmaları için ihtiyaç duydukları tüm bilgileri ve araçları sağlar. Başlangıç ​​seviyesinden ileri seviyey
XQ Indicator MetaTrader 5
Marzena Maria Szmit
3.5 (2)
Step into the realm of Forex trading with confidence and precision using XQ, a cutting-edge Forex indicator designed to elevate your trading game to unprecedented heights. Whether you're a seasoned trader or just stepping into the world of currency exchange, XQ Forex Indicator empowers you with the insights and signals needed to make informed trading decisions. The signal conditions are a combination of three indicators, and XQ Forex Indicator only display  medium and long-term trends . The ind
Gartley Hunter Multi
Siarhei Vashchylka
5 (8)
Gartley Hunter Multi - An indicator for searching for harmonic patterns simultaneously on dozens of trading instruments and on all possible timeframes. Manual (Be sure to read before purchasing) | Version for MT4 Advantages 1. Patterns: Gartley, Butterfly, Shark, Crab. Bat, Alternate Bat, Deep Crab, Cypher 2. Simultaneous search for patterns on dozens of trading instruments and on all possible timeframes 3. Search for patterns of all possible sizes. From the smallest to the largest 4. A
Unlock key market insights with automated support and resistance lines Special Offer: Purchase now to receive free bonuses worth $89! (Read more for details) Tired of plotting support and resistance lines? This is a multi-timeframe indicator that detects and plots supports and resistance lines in the chart with the same precision as a human eye would. As price levels are tested over time and its importance increases, the lines become thicker and darker, making price leves easy to glance and ev
Volume by Price MT5
Brian Collard
3.6 (5)
The Volumebyprice.com Indicator for MetaTrader 5 features Volume Profile and Market Profile TPO (Time Price Opportunity). Volume and TPO histogram bar and line charts. Volume Footprint charts. TPO letter and block marker collapsed and split structure charts. Static, dynamic and flexible range segmentation and compositing methods with relative and absolute visualizations. Session hours filtering and segment concatenation with Market Watch and custom user specifications. Graphical layering, posit
Volatility Trend System , girişler için sinyaller sağlayan bir ticaret sistemidir. Volatilite sistemi, trend yönünde doğrusal ve nokta sinyallerinin yanı sıra, yeniden çizme veya gecikme olmadan trendden çıkış sinyallerini de verir. Trend göstergesi orta vadeli trendin yönünü izler, yönünü ve değişimini gösterir. Sinyal göstergesi oynaklıktaki değişikliklere dayanır ve piyasaya girişleri gösterir. Gösterge çeşitli uyarı türleri ile donatılmıştır. Çeşitli ticaret araçlarına ve zaman diliml
TPA True Price Action indicator reveals the true price action of the market makers through 100% non-repainting signals strictly at the close of a candle! TPA shows entries and re-entries, every time the bulls are definitely stronger than the bears and vice versa. Not to confuse with red/green candles. The shift of power gets confirmed at the earliest stage and is ONE exit strategy of several. There are available now two free parts of the TPA User Guide for our customers. The first "The Basics"
Order Block Hunter MT5
Noha Mohamed Fathy Younes Badr
5 (1)
Order block hunter indicator is the best indicator for  hunt the order blocks that area where there has been a large concentration of limit orders waiting to be executed Order blocks are identified on a chart by observing previous price action and looking for areas where the price experienced significant movement or sudden changes in direction .This indicator does that for you by using very complicated codes and helps you to take the best areas To buy and sell because it make marks at the best a
Elliot Waves Analyzer Pro
Viktor Weidenthal
3.25 (4)
Elliot Waves Analyzer Pro calculates Elliot Waves to Help Identify Trend direction and Entry Levels. Mainly for Swing Trading Strategies. Usually one would open a Position in trend direction for Wave 3 or a Correction for Wave C . This Indicator draws Target Levels for the current and next wave. Most important Rules for Elliot Wave Analysis are verified by the Indicator.  The Pro version analyzes Multiple Timeframes and shows the Subwaves and Target-Levels.   For an Overview  " Elliot Waves Anal
Tanıtım       Quantum Breakout PRO   , Breakout Bölgeleri ile ticaret yapma şeklinizi değiştiren çığır açan MQL5 Göstergesi! 13 yılı aşkın ticaret tecrübesine sahip deneyimli tüccarlardan oluşan bir ekip tarafından geliştirilmiştir.       Kuantum Breakout PRO       yenilikçi ve dinamik koparma bölgesi stratejisiyle ticaret yolculuğunuzu yeni zirvelere taşımak için tasarlanmıştır. Kuantum Breakout Göstergesi, size 5 kar hedefi bölgesi ile kırılma bölgelerinde sinyal okları ve kırılma kutusuna
Bill Williams Advanced
Siarhei Vashchylka
5 (8)
Bill Williams Advanced is designed for automatic chart analysis using Bill Williams' "Profitunity" system. The indicator analyzes four timeframes at once. Manual (Be sure to read before purchasing) Advantages 1. Automatically analyzes the chart using the "Profitunity" system of Bill Williams. The found signals are placed in a table in the corner of the screen. 2. Equipped with a trend filter based on the Alligator indicator. Most of the system signals are recommended to be used only accordi
Trend Master Pro MT5
Tatiana Zyrianova
4.67 (3)
MT5 trend indicator with a probability of reaching a profit of 70-90%! Works without redrawing and delays. Trend Master PRO shows good results on all trading instruments: currencies, metals, indices, stocks, cryptocurrencies. Recommended timeframe: H1-H4. More information about the indicator is here :  https://www.mql5.com/en/blogs/post/744748 Recommendations for use Use automatic period detection           The main feature of the indicator is the self-optimization function.             Th
Trade smarter, not harder: Empower your trading with Harmonacci Patterns Special Offer: Purchase now to receive free bonuses worth $165! (Read more for details) This is arguably the most complete harmonic price formation auto-recognition indicator you can find for the MetaTrader Platform. It detects 19 different patterns, takes fibonacci projections as seriously as you do, displays the Potential Reversal Zone (PRZ) and finds suitable stop-loss and take-profit levels. [ Installation Guide | Up
Trend Forecaster
Alexey Minkov
5 (6)
The Trend Forecaster indicator utilizes a unique proprietary algorithm to determine entry points for a breakout trading strategy. The indicator identifies price clusters, analyzes price movement near levels, and provides a signal when the price breaks through a level. The Trend Forecaster indicator is suitable for all financial assets, including currencies (Forex), metals, stocks, indices, and cryptocurrencies. You can also adjust the indicator to work on any time frames, although it is recommen
Advanced Supply Demand MT5
Bernhard Schweigert
4.53 (15)
Herhangi bir Acemi veya Uzman Tüccar için En İyi Çözüm! Bu gösterge benzersiz, yüksek kaliteli ve uygun fiyatlı bir ticaret aracıdır çünkü bir dizi tescilli özelliği ve yeni bir formülü bir araya getirdik. Bu güncelleme ile çift zaman dilimi dilimlerini gösterebileceksiniz. Yalnızca daha yüksek bir TF gösteremeyeceksiniz, aynı zamanda TF grafiğini ve ARTIK daha yüksek TF'yi de gösterebileceksiniz: YUVARLAK BÖLGELERİ GÖSTERMEK. Tüm Arz Talebi tüccarları buna bayılacak. :) Önemli Bilgiler Açıkland
AT Forex Indicator MT5
Marzena Maria Szmit
5 (4)
The AT Forex Indicator MT5 is a sophisticated trading tool designed to provide traders with a comprehensive analysis of multiple currency pairs. This powerful indicator simplifies the complex nature of the forex market, making it accessible for both novice and experienced traders. AT Forex Indicator uses advanced algorithms to detect trends, patterns and is an essential tool for traders aiming to enhance their forex trading performance. With its robust features, ease of use, and reliable signal
MTF Supply Demand Zones MT5
Georgios Kalomoiropoulos
5 (1)
Yeni Nesil Otomatik Arz ve Talep Bölgeleri. Her Grafikte Çalışan Yeni ve Yenilikçi Algoritma. Tüm Bölgeler Piyasanın Fiyat Hareketine Göre Dinamik Olarak Oluşturulmaktadır. İKİ TÜR UYARI --> 1) FİYAT BİR BÖLGEYE ÇIKTIĞINDA 2) YENİ BİR BÖLGE OLUŞTURDUĞUNDA Bir tane daha işe yaramaz gösterge almazsın. Kanıtlanmış Sonuçlarla eksiksiz bir Ticaret Stratejisi elde edersiniz.     Yeni özellikler:     Fiyat Arz/Talep Bölgesine ulaştığında uyarılar     Yeni bir Arz/Talep Bölgesi olu
Introduction to Fractal Pattern Scanner Fractal Indicator refers to the technical indicator that makes use of the fractal geometry found in the financial market. Fractal Pattern Scanner is the advanced Fractal Indicator that brings the latest trading technology after the extensive research and development work in the fractal geometry in the financial market. The most important feature in Fractal Pattern Scanner is the ability to measure the turning point probability as well as the trend probabil
Introduction to X3 Chart Pattern Scanner X3 Cherart Pattern Scanner is the non-repainting and non-lagging indicator detecting X3 chart patterns including Harmonic pattern, Elliott Wave pattern, X3 patterns, and Japanese Candlestick patterns. Historical patterns match with signal patterns. Hence, you can readily develop the solid trading strategy in your chart. More importantly, this superb pattern scanner can detect the optimal pattern of its kind. In addition, you can switch on and off individu
Gösterge en uygun giriş ve çıkış noktalarını gösterir. Ayrıca, ticaretin daha iyi analiz edilmesi için tüm sinyaller hakkında istatistiksel veriler görüntüler. Bu göstergenin yardımıyla piyasayı daha iyi anlayabileceksiniz. Trendin gücü zayıflamaya başlar başlamaz (bu panelde gösterilecektir), trend çizgisi yatay konuma gelecektir - bu ticaretten çıkma sinyalidir. Ya da ortalama/medyan kâr seviyesine ulaşıldığında çıkabilirsiniz. Gösterge, 2010'dan beri edindiğim ticaret deneyimimin sonuc
FxaccurateLS
Shiv Raj Kumawat
WHY IS OUR FXACCCURATE LS MT5 THE PROFITABLE ? PROTECT YOUR CAPITAL WITH RISK MANAGEMENT Gives entry, stop and target levels from time to time. It finds Trading opportunities by analyzing what the price is doing during established trends. POWERFUL INDICATOR FOR A RELIABLE STRATEGIES We have made these indicators with a lot of years of hard work. It is made at a very advanced level. Established trends provide dozens of trading opportunities, but most trend indicators completely ignore them!
Yazarın diğer ürünleri
AI Channel
Thalles Nascimento De Carvalho
4 (4)
Welcome to the presentation of the AI Channel indicator, a powerful tool that uses artificial intelligence for price channel analysis in the financial market. In this session, we will explore how this revolutionary indicator can assist investors and traders in making more informed and strategic decisions. Let's get started! I. What is the AI Channel indicator? AI Channel is an indicator developed based on advanced artificial intelligence algorithms. It utilizes historical price data of financial
FREE
Master OBV FX
Thalles Nascimento De Carvalho
5 (1)
MasterOBV: Pazar Trendlerini Hassasiyetle Yönetin! MasterOBV , hacim , pozitif korelasyon ve Hareketli Ortalama (MA) kombinasyonunu kullanarak finansal piyasalarda trendleri tanımlama yeteneğini artıran bir teknik analiz göstergesi dir. Ana Özellikler: Akıllı Hacim: Ticaret hacmini analiz ederek trend gücündeki önemli değişimleri belirler. Pozitif Korelasyon: Korele olmuş varlıkları dahil ederek daha geniş ve doğru bir bakış açısı sağlar, çiftlerin hacmine dayalı olarak fiyat kayması
FREE
CVD SmoothFlow
Thalles Nascimento De Carvalho
CVD SmoothFlow - BTCUSD İçin Hacim Analizini Hassasiyetle Basitleştirin! CVD SmoothFlow , BTCUSD paritesiyle işlem yapan traderlar için özel olarak geliştirilmiş bir teknik göstergedir. Cumulative Volume Delta (CVD) hesaplamasını kullanarak, gürültü filtrelemesi uygular ve piyasayı net ve doğru bir şekilde okumanızı sağlar. CVD SmoothFlow Ne Sunar? Net Analiz: Pazar gürültüsünü filtreler, böylece en önemli ve anlamlı hacim hareketlerine odaklanabilirsiniz. ️ Hassas Hesaplama: Alım ve satı
FREE
Long Short
Thalles Nascimento De Carvalho
4.67 (3)
Long & Short Göstergesi: Pazar Hareket Analizi için Nihai Araç Gerçek Zamanlı Bilgilerle Yüksek Başarı Oranı Varlık hareketlerini yüksek doğrulukla takip edin ve kararlarınızı anlık güncellenmiş verilere dayanarak verin. ️ Daha Güvenli İşlem Girişleri Pozitif ve negatif korelasyonların gücünü kullanarak daha güvenli ve bilgilendirilmiş işlem girişleri yapın. Kısa ve Uzun Vadeli Analizi Kolaylaştırır Kısa ve uzun vadeli stratejiler için ideal, ticaret ihtiyaçlarınıza uyum sağla
FREE
Swing Point Volume
Thalles Nascimento De Carvalho
Swing Point Volume, the indicator that signals weakness and strength at the tops and bottoms. This indicador can be for used the Wyckoff Method. Information provided; - Swing on customized ticks. - Volume and points in each balance sheet. - Percentage of Displacement. - Sound alert option on top and bottom breaks. - Volume in ticks and Real Volume. - Volume HL (extreme) or (opening and closing) - Customized volume shapes.
Atr Projection
Thalles Nascimento De Carvalho
ATR Projeksiyon Göstergesi, finansal piyasalardaki fiyat hareketlerinin potansiyel sınırları konusunda keskin görüşler sunmak amacıyla tasarlanmış teknik analizde güçlü bir araç olarak öne çıkıyor. Esnek yaklaşımı, kullanıcıların analiz ölçümlerini sezgisel bir şekilde özelleştirmelerine, her işlem yapılan varlığın özel ihtiyaçlarına uyarlamalarına izin verir. Özelleştirilebilir İşleyiş: Varsayılan olarak, ATR Projeke 100 mumun ortalamasının %30'unu göz önünde bulundurarak çalışır. Bu esne
Box Weis Wave
Thalles Nascimento De Carvalho
5 (1)
Weis Wave Box ile analizlerinizi bir üst seviyeye taşıyın! Eğer ticaretinizde hassasiyet ve netlik arıyorsanız, Weis Wave Box ihtiyaç duyduğunuz araçtır. Bu ileri düzey gösterge, hacim dalgaları ve swing noktalarının ayrıntılı görsel analizini sunarak, piyasalarda çaba ve sonuç arasındaki ilişkiyi daha iyi anlamanıza yardımcı olur. Weis Wave Box’ın Başlıca Özellikleri: Kişiselleştirilebilir Hacim Dalgaları: Ticaret stratejilerinize uygun olarak hacim dalgalarını tik bazında ayarlayın.
Long Short Pro
Thalles Nascimento De Carvalho
Long & Short Göstergesi - Pro Versiyon: Pazar Analizinizi Sınırsız Olanaklarla Güçlendirin! Tüm Varlıklar İçin Sınırsız Kullanım Long & Short göstergesinin Pro versiyonu, herhangi bir finansal varlık üzerinde tam özgürlük sunar. Artık sınırlama olmadan aynı göstergiyi tüm tercih ettiğiniz varlıklara uygulayabilirsiniz! Sınırsız Erişim Göstergeyi hiçbir kısıtlama olmadan kullanmanın tadını çıkarın. Pro versiyonu, size tam ve sınırsız bir deneyim sunarak her piyasa fırsatını en üst
Reversal Vol Propagation
Thalles Nascimento De Carvalho
Are you tired of missing out on trading opportunities by not being able to identify price reversals in time? Do you want to maximize your profits and make informed trading decisions? Introducing the Reversal Vol Propagation Indicator, the revolutionary tool that uses neural networks and volume data to predict potential price reversals. Based on a powerful combination of advanced algorithms and cutting-edge technology, the Reversal Vol Propagation meticulously analyzes volume patterns and past pr
Didi Index Volume
Thalles Nascimento De Carvalho
Sunuyoruz, Didi Index Volume adlı bir teknik analiz göstergesi. Bu gösterge, Brezilyalı trader Odir Aguiar tarafından geliştirilmiştir ve finansal piyasalardaki fırsatları tespit etmede ileri ve güçlü bir yaklaşımıyla öne çıkmaktadır. Çeşitli platformlarda mevcut olan Didi Index Volume, kesin bilgilere ve değerli bilgilere ihtiyaç duyan işlemciler için vazgeçilmez bir araç haline gelmiştir. Gösterge, Odir Aguiar tarafından oluşturulan saygın Didi Index ile işlem hacminin akıllı bir şekilde ku
Smart Binary Volume
Thalles Nascimento De Carvalho
Smart Binary Volume göstergesi, ticaret hacmi analizini makine öğrenimi ile birleştiren çok yönlü bir araçtır. Scalping ve diğer kısa vadeli ticaret stratejileri de dahil olmak üzere çeşitli piyasalarda ve stratejilerde kullanılabilir. Gelişmiş makine öğrenimi algoritmalarını kullanarak, gösterge karmaşık desenleri tanımlar ve daha hassas alım satım sinyalleri üretir. Buffer to Create EA. Buffer Line Gold = 0. Buffer Line Red = 2 Buffer   AI  =  3 AI Buffer  >=  0  ("SIGNAL BUY") AI Buffer 
TimeChannel
Thalles Nascimento De Carvalho
The "Timechannel" is a powerful technical analysis tool designed specifically for traders who want to gain deeper and more accurate insights into price movements across multiple timeframes (multi-timeframe). This indicator is an essential addition to the toolbox of any serious trader seeking to make informed and data-driven trading decisions. Key Features: Advanced Multi-Timeframe Analysis : Timechannel allows traders to analyze price movements on different timeframes simultaneously. This is cr
DeltaBook
Thalles Nascimento De Carvalho
Delta Book göstergesi, finansal piyasalarda hisse senetleri, vadeli işlemler ve kripto paralar gibi varlık fiyat hareketlerini tespit etmek için hacim delta kullanımını ve emir defteri bilgilerini birleştiren güçlü bir piyasa analizi aracıdır. Delta Book'un tam potansiyelini anlamak için canlı veri ve emir defteri bilgilerine erişim gerektiğini unutmamak önemlidir. Delta Book'un temel özelliği, yatırımcıların ve tüccarların piyasa katılımcılarının davranışlarına yönelik detaylı bilgilere dayalı
Big Player Range
Thalles Nascimento De Carvalho
5 (2)
"BigPlayerRange"ın Gücünü Keşfedin: Pazar Teknik Analizinde Sizin Müttefikiniz BigPlayerRange 'ı tanıtıyoruz, piyasalarda kurumsal yatırımcıların ilgi alanlarını ortaya çıkaran gelişmiş bir teknik analiz aracıdır. Bu araç sayesinde, büyük oyuncuların aktif olduğu alanları hassas bir şekilde belirleyebilir ve bunun ticaret stratejilerinizi nasıl etkileyebileceğini anlayabilirsiniz. Ana Özellikler: Kurumsal İlgi Alanlarının Haritalanması : BigPlayerRange , kurumsal yatırımcıların yüksek etk
Smart Delta Volume
Thalles Nascimento De Carvalho
Smart Delta Volume: Dinamik Pazar Koşullarına Uyarlanabilir ve Hassas Araç Smart Delta Volume , sürekli değişen bir piyasa ortamında hassas ve uyarlanabilir analizler sunmak için tasarlanmış gelişmiş bir teknik göstergedir. Bu gösterge, volatiliteye göre otomatik olarak ayarlanan dinamik seviyeleri kullanarak, hacim akışı ile fiyat hareketleri arasındaki etkileşim hakkında daha kapsamlı ve güvenilir bir görüş sağlar. Bu uyarlanabilirlik, özellikle değişken piyasalarda hızlı ve doğru bilgiler
VolaMetrics VSA
Thalles Nascimento De Carvalho
VolaMetrics VSA | Teknik Analizde Güçlü Bir Yardımcı VolaMetrics VSA , Volume Spread Analysis (VSA) metodolojisini ayrıntılı işlem hacmi analizi ile birleştiren bir teknik analiz göstergesidir. Önemli fiyat hareketlerini belirlemek ve izlemek için tasarlanan bu araç, hacim ve fiyat yayılması arasındaki etkileşimi kullanarak, ticaret kararlarına yardımcı olabilecek değerli içgörüler sağlar. Volume Spread Analysis (VSA) Temelleri Volume Spread Analysis (VSA) , teknik analizde saygı gören bir
SwingVolumePro
Thalles Nascimento De Carvalho
Genel Bakış SwingVolumePro , geniş bir finansal varlık yelpazesi üzerinde kullanılmak üzere tasarlanmış gelişmiş ve çok yönlü bir göstergedir. Hacim ve fiyat analizi üzerine kurulmuş olan bu gösterge, tüm seviyelerdeki trader'ların yüksek kaliteli verilere dayanarak bilinçli kararlar almasını sağlayacak şekilde net ve hassas sinyaller sunar. Ana Özellikler Çok Yönlülük: SwingVolumePro, hisse senetleri, forex, kripto paralar ve daha fazlası dahil olmak üzere çeşitli varlıklar üzerinde uy
CVD SmoothFlow Pro
Thalles Nascimento De Carvalho
CVD SmoothFlow Pro - Her Varlık İçin Sınırsız Hacim Analizi! CVD SmoothFlow Pro , hassas ve sınırsız bir hacim analizi arayan trader'lar için nihai çözümüdür. Cumulative Volume Delta (CVD) hesaplamasını ve gelişmiş gürültü filtrelemesini kullanarak, Pro sürümü herhangi bir finansal varlık için gereken esneklik ve doğruluğu sağlar. CVD SmoothFlow Pro Neler Sunar? Açık Analiz : Pazar gürültüsünü filtreler ve her finansal varlıkta önemli hacim hareketlerini vurgular. ️ Kesin Hesaplama : Alım
Filtrele:
İnceleme yok
İncelemeye yanıt
Sürüm 1.4 2024.08.20
melhorias no calculo do volume e canais para rastrear tendências
Sürüm 1.2 2024.01.11
Correção nas notificações e ajuste de volume