Multi Asset Multi Timeframe Overlay Chart
- Göstergeler
- Alessandro Bertoli
- Sürüm: 1.0
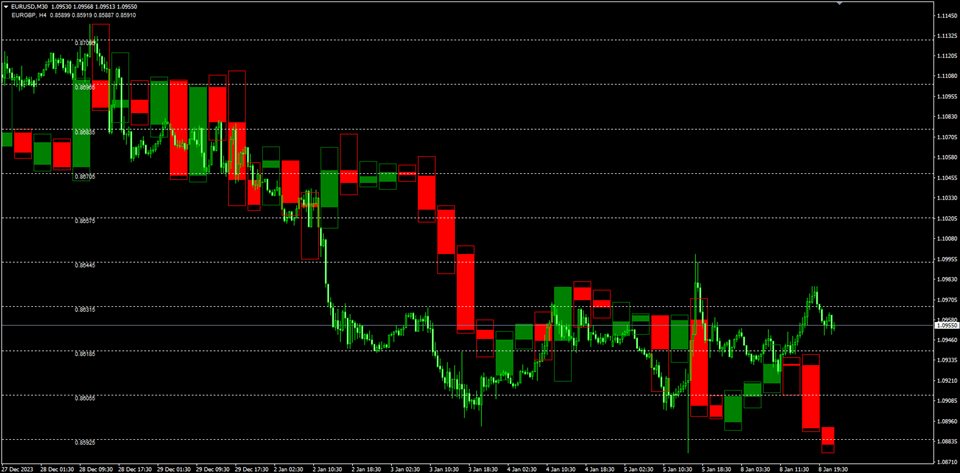
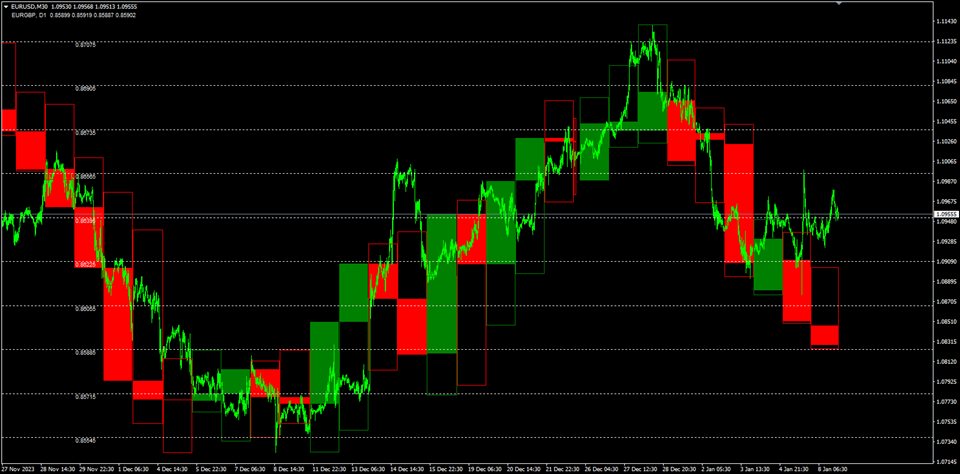
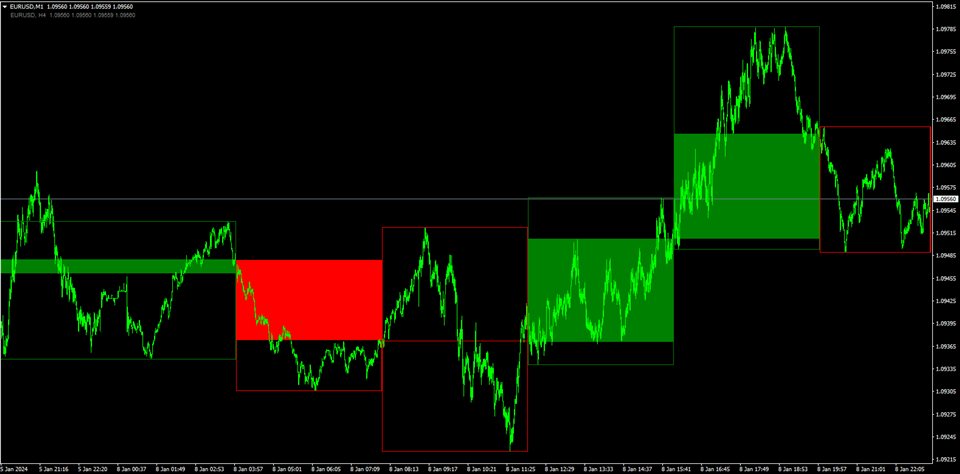
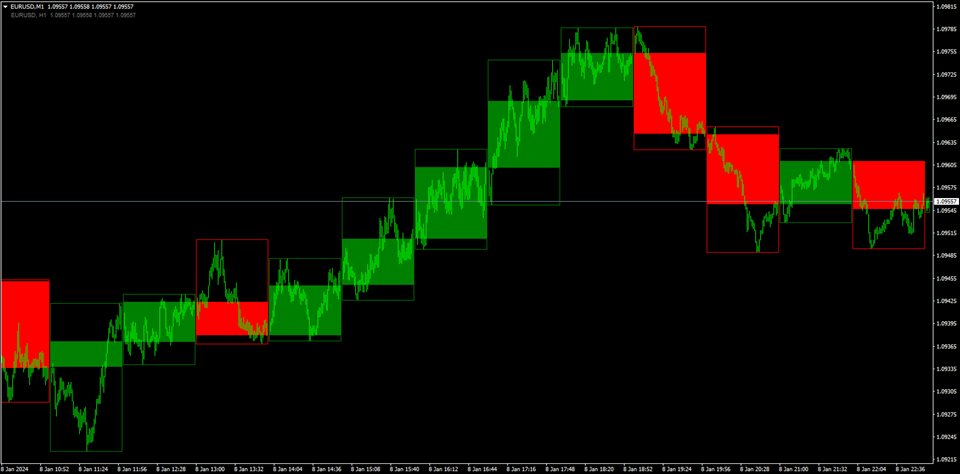
MA MTF Overlay Chart is software that allows you to overlay the candlestick chart of a financial instrument with a second candlestick chart of the same one, or of another, financial instrument, by setting a different timeframe from that of the basic chart.
The software is very simple to use and the input parameters are listed below.
Input parameters:
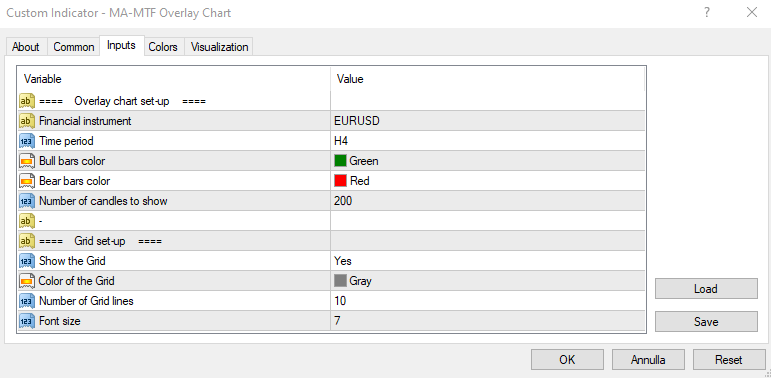
Overlay chart set-up
- Financial instrument: financial instrument that you want to overlay on the base chart
- Time period: secondary instrument timeframe
- Bull bars color: color of the ascending bars
- Bear bars color: color of the descending bars
- Number of candles to show: number of candles of the secondary instrument you want to display
- Show the Grid: select Yes to display the price grid on the chart, No to hide it
- Color of the Grid: grid color
- Number of Grid lines: number of horizontal lines of the price grid
Notes for correct use:
- The timeframe of the secondary instrument must be higher than that of the base chart.
- It is advisable to update the historical data of both financial instruments to avoid candle display errors.
- Any missing historical data or misalignments between the two financial instruments can create candle display errors.






Usability is vary good. I wonder if you have one for MT5. Thank you for sharing.