SL InfoPanel
- Yardımcı programlar
- Sergei Lopukhov
- Sürüm: 1.10
- Güncellendi: 8 Ocak 2024
- Etkinleştirmeler: 5
SL InfoPanel is an information panel that displays operational trading information on the current instrument.
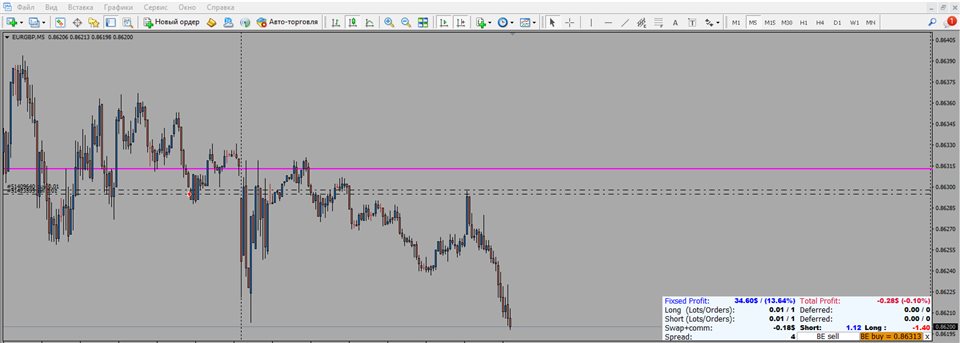
The panel contains the following information:
The first column:
- The fixed profit for the specified period of time and the percentage of this profit to the current deposit (the time period is configured in the "Account History"). The value is colored blue if there is a profit and red if there is a loss.
- Open Long orders (number of lots/number of orders).
- Open Short orders (number of lots/number of orders).
- Total Swap and commission of open orders.
- The current Spread(changes color with additional settings. Description in the input parameters).
The second column:
- Current profit (percentage of the current deposit). The value is colored blue if there is a profit and red if there is a loss.
- Pending Long orders ( number of lots/number of orders ).
- Pending Short orders ( number of lots/number of orders ).
- Current profit on Short orders / Current profit on Long orders (values change color depending on profit or loss).
- The button for plotting the breakeven line for open Short positions on the chart (when the button is pressed, the value of the breakeven line for these positions is displayed, taking into account swaps, commissions and the current spread).
- The button for plotting the breakeven line for open Long positions on the chart (when the button is pressed, the value of the breakeven line for these positions is displayed, taking into account swaps, commissions and the current spread).
- The "X" button is used to collapse the panel.
The panel is linked to the lower right corner of the graph. The position can be set in the input parameters.
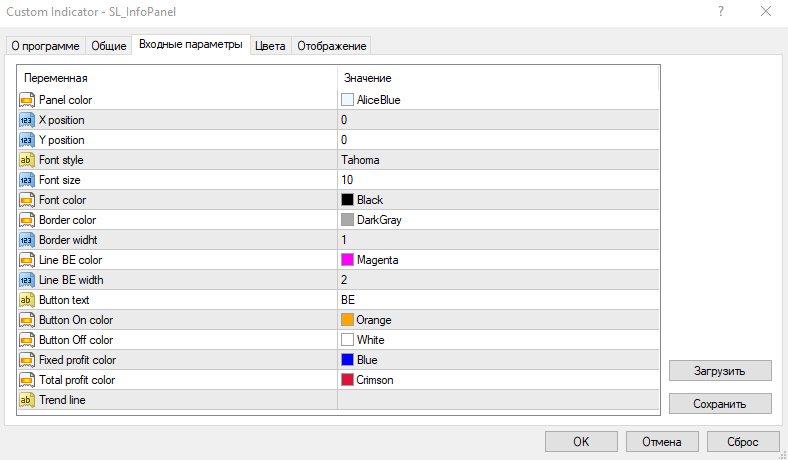
Input parameters (see the screenshot):
- Panel color - the background color of the panel
- X position - position on the "X" axis (relative to the lower right corner of the graph)
- Y position - position on the "Y" axis (relative to the lower right corner of the graph)
- Font style - font
- Font size - font size
- Font color - font color
- Border color - border color
- Border width - the thickness of the border
- Line BE color - the color of the breakeven line
- Line BE width - the thickness of the breakeven line
- Button text - the text of the breakeven line button
- Button On color - the color of the pressed breakeven line button
- Button Off color - the color of the pressed button of the breakeven line
- Fixed profit color - the color of the "Fixed profit color" line
- Total profit color - the color of the line "Total profit color"
- Trend line - the name of the line (if necessary) to determine the trend.
If desired, you can see the trend direction by the color of the current Spread value:
- Plot a horizontal line on the chart, which (in your opinion is the support level or the resistance level)
- Copy the name of the line
- Insert the name of the line into the input parameters of the panel (variable "Trend line")
If the current price is above this line, the color of the value of the current Spread will be colored blue.
If the current price is below this line, the color of the value of the current Spread will be colored red.


