• Genel bakış
  • İncelemeler
  • Yorumlar

Force Directional

Yön Kuvveti Göstergesi

Yön Kuvveti teknik göstergesi, fiyat hareketinin göreceli gücünü ölçmeye ve aynı zamanda trendin yönünü belirlemeye ve takip etmeye yardımcı olmak için kullanılabilecek bir dizi unsuru bir araya getirme fikrine dayanmaktadır.

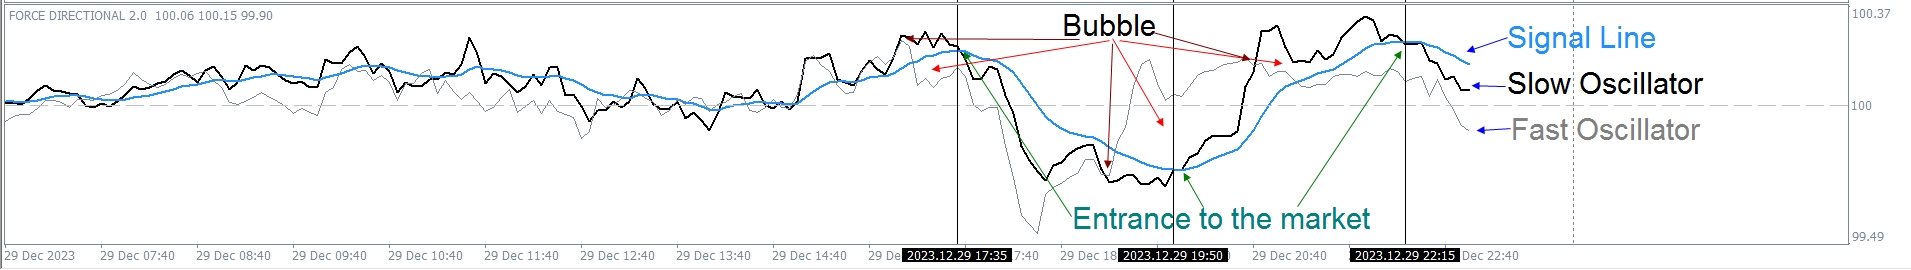
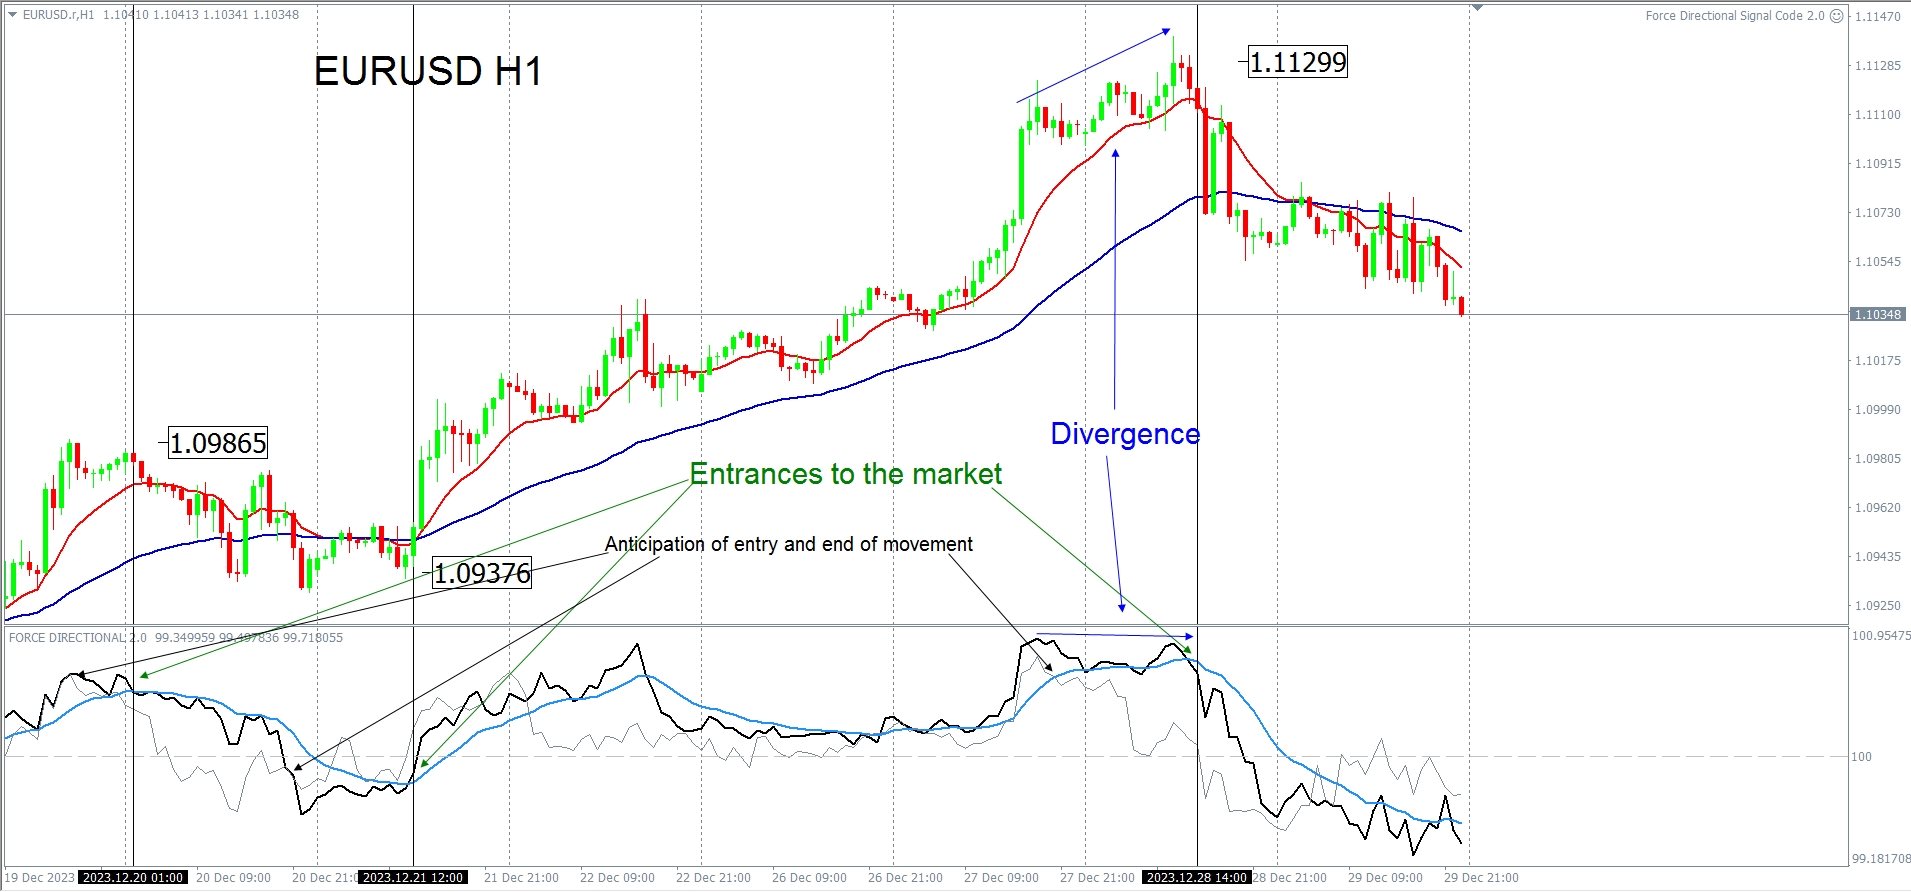
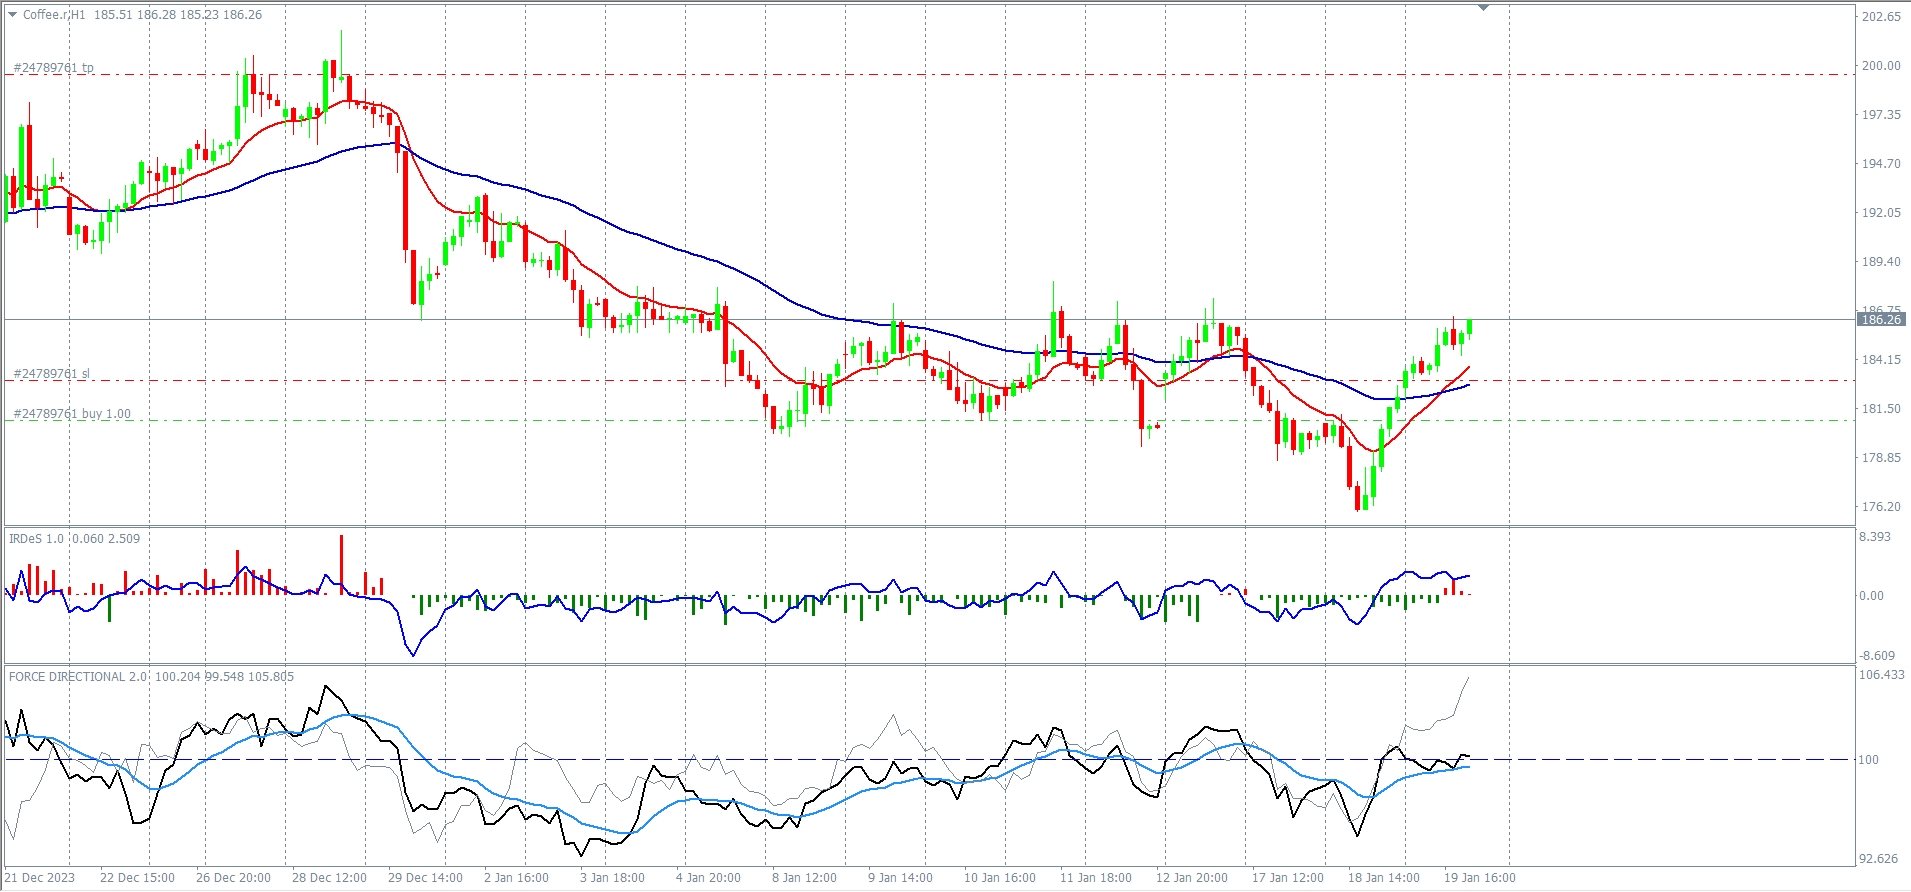
Göstergede yavaş osilatör (siyah çizgi), hızlı osilatör (gri çizgi) ve sinyal çizgisi olarak işlev gören düşük değerli üssel bir orta çizgi (mavi çizgi) bulunmaktadır. Bu, hareketin tersine dönüşleri belirleyerek aynı zamanda bir yönlendirici olarak görev yapmaktadır. Göstergenin osilatörleri 100 değerinin üzerinde veya altında hareket eder ve farklı terimlerde ve zaman dilimlerinde, son fiyatın kapanışını önceki bir kapanışla karşılaştırır.

Bu gösterge özellikle trendin tersine dönüşlerini belirlemede etkilidir ve herhangi bir zaman diliminde başarıyla kullanılabilir. Ancak, bir hareketin veya trendin gücünü daha doğru değerlendirmek ve bilinçli kararlar almak için daha uzun zaman dilimlerinde kullanılması önerilir.

Nasıl Kullanılır:
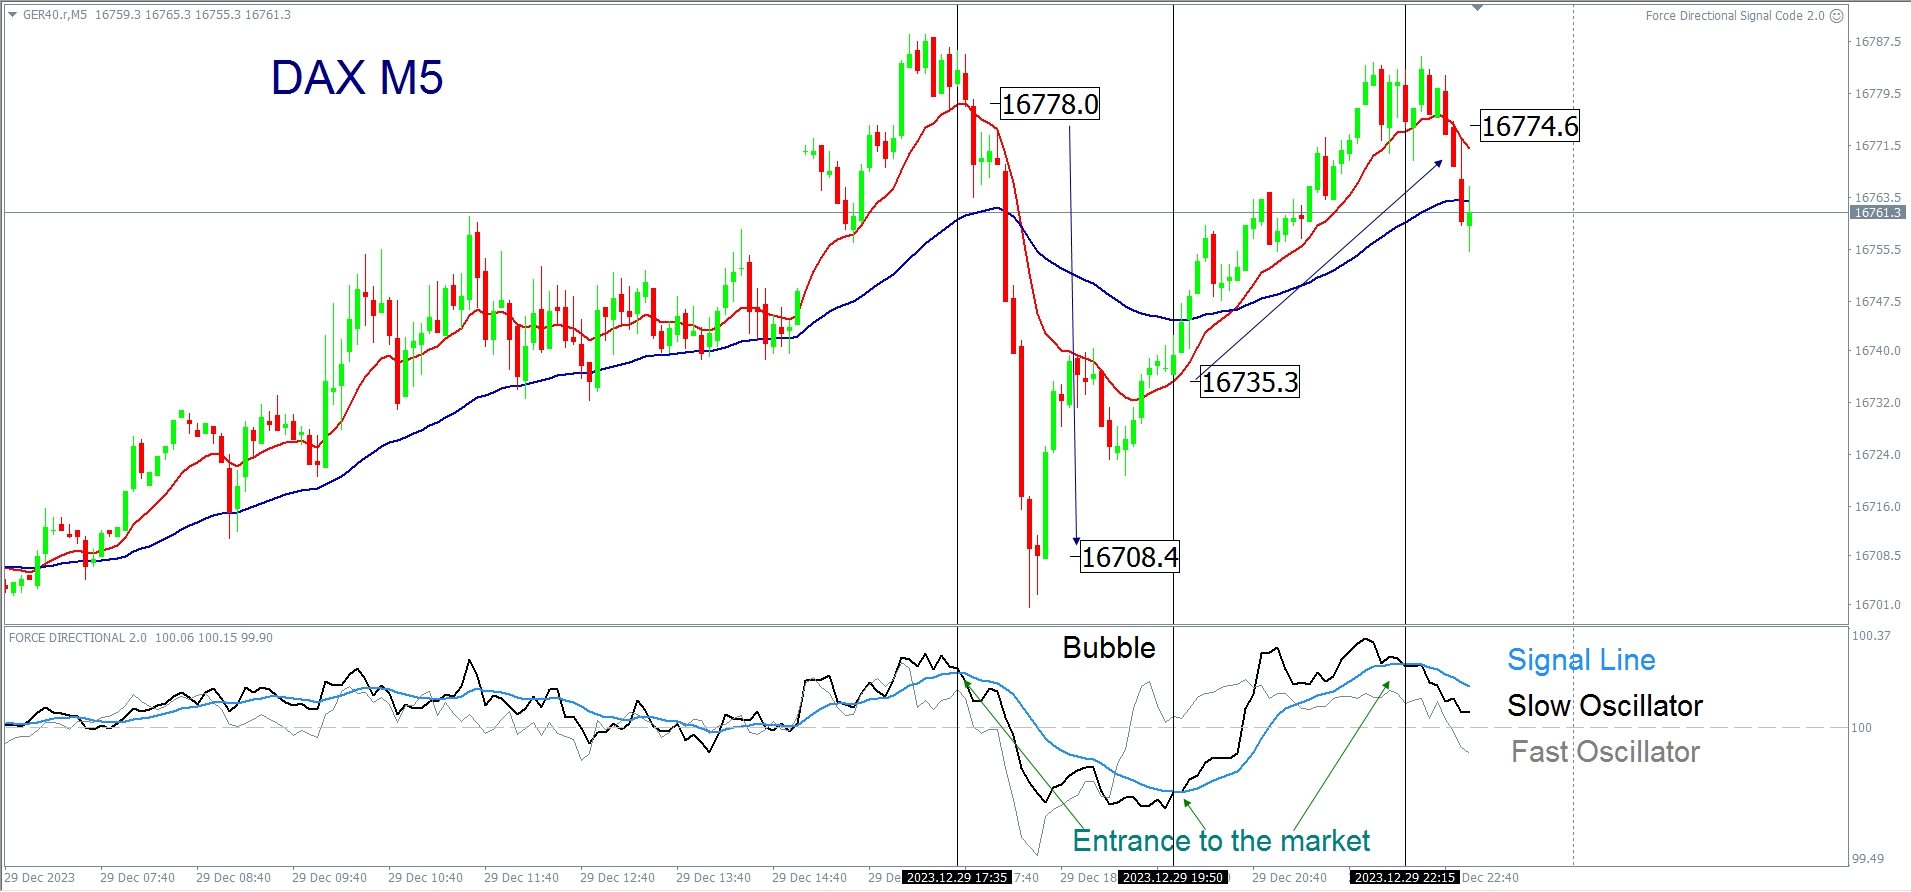
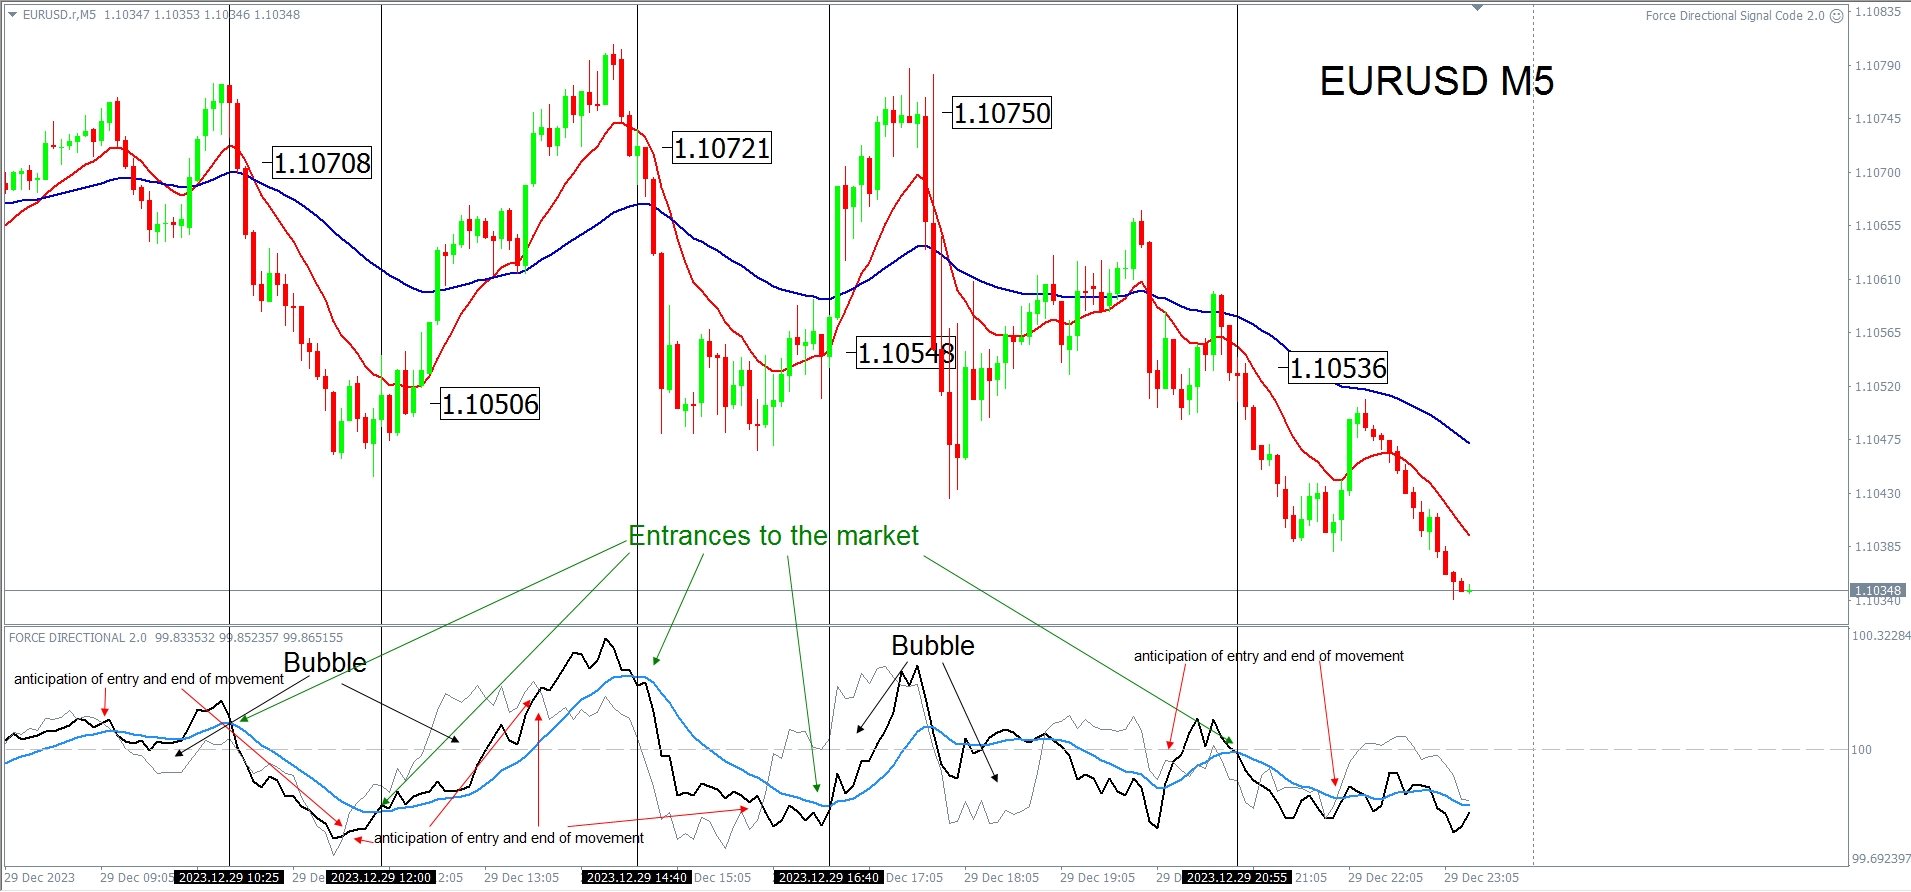
Tavsiye edilen strateji, yavaş osilatörün değeri 100'den küçükken yukarı yönlü sinyal çizgisini geçtiğinde uzun pozisyon almak ve değeri 100'den büyükken aşağı yönlü sinyal çizgisini geçtiğinde kısa pozisyon almak şeklindedir. Değerin genişlemesi ne kadar büyük olursa, giriş o kadar etkili olacaktır. Yavaş osilatör sinyal çizgisinin üzerinde olduğu sürece uzun pozisyonu koruyun ve sinyal çizgisinin altında olduğu sürece kısa pozisyonu koruyun.

Ana Desenler:
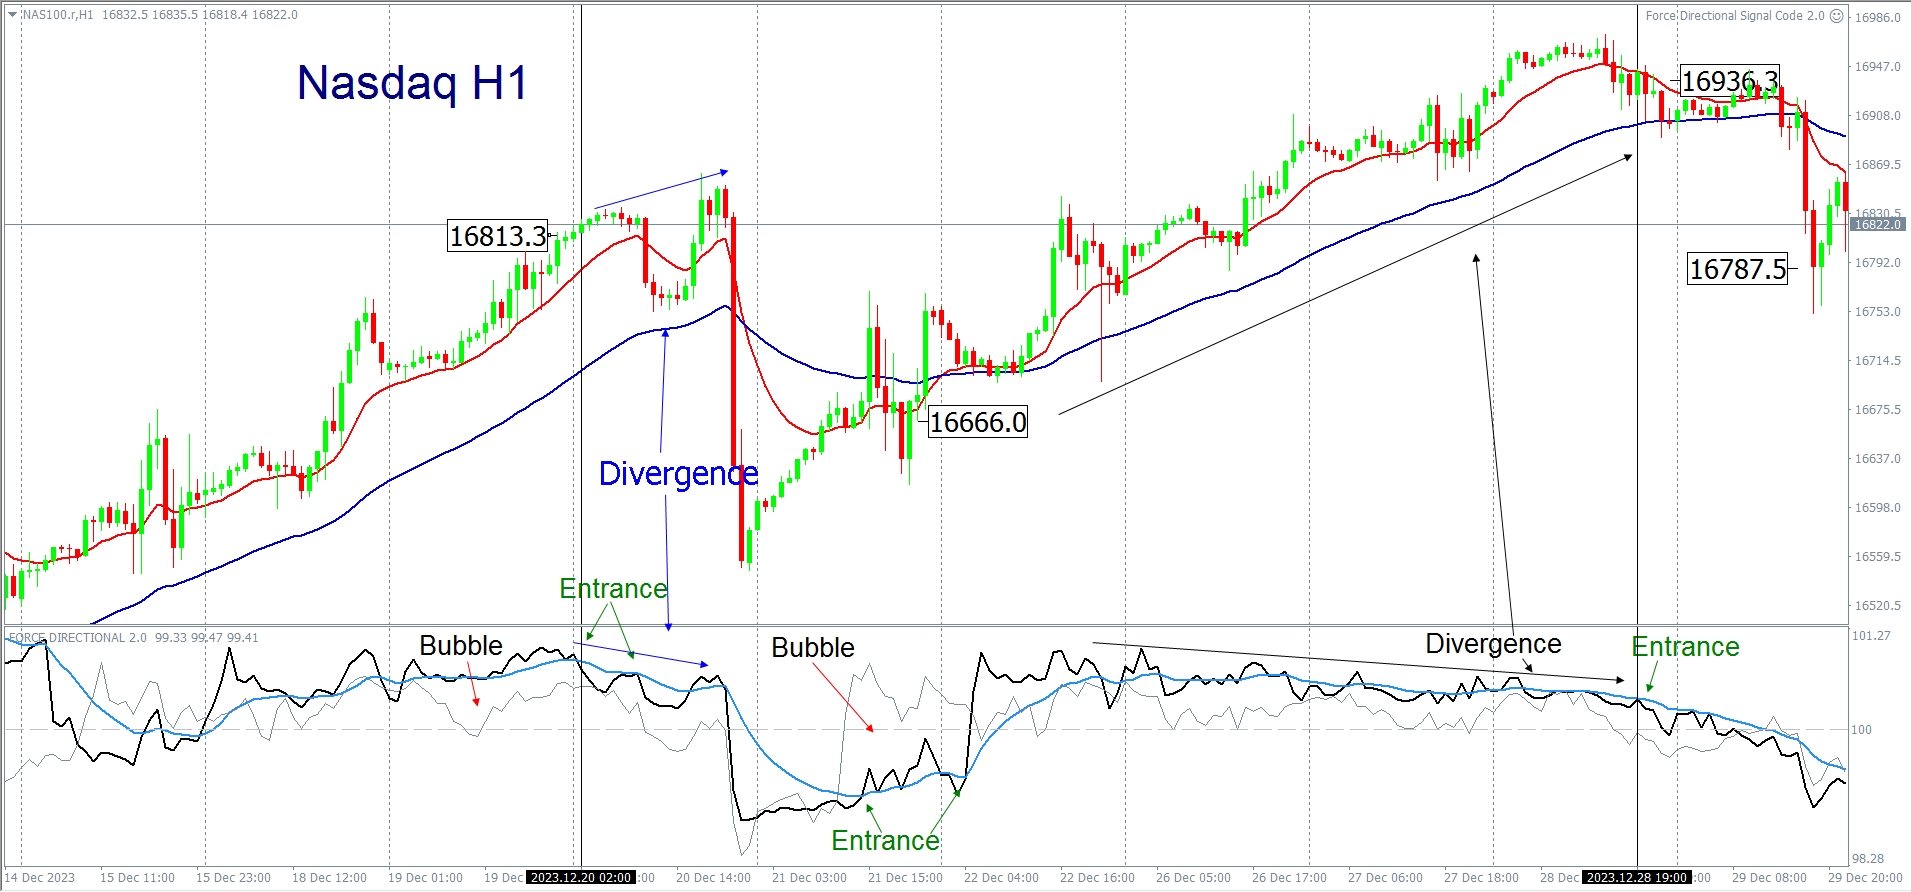
Baloncuk: Genellikle trendin tersine dönüşü veya pozisyonların tasfiyesini önceden haber verir. Hızlı osilatörün yavaşı yukarı (yükselen trendi öngörme) veya aşağı (düşen trendi öngörme) doğru kestiği durumlarda oluşur. Baloncuklar, trendin gücü ve yaklaşan sonunu değerli göstergelerdir.

Ayrışma: Yön Kuvveti, fiyat hareketlerinden ayrıştığında, potansiyel zirvelerin (Yön Kuvveti azalırken fiyatlar artarken) veya potansiyel diplerin (Yön Kuvveti artarken fiyatlar düşerken) lider göstergesi olarak yorumlanabilir.


Önerilen ürünler
Blahtech Market Profile
Blahtech Limited
4.53 (15)
Was: $249  Now: $149   Market Profile defines a number of day types that can help the trader to determine market behaviour. A key feature is the Value Area, representing the range of price action where 70% of trading took place. Understanding the Value Area can give traders valuable insight into market direction and establish the higher odds trade. It is an excellent addition to any system you may be using. Blahtech Limited presents their Market Profile indicator for the MetaTrader community. In
This is a new strategy for SUPPLY DEMAND areas It is based on a calculation using the tick volume to detect the big price action in market for both bear /bull actions this smart volume action candles are used to determine the supply and demand areas prices in between main supply and demand lines indicate sideway market  up arrows will be shown when prices moves above the main supply and the secondary supply lines Down arrows will be shown when prices moves below the main demand and the secondary
Black series MT4
Dmitriy Kashevich
1 (1)
Black series MT4 - The indicator is designed for trading on binary options with Timeframe M1-M5-M15 Multicurrency (Works on cryptocurrency and currency pairs) The signal appears when the candle opens Up to 90% correct signals There is no signal redrawing at all Can be used with other indicators. Good for scalping! In Settings there is: -Indicator working methods -I Allert Arrow color Red signal down Blue signal up Also watch the video how the indicator works and signals appear or te
Introduction It is common practice for professional trades to hide their stop loss / take profit from their brokers. Either from keeping their strategy to the themselves or from the fear that their broker works against them. Using this indicator, the stop loss / take profit points will be drawn on the product chart using the bid price. So, you can see exactly when the price is hit and close it manually.  Usage Once attached to the chart, the indicator scans the open orders to attach lines for t
Max LotSize
Luis Alberto Atuncar Sanchez
5 (1)
LotSize Indicator Discover the appropriate lot size to use in your trades based on the available margin. This indicator provides valuable information for risk management. If the indicator shows a value of 0, it means that your balance or available margin is insufficient for trading. It is important to maintain adequate margin levels for safe trading practices. This indicator is exclusively designed for the MT4 platform, a popular and reliable trading platform in the market. With the LotSize Indi
FREE
Blahtech Supply Demand
Blahtech Limited
4.64 (36)
Was: $299  Now: $149   Supply Demand uses previous price action to identify potential imbalances between buyers and sellers. The key is to identify the better odds zones, not just the untouched ones. Blahtech Supply Demand indicator delivers functionality previously unavailable on any trading platform. This 4-in-1 indicator not only highlights the higher probability zones using a multi-criteria strength engine, but also combines it with multi-timeframe trend analysis, previously confirmed swings
El indicador "MR BEAST ALERTAS DE LIQUIDEZ" es una herramienta avanzada diseñada para proporcionar señales y alertas sobre la liquidez del mercado basándose en una serie de indicadores técnicos y análisis de tendencias. Ideal para traders que buscan oportunidades de trading en función de la dinámica de precios y los niveles de volatilidad, este indicador ofrece una visualización clara y detallada en la ventana del gráfico de MetaTrader. Características Principales: Canal ATR Adaptativo: Calcula
Range Directional Force Indicator   – Designed for You to Optimize! The   Range Directional Force Indicator   is a cutting-edge tool designed to empower traders by visualizing market dynamics and directional strength. Built to offer insights into market trends and reversals, this indicator is an invaluable asset for traders seeking precision in their strategies. However, it is important to note that this indicator is   not optimized , leaving room for you to tailor it to your unique trading
EARLY REMINDER: The Starting price is 65 price will rise soon up to 365$ and then 750$ after first 10 copies of sales. Grab this offer now! Introduction Hello, traders! Welcome to the demonstration of the Forex Beast Indicator , a comprehensive tool designed to assist aspiring traders in navigating the complexities of the forex market. This indicator incorporates seven essential components to provide a well-rounded trading experience: Moving Averages Colored Zones Support and Resistance Levels
VR Cub
Vladimir Pastushak
VR Cub , yüksek kaliteli giriş noktaları elde etmenin bir göstergesidir. Gösterge, matematiksel hesaplamaları kolaylaştırmak ve bir pozisyona giriş noktalarının aranmasını basitleştirmek için geliştirildi. Göstergenin yazıldığı ticaret stratejisi uzun yıllardan beri etkinliğini kanıtlamaktadır. Ticaret stratejisinin basitliği, acemi yatırımcıların bile başarılı bir şekilde ticaret yapmasına olanak tanıyan büyük avantajıdır. VR Cub, pozisyon açılış noktalarını ve Kâr Al ve Zararı Durdur hedef sev
Bu, bir mumun kapanış fiyatını tahmin eden bir göstergedir. Gösterge öncelikle D1 çizelgelerinde kullanılmak üzere tasarlanmıştır. Bu gösterge hem geleneksel forex ticareti hem de ikili opsiyon ticareti için uygundur. Gösterge, bağımsız bir ticaret sistemi olarak kullanılabilir veya mevcut ticaret sisteminize ek olarak hareket edebilir. Bu gösterge, mevcut mumu analiz ederek mumun gövdesi içindeki belirli güç faktörlerini ve önceki mumun parametrelerini hesaplar. Böylece gösterge, piyasa hareket
Gerçek para kazanmanızı sağlayan bir bot Meta Trader Pro, hareketli ortalamaları, hareketlerin gücünü, piyasa duyarlılığını analiz eder ve çok gelişmiş trend tersine çevirme tahmin algoritması basit ve güvenilirdir. Uzun süreli operasyonlar için tasarlanmıştır. Meta Trader Pro EA stratejisi, çeşitli trend göstergelerinin yanı sıra trend tükenmesini algılayan kendi göstergesinin ve onu türünün tek örneği yapan bir piyasa duyarlılığı ölçerinin bir kombinasyonudur, çünkü bu göstergelerin tümü t
Noize Absorption Index MT4
Ekaterina Saltykova
5 (1)
Noize Absorption Index - is the manual trading system that measures the difference of pressure between bears forces and bulls forces. Green line - is a noize free index that showing curent situation. Zero value of index shows totally choppy/flat market.Values above zero level shows how powerfull bullish wave is and values below zero measures bearish forces.Up arrow appears on bearish market when it's ready to reverse, dn arrow appears on weak bullish market, as a result of reverse expectation. S
Delta Pairs
Anatolii Zainchkovskii
Delta Pairs is an indicator for pair trading, it displays the divergence of two currency pairs. Does not redraw. A useful tool for the analysis of the behavior of two currency pairs relative to each other. Purpose The Delta Pairs indicator is designed for determining the divergences in the movements of two currency pairs. This indicator is displayed as two line charts and the difference (delta) between these charts in the form of a histogram. The Delta Pairs indicator will be useful for those w
The   Visual Volatility Clustering   indicator clusters the market based on volatility. The indicator does not redraw and gives accurate data, does not use closing prices. Uses the opening prices or the highs or lows of the previous completed bar. Therefore, all information will be clear and unambiguous. The essence of the indicator is to divide the price market into certain areas according to a similar type of volatility. This can be done in any way. In this example, the indicator is configure
PipFinite Exit EDGE
Karlo Wilson Vendiola
4.83 (115)
Did You Have A Profitable Trade But Suddenly Reversed? In a solid strategy, exiting a trade is equally important as entering. Exit EDGE helps maximize your current trade profit and avoid turning winning trades to losers. Never Miss An Exit Signal Again Monitor all pairs and timeframes in just 1 chart www.mql5.com/en/blogs/post/726558 How To Trade You can close your open trades as soon as you receive a signal Close your Buy orders if you receive an Exit Buy Signal. Close your Sell orders if
Trend Yakalayıcı: Alarm İndikatörü ile Trend Yakalayıcı Stratejisi, piyasa trendlerini ve potansiyel giriş ve çıkış noktalarını belirlemede yardımcı olan çok yönlü bir teknik analiz aracıdır. Piyasa koşullarına uyum sağlayarak trend yönünün net görsel temsili için dinamik bir Trend Yakalayıcı Stratejisi sunar. Tüccarlar tercihlerine ve risk toleranslarına göre parametreleri özelleştirebilirler. Gösterge, trendleri tanımlamaya yardımcı olur, potansiyel ters dönüşleri sinyaller, trailing stop me
FREE
Gold Crazy EA   is an Expert Advisor designed specifically for trading Gold H1/ EU M15. It use some indicators to find the good Entry. And you can set SL or you can DCA if you want. It can be an Scalping or an Grid/ Martingale depend yours setting. This EA can Auto lot by Balance, set risk per trade. You also can set TP/ SL for earch trade or for basket of trade. - RSI_PERIOD - if = -1, then the default strategy works, if >0, then the RSI strategy works - MAX_ORDERS - to trade with only 1 order,
The Penta-O is a 6-point retracement harmonacci pattern which usually precedes big market movements. Penta-O patterns can expand and repaint quite a bit. To make things easier this indicator implements a twist: it waits for a donchian breakout in the right direction before signaling the trade. The end result is an otherwise repainting indicator with a very reliable trading signal. The donchian breakout period is entered as an input. [ Installation Guide | Update Guide | Troubleshooting | FAQ | A
Diamond PRO
Fanur Galamov
4.83 (41)
1 copу left for $225 Next price  --> $299 Diamond PRO is enhanced powerful version of Diamond for advanced traders. Pro version includes optimized cores, new impoved entry points filters, new multistage profit closure algorithm and сontains number of external control parameter that allows build and fine tune own tradind decisions and algorithms. The system provides more accurate market entries, analyzes and filters upcoming economic news, contains spread protection and an advanced position mana
Öncelikle, bu Ticaret Aracının Non-Repainting, Non-Redrawing ve Non-Lagging Gösterge olduğunu vurgulamakta fayda var, bu da onu profesyonel ticaret için ideal hale getiriyor. Çevrimiçi kurs, kullanıcı kılavuzu ve demo. Akıllı Fiyat Hareketi Kavramları Göstergesi, hem yeni hem de deneyimli tüccarlar için çok güçlü bir araçtır. İleri ticaret fikirlerini, Inner Circle Trader Analizi ve Smart Money Concepts Ticaret Stratejileri gibi 20'den fazla kullanışlı göstergeyi bir araya getirerek bir araya g
Alpha Trend sign has been a very popular trading tool in our company for a long time. It can verify our trading system and clearly indicate trading signals, and the signals will not drift. Main functions: Based on the market display of active areas, indicators can be used to intuitively determine whether the current market trend belongs to a trend market or a volatile market. And enter the market according to the indicator arrows, with green arrows indicating buy and red arrows indicating se
CyberZingFx Trend Reversal
Afsal Meerankutty
4.18 (17)
NEW YEAR SPECIAL DISCOUNT RUNNING NOW 40% DISCOUNT Price slashed from $149 to $89 until 3rd Jan 2025 Indicator captures the trend reversals with no-repaint Buy and Sell Arrow signals. CyberZingFx Trend Reversal Indicator - your go-to solution for accurate and reliable trend reversal signals. With its  advanced trading strategy , the indicator offers you Buy and Sell Arrow signals that do not repaint, making it a reliable tool for catching Swing Highs and Swing Lows in any market and any time fr
DracoAI is a revolutionary automated forex trading robot based on neural network.  Loss coverage is our premium exclusive feature. DracoAI IS: THE BEST MONEY MAKING SERVICE & STABLE PASSIVE INCOME PROFIT, EVEN IF YOU DO NOT PARTICIPATE IN BIDDING FINANCIAL INDEPENDENCE AND STABILITY DracoAI IS SAFE, BECAUSE: WE GUARANTEE THE SAFETY OF YOUR FUNDS NEGATIVE RESULTS OF TRADING ARE COVERED BY OUR RESERVE FUND 100% CONFIDENTIALITY Monitoring  - most popular signal at MQL5 :  https://www.mql5.com/en/s
Signaline
Ahmet Metin Yilmaz
SIGNALINE INDICATOR This indicator for all pairs and all timeframes I have just completed the M5 timeframe for deep optimization EURJPY yet. EURJPY M5 Optimization ( TP=150 , SL=130 , IndicatorPeriod=6 , Mov1=22 , Mov2=48 ) (*)Added 20.05.2019 You can find this signal page below https://www.mql5.com/en/signals/583477 Other optimizasyon results will be added on this signalpage. Input Parameters: IndicatorPeriod: Default is 8. Mov1               : Default is 21. Mov2               : Default is 48.
"Auto FIBO Pro" Crypto_Forex göstergesi - ticarette harika bir yardımcı araçtır! - Gösterge, Fibo seviyelerini ve yerel trend çizgilerini (kırmızı renk) otomatik olarak hesaplar ve grafikte yerleştirir. - Fibonacci seviyeleri, fiyatın tersine dönebileceği önemli alanları gösterir. - En önemli seviyeler %23,6, %38,2, %50 ve %61,8'dir. - Ters scalping veya bölge ızgara ticareti için kullanabilirsiniz. - Auto FIBO Pro göstergesini kullanarak mevcut sisteminizi geliştirmek için birçok fırsat vardı
Night ghost
Dmitriy Kashevich
Night Ghost - İkili opsiyonlar için ok göstergesi. Bu, gelecekte sizin için güvenilir bir yardımcıdır! - Grafikte yeniden çizim yok -Tüm döviz çiftlerinde harika çalışıyor! -%90'a varan gösterge doğruluğu (Özellikle geceleri) -Uzun süre kurulum yapmaya gerek yok (İkili Opsiyonlar için mükemmel kurulum) - Geç olmayan sinyaller - Mevcut mum üzerinde bir sinyalin görünümü -M1 dönemi için mükemmel (Artık Yok!) - Göz dostu mum rengi (Kırmızı ve Mavi) -Yüklü Uyarı Onunla çalışmak: - Mavi
Owl smart levels
Sergey Ermolov
4.28 (36)
MT5 versiyonu  |  FAQ Owl Smart Levels Indicator ,   Bill Williams'ın gelişmiş fraktalları , piyasanın doğru dalga yapısını oluşturan Valable ZigZag ve kesin giriş seviyelerini gösteren   Fibonacci seviyeleri   gibi popüler piyasa analiz araçlarını içeren tek gösterge içinde eksiksiz bir ticaret sistemidir. pazara ve kar elde edilecek yerlere. Stratejinin ayrıntılı açıklaması Gösterge ile çalışma talimatı Baykuş Yardımcısı ticaretinde Danışman Yardımcısı Kullanıcıların özel sohbeti -> Satın ald
The Chaikin Oscillator is a technical indicator developed by Marc Chaikin that combines price and volume data to measure the accumulation and distribution of a financial instrument. It aims to identify potential buying and selling opportunities in the market. The Chaikin Oscillator is calculated by subtracting a 10-day exponential moving average of the Accumulation Distribution Line (ADL) from a 3-day exponential moving average of the ADL. Here's how to use the Chaikin Oscillator indicator in tr
Bu ürünün alıcıları ayrıca şunları da satın alıyor
İŞLEM HIZI, piyasada büyük emirlerin nerede ve ne zaman biriktiğini ve bunun faydalarını gösteren en kaliteli göstergedir. Trend değişikliklerini çok erken aşamada tespit eder. Aynı anda hem bir gösterge hem de bir ticaret sistemidir. Konsept benzersiz ve inanılmaz derecede karlı. Forex'te tik hacmi oldukça yanıltıcı bir şekilde hacim olarak adlandırılır. Aslında, fiilen İŞLEM HIZI olan birim zaman başına fiyat değişimidir. Bu gösterge, Forex'teki hacim fikrini mantıksal olarak doğru şekilde t
Automatic, live & interactive picture of all trendlines. Assign push, email and sound alerts to the lines of your choice and be informed about price rollback, breakout, rollback after breakout, number of rollbacks, line expiration by double breakout. Correct, drag or delete the lines and interactively tune the line system. https://youtu.be/EJUo9pYiHFA . Chart examples https: //www.mql5.com/en/users/efficientforex Price Interaction Events All events are effective immediately and only after one
The indicator displays the probable ( Support and resistance ) levels. The indicator draws horizontal and trend levels of support and resistance. The indicator settings: Trends - the mode for displaying trend lines or horizontal lines of support and resistance Yes - display trend lines only No - display horizontal lines only UseResource - use the resources built into the indicator. Yes - use the ZigZag indicator from the resources of the product. No - use a custom ZigZag indicator. HistoryBar -
The [GRAFF] III manual trading system is based on multiple MetaTrader (MT4) indicators. Together, the entire PACK of GRAFF III indicators makes an advanced trading tool. The system consists of over 20 different custom-built indicators which have been carefully selected and tested in the long term to produce strong and efficient trading signals. The particular indicators are based on different mathematical formulas, so the entire system is calibrated to remove false signals from its own indicator
A simplistic indicator informing a user on RSI divergence by sending messages to mobile device and email. The indicator draws 2 vertical lines, marking two RSI extrema that formed the divergence. You get the alert, open the charts and make a decision. The indicator does not show past divergences, thus when you attach it to a chart for the first time you see nothing. Graphics and alerts will appear as soon as divergences do. Drop it in Tester to see how it works. Parameters: RSIPeriod - number of
Sweet Waffle
Christophe Godart
The arrows are calculated with: -     2 Parabolic  parameters -     2 ADX parameters -     4 Stochastic parameters We recommend to combine it with Parabolic, ZigZag or Elliot waves indicator. Always trade the trend! If you make sure to draw your trend lines and support/resistance zones you will just have to wait for the signal to appear. Take the trade. For Binary Options it is advisable to set the expiry time to 5-15 min in M1 chart. THIS INDICATOR IS ZERO REPAINT Best assets to trade: - EUR
Let´s try to make some real money! Call me profit addicted. I thought why not try to make THE dream come reality. With discipline, a clear strategy and this indicator I focus on entering the perfect trades. This indicator is very easy to use as you will get perfect entry points for Put or Call trades. The arrows are calculated with: -     Momentum  parameters -     Candle stick patterns -     Fundamental Price action We recommend to combine it with Parabolic, ZigZag or Elliot waves indicator
Golden Chip provides Basic Market Structure, Fibonacci, supply and Demand Zones. Letting you identify when a sell off point is approaching or whne a buy opportunity is arriving. The awesome thing about Golden Chip is that, you will see rejection levels or continuation before ANYBODY ! This indicator moves directly with price and lines up perfectly with the Chart. Some indicators would lag but NOT this one ! Golden Chip is amazing for Clean chart (Naked Chart). GOLDEN CHIP IS ONLY ON METATRADER (
ManualTradingTrend
Mukhriddin Ibragimov
Трендовый индикатор МТ4, дающий точные сигналы для входа в сделки. Работает без перерисовки и запаздываний! Только покупателем данного индикатора прилагается основной фильтр,обращайтесь в личку.   Идеальные точки входа в сделки для     валют, крипты, металлов, акций, индексов . Наилучшие результаты на таймфрейме M30 и выше! Наш канал в Telegram  |   Версия индикатора для MT5 Скоро   видео  for indicator Большинство трейдеров улучшают торговые результаты в первую неделю торговли с инд
The channels
Mansour Rahkhofteh
Counter trade type indicator. Jcounter can capture the timing of the trend collapse phase. There are signs of a trend collapse. It is the world standard to confirm the sign with LSMA adopted by Jcounter. The numerical setting of LSMA is very important, but after many years of verification, the numerical value was identified and completed. When the trend starts, the rising market moves like a support, and the falling market moves like a resistance. Gradually overtake the candlestick and
Axebagsh
Batsukh Sumchin Khuyagbaatar
Only work on Crude Oil H1  time frame  Swing follow trend.  do not trade against trends Specifies the first destination and entry and exit points For 16 years, I only traded on CrudeOil. Crude oil is one of the most extreme combinations in the world and it is safe to say that such a good indicator has never been made before.   This indicator will save you a lot of money because it introduces a new type of approach, Good luck
Forex Signal Generator is a cutting edge technology for Trend Trading, and filtering all inbuilt in one tool. The Signal Generator  analysis the market like a Pro  by using its smart algorithms to detect  the trend, filter out market noise  and display on  your chart with the : ENTRY, STOPLOSS AND TARGET PROFIT Advantages You Get     Access to the proven reliable trend indicator based     Easy and  effective trend detection.     Gives you the ability to filter  out  'NOISE' from the market  
The breakout algorithm is a technique based on price, price features, to shape a breakout strategy. The strategy in this indicator will not be redrawn (none-repaint indicator), it is suitable for short or long term traders In the screenshot is the EURUSD pair, these currency pairs, commodities or stocks, it have similar strength *Non-Repainting (not redrawn) *For Metatrader4 Only *Great For Scalping *Great For Swing Trading *Arrow Entry, Green is Long, Red is Short *Works On Any Timeframe *Work
MMM Gold Sniper
Gilang Wardhana Purnama Putra
Indicator is based on Market Maker Strategy. NO REPAINT. MM's are traders and their objective is to make money.  This includes strategies to trade against retails traders.  The major difference between them and other traders is that they have the ability, through access to massive volumes, to move price at their will.  So to make money, they aim to buy at a lower price and then sell at a higher price. They achieve this by:  1. Inducing traders to take positions. This is achieved by using a rang
IconTrade
Vadim Gorodetskii
Place the indicator on the chart, preferably with a timeframe of H1 or H4. If you are trading in the daily range or, conversely, on lower timeframes, you will need to adjust the RSI and ATR levels accordingly.  The blue arrows of the indicator will be a signal to open a long position, the red arrows will be a signal to open a short position: 1) Blue arrow for longs (growth) and red arrow for shorts (decline). 2) Two horizontal lines for current positions (one for entry and one for stop).  3
WARNING!! THIS SWORD IS TOO SHARP!    ONLY 10 COPIES LEFT FOR THE NEXT PRICE TO BE 8,000$ FOR UNLIMITED PLAN. Dear traders I am very glad once again to introduce to you my other tool called "Forex Sword Indicator". In short this tool is meant to give you an edge over the market that you have been waiting for  so long. Now, here it is. It is a very very simple tool but yet a dangerous sword. I call it a  Holy grail indicator!. I will not talk a lot about this tool. Just let the tool speak by itse
IconTradeSL
Vadim Gorodetskii
IconTradeSL.  Возможность выставлять sl по уровням. В индикаторе установлена возможность показывать историю уровней на графике. Возможность выставлять sl по уровням. Настройки индикатора: ЦВЕТ_BAR - цвет баров по которым ищем SL ЦВЕТ_Тек_BAR - Purple;//цвет текущего бара BAR - поиск в последних BAR барах (по умолчанию 200) show_bar - показывать бары по которым ищем SL
FxBears Süper Ticaret Göstergesi ile gelişmiş ticaret dünyasına hoş geldiniz. MT4 platformu için özel olarak tasarlanan bu yenilikçi araç, Elliott Waves'in, arz ve talep bölgelerinin ve dahili göstergelerin gücünü birleştirerek yatırımcılara bilinçli ticaret kararları için yüksek kaliteli sinyaller sağlar. %90'ın üzerinde başarı oranına sahip FxBears Super, ticaret stratejinize yeni bir hassasiyet ve karlılık düzeyi getiriyor. Corse'un Yeniden Boyanması ve Yeniden Çizilmesi Yok. Elliott Dalga
IRDeS 1 0
Jan Carlos Pagano
IRDeS (Mesafe ve Spike Algılama Göstergesi) , neredeyse mükemmel bir zamanlama ile piyasaya girmeyi sağlayan sıfır seviyesinden uzaklık ve kuvvet göstergesidir. Bu, sıfır seviyesinden uzaklığı ve volatiliteyi algılayan mavi renkli sürekli bir çizgi ve sıfır seviyesinin üzerinde kırmızı renkli bir histogram ve sıfır seviyesinin altında yeşil renkli bir histogramdan oluşur. Belirli bir mumda işlemin gücünü ve kuvvetini ölçer, grafikte belirli bir noktada güçlü bir itme, yani "spike" üretir. IRDeS
IA Trendx3 PRO
Marco Aurelio Santos Costa
What if God Created a Trade System? No miracles... Just see how mathematics can be effective in the market. We managed to combine technical analysis / price action into indicators, creating the best setup for trading, be it in Forex, Indices, or stocks. It took us 2 years to create something that really works, and now it's time for you to discover it. TrendX3 is a revolution in trend analysis. Based on advanced algorithms and real-time data, it provides valuable insights so that you can make inf
The 10PIPS Dynamite
Stephen Kehinde Kuku
The 10PIPS Dynamite is a semi-automated  cutting-edge Forex indicator designed to    automatically revolutionize your trading skills from a being a losing trader to becoming a profitable trader simply by Scalping   10 pips per Trade setup generated by the software. 10PIPS Dynamite Indicator once attached on the main chart it starts an in-depth market analysis based on its unique in-built advanced algorithm which seamlessly combines powerful indicators, statistical analysis, and trend recognition
User Manual Download link: https://ontrd.com/our-books/ For all who are asking about indicator  ON Trade Numerology Station It obtain about 16 numerology strategies it make together completed unit control your trading . Basic strategies to work with it are 3 strategies statistics about them are the following : 1. RBA levels success rate more then 95%. 2. FF more then 96%  3.RBA SUN 98% We will not say 100 % as they are .. Ratio rates as following :  1.Rba levels more then 1/3 to 1/6 . 2.FF MORE
Best Divergence Indicator for advanced traders without distraction of lines or arrows. It is not a magic blackbox for novice traders rather a great tool for experienced traders to decide their entry and exit. Can be used for most of the Forex pairs, Gold, Oil, Crypto. Flexibility to play with input to customize ur unique research too.  Therefore, I will suggest turning off arrows and divergence line to reduce clutter and instead use the following advice: For sell on divergence indicator start tu
Advanced True Trend Detector known as TrueTrendStar(TTS) is a very Sensitive Highly Predictive indicator of Price Trends for Professional traders. ( Feb Month End Sale-Massive Discount of 30% !!! Sale off!!! )    This indicator detects advanced signals of high odds changes in Price Trend direction long before other indicator detects it. I have been working on it since 2019.    This is possible due to fractal nature of forex and other financial markets,which this indicator exploits and capture
Gann Made Easy
Oleg Rodin
4.79 (112)
Gann Made Easy , bay teorisini kullanarak ticaretin en iyi ilkelerine dayanan, profesyonel ve kullanımı kolay bir Forex ticaret sistemidir. WD Gann. Gösterge, Zararı Durdur ve Kâr Al Seviyeleri dahil olmak üzere doğru SATIN AL ve SAT sinyalleri sağlar. PUSH bildirimlerini kullanarak hareket halindeyken bile işlem yapabilirsiniz. Lütfen satın aldıktan sonra benimle iletişime geçin! Alım satım ipuçlarımı ve harika bonus göstergelerini ücretsiz olarak sizinle paylaşacağım! Muhtemelen Gann ticaret y
Dynamic Forex28 Navigator
Bernhard Schweigert
5 (4)
Dynamic Forex28 Navigator - Yeni Nesil Forex Ticaret Aracı. ŞU ANDA %49 İNDİRİM. Dynamic Forex28 Navigator, uzun zamandır popüler olan göstergelerimizin evrimidir ve üçünün gücünü tek bir göstergede birleştirir: Gelişmiş Döviz Gücü28 Göstergesi (695 inceleme) + Gelişmiş Döviz İMPULS ve UYARI (520 inceleme) + CS28 Kombo Sinyalleri (Bonus). Gösterge hakkında ayrıntılar https://www.mql5.com/en/blogs/post/758844 Yeni Nesil Güç Göstergesi Ne Sunuyor?  Orijinallerde sevdiğiniz her şey, şimdi yeni
Gold Stuff
Vasiliy Strukov
4.86 (248)
Gold Stuff, özellikle altın için tasarlanmış bir trend göstergesidir ve herhangi bir finansal enstrümanda da kullanılabilir. Gösterge yeniden çizilmez ve gecikmez. Önerilen zaman dilimi H1. Bu göstergede tam otomatik Uzman Danışman EA Gold Stuff çalışır. Profilimde bulabilirsiniz. Ayarları ve kişisel bir bonusu almak için satın alma işleminden hemen sonra benimle iletişime geçin!  Güçlü Destek ve Trend Tarayıcı göstergemizin ücretsiz bir kopyasını pm'den alabilirsiniz. Ben! AYARLAR Ok Çiz -
-   Real price is 80$   - 40% Discount ( It is 49$ now ) - Lifetime update free Contact me for instruction, add group and any questions! Related Products:  Bitcoin Expert , Gold Expert - Non-repaint - I just sell my products in Elif Kaya profile, any other websites are stolen old versions, So no any new updates or support. Introduction The breakout and retest strategy is traded support and resistance levels. it involves price breaking through a previous level.  The break and retest strategy is
Gold Venamax MT4
Sergei Linskii
5 (1)
Gold Venamax   - bu en iyi hisse senedi teknik göstergesidir. Gösterge algoritması bir varlığın fiyat hareketini analiz eder ve oynaklığı ve potansiyel giriş bölgelerini yansıtır. Gösterge özellikleri: Bu, rahat ve karlı ticaret için Magic ve iki Blok trend oku içeren süper bir göstergedir. Grafikte blokları değiştirmek için Kırmızı Düğme görüntülenir. Magic, gösterge ayarlarında ayarlanır, böylece göstergeyi farklı Blokları görüntüleyen iki grafiğe yükleyebilirsiniz. Gold Venamax farklı ok t
Lux Trend
Mohamed Hassan
5 (3)
The starting price is $75. It will increase to $120 after 30 sales. 17 copies left. After purchase, please contact me to get your trading tips + more information for a great bonus!   Lux Trend is a professional strategy based on using Higher Highs and Lower Highs to identify and draw Trendline Breakouts! Lux Trend  utilizes two Moving Averages to confirm the overall trend direction before scanning the market for high-quality breakout opportunities, ensuring more accurate and reliable trade s
Yazarın diğer ürünleri
IRDeS 1 0
Jan Carlos Pagano
IRDeS (Mesafe ve Spike Algılama Göstergesi) , neredeyse mükemmel bir zamanlama ile piyasaya girmeyi sağlayan sıfır seviyesinden uzaklık ve kuvvet göstergesidir. Bu, sıfır seviyesinden uzaklığı ve volatiliteyi algılayan mavi renkli sürekli bir çizgi ve sıfır seviyesinin üzerinde kırmızı renkli bir histogram ve sıfır seviyesinin altında yeşil renkli bir histogramdan oluşur. Belirli bir mumda işlemin gücünü ve kuvvetini ölçer, grafikte belirli bir noktada güçlü bir itme, yani "spike" üretir. IRDeS
Filtrele:
İnceleme yok
İncelemeye yanıt