Cobra Pivot Points MT4
- Göstergeler
- Rajesh Kumar Nait
- Sürüm: 1.0
- Etkinleştirmeler: 5
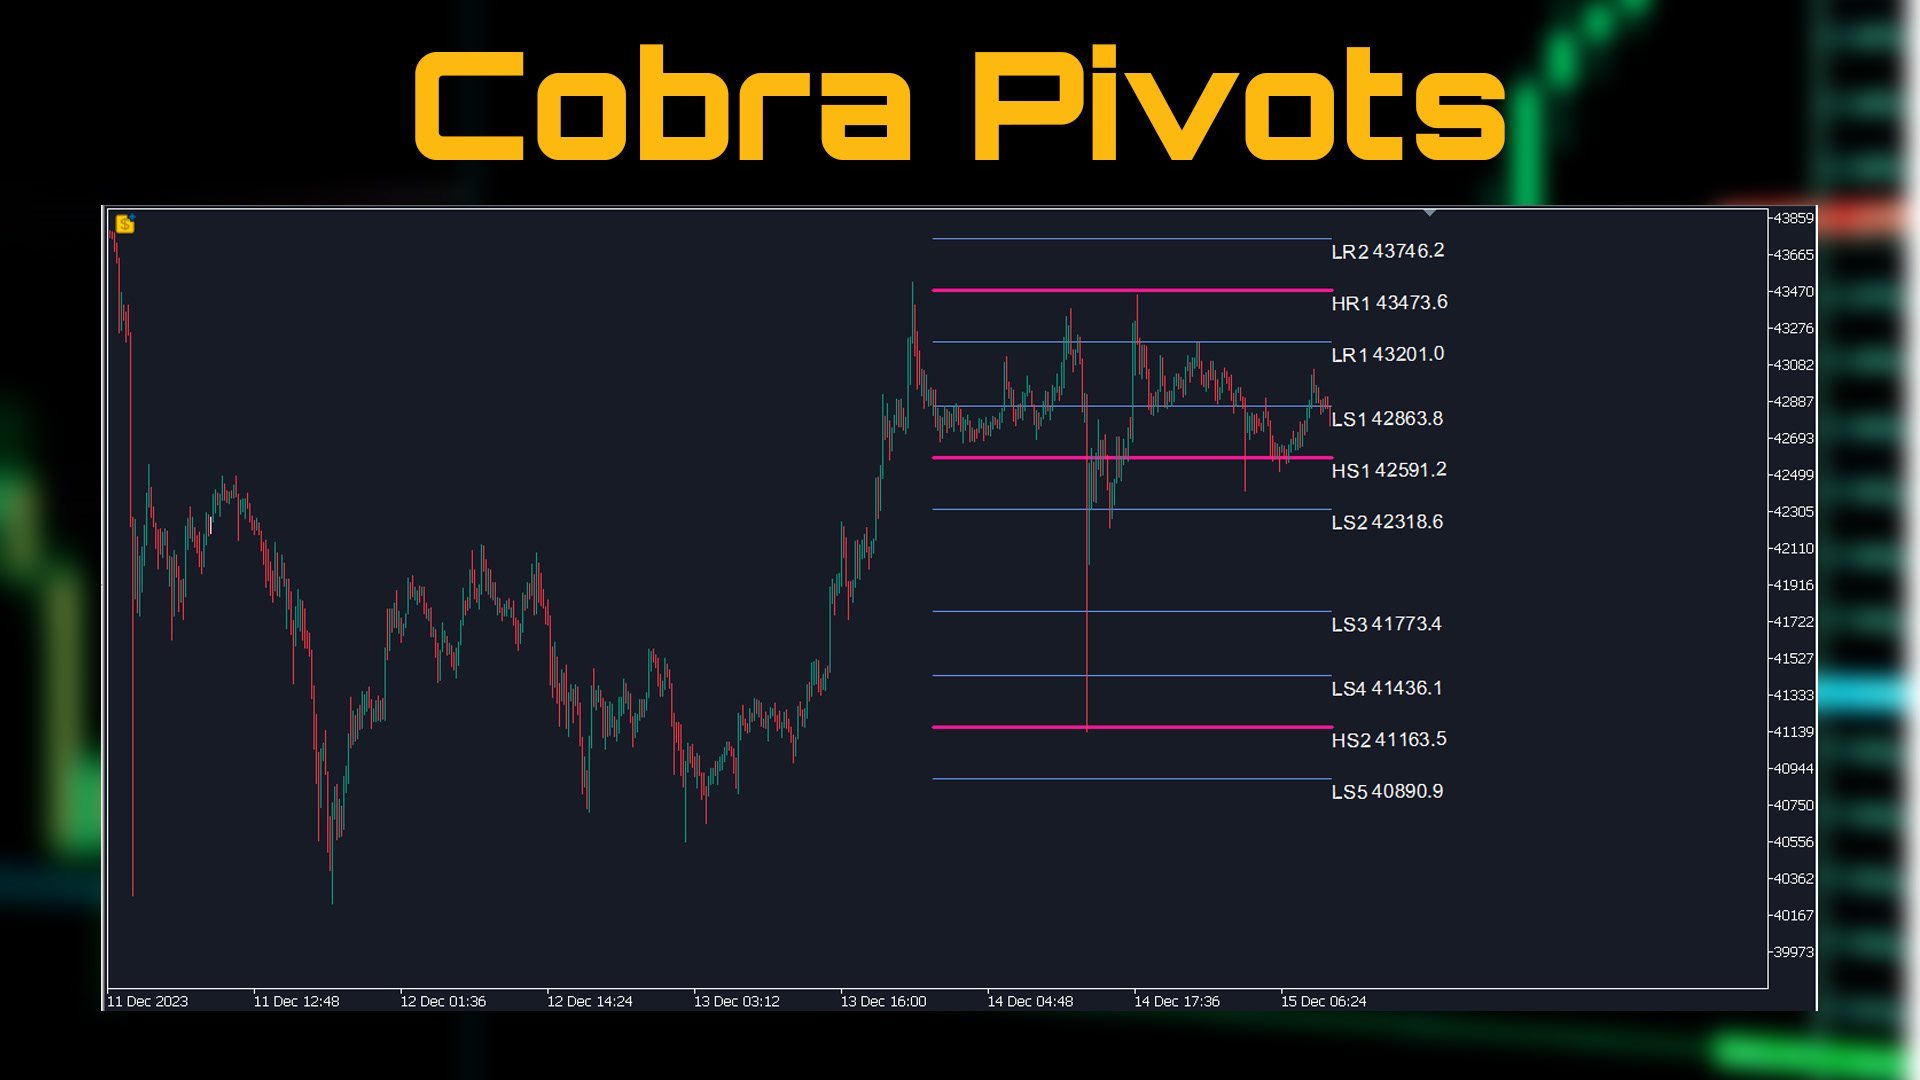
Cobra Pivot Noktaları, DEMO'yu indirerek kendinizi test edebileceğiniz en iyi optimize edilmiş pivot noktalarını çizmeye yönelik bir göstergedir.
1. En İyi İki Pivot Modunu Seçin: Cobra Pivots veya Camrilla Pivots
2. D1 ile sınırlı olmamak üzere istediğiniz zaman dilimini kullanabilirsiniz.
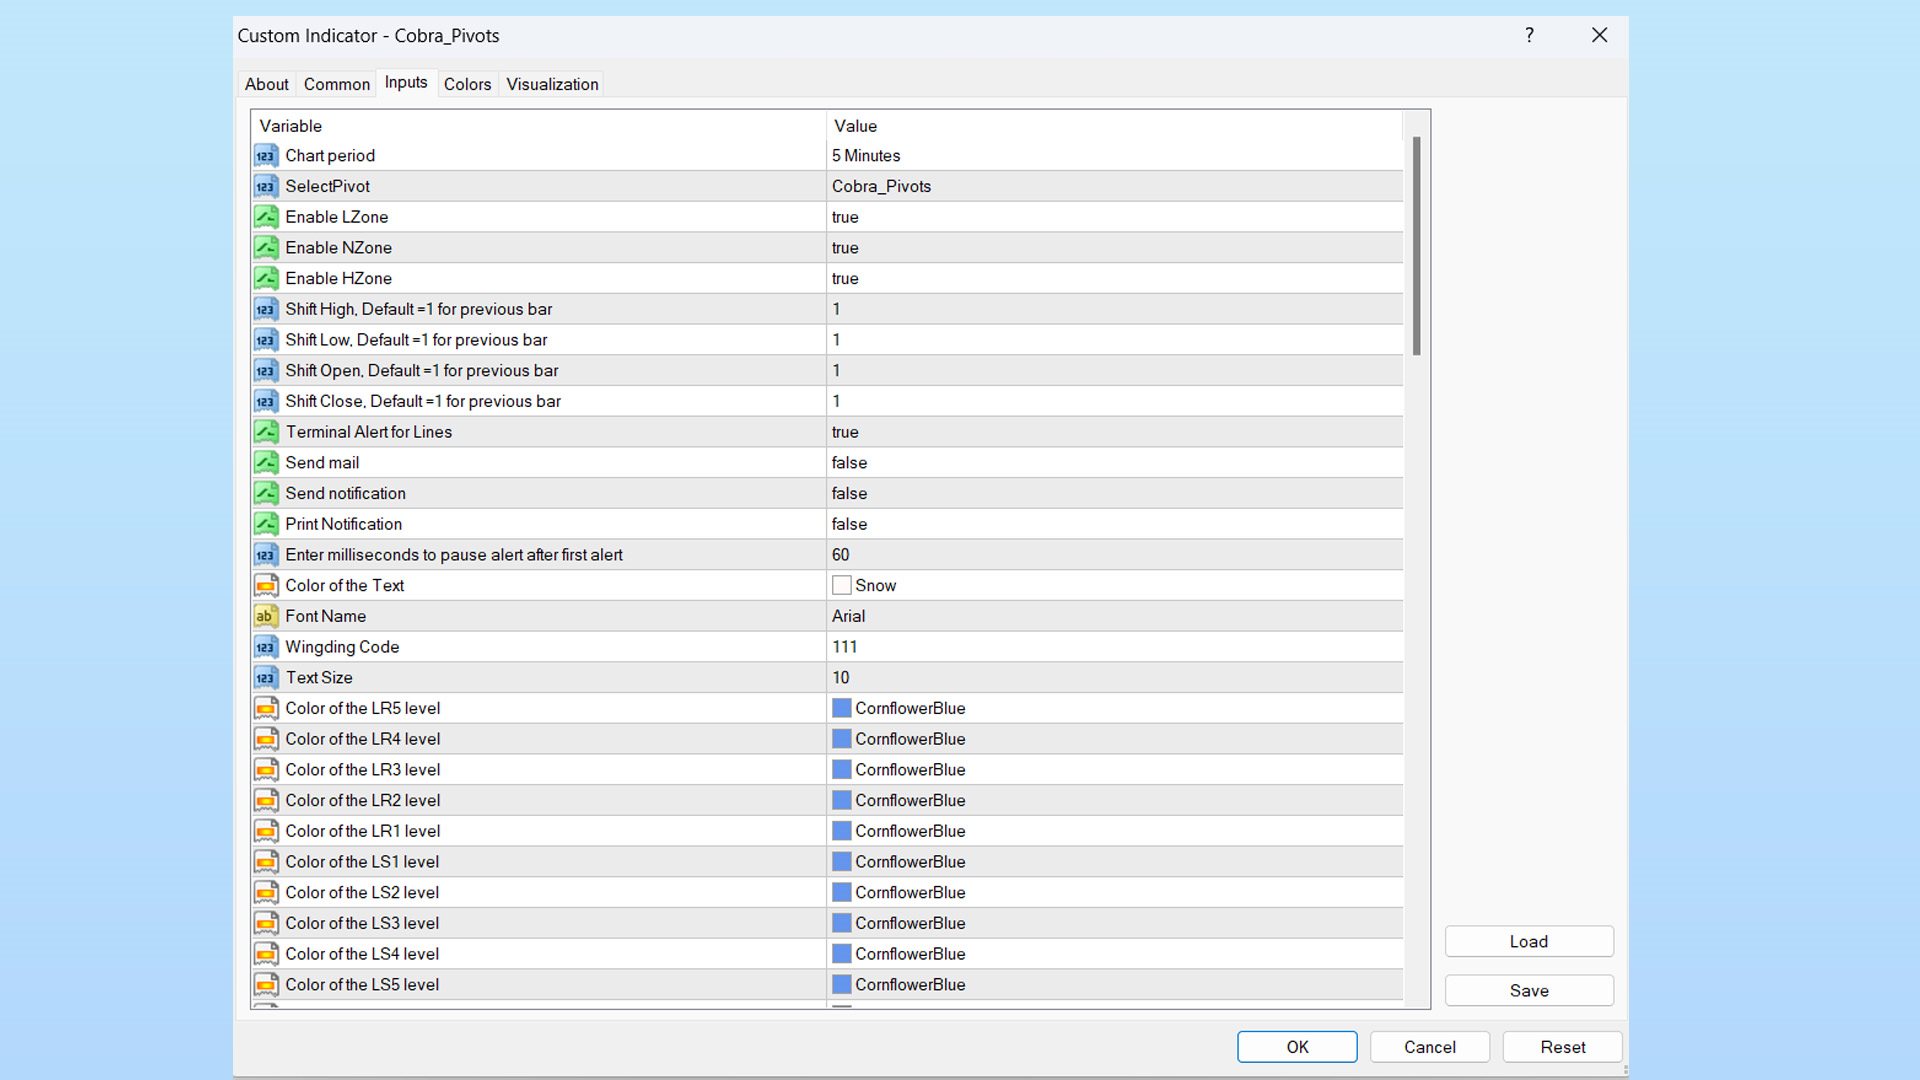
3. Shift parametresi ile Önceki gün Yüksek Düşük Kapanış değeri ile oynayabilirsiniz. 1 = Önceki Çubuk, 2 = Önceki çubuktan önceki Çubuk vb.. Bu parametreler pivotlar üzerinde araştırma ve geliştirme yapmanıza yardımcı olacaktır.
4. Seviyelere dokunduğunuzda Uyarı, E-posta veya Anlık Bildirim. Seviyeye dokunulduğunda pivot seviyesi azaltılmış kabul edilir ve bu nedenle sizi tekrar uyarmaz. Tekrar uyarı almak istiyorsanız uyarıları sıfırlamak için zaman dilimlerini değiştirmeniz gerekir.
5. Çizgi Rengini, Çizgi Stilini, Çizgi Genişliğini, Metin Rengini ve Yazı Tipini tamamen özelleştirin.
Cobra Pivot'lar üç bölgeye ayrılır: LZone (scalping için çok yakın seviyeler), NZone (piyasa konsolide olduğunda) ve HZone (konumsal ticaret için en iyi biraz mesafeli seviye) gösterge ayarlarından gösterilebilir/gizlenebilir.
Camrilla Pivot Formülü:
LS1 = ÖNCEKİ GÜN KAPANIŞ- ((ÖNCEKİ GÜN YÜKSEK-ÖNCEKİ GÜN DÜŞÜK)*0,50);
LS2 = ÖNCEKİ GÜN KAPANIŞ- ((ÖNCEKİ GÜN YÜKSEK-ÖNCEKİ GÜN DÜŞÜK)*0,75);
LS3 = ÖNCEKİ GÜN KAPANIŞ- ((ÖNCEKİ GÜNÜN YÜKSEK-ÖNCEKİ GÜN DÜŞÜK));
LS4 = ÖNCEKİ GÜN KAPANIŞ- ((ÖNCEKİ GÜN YÜKSEK-ÖNCEKİ GÜN DÜŞÜK)*1,25);
HS1 = ÖNCEKİ GÜN KAPALI+ ((ÖNCEKİ GÜN YÜKSEK-ÖNCEKİ GÜN DÜŞÜK)*0,5);
HS2 = ÖNCEKİ GÜN KAPANIŞ+ ((ÖNCEKİ GÜN YÜKSEK-ÖNCEKİ GÜN DÜŞÜK)*0,75);
HS3 = ÖNCEKİ GÜN KAPALI+ ((ÖNCEKİ GÜNÜN YÜKSEK-ÖNCEKİ GÜN DÜŞÜK));
HS4 = ÖNCEKİ GÜN KAPANIŞ+ ((ÖNCEKİ GÜN YÜKSEK-ÖNCEKİ GÜN DÜŞÜK)*1,25);
1. En İyi İki Pivot Modunu Seçin: Cobra Pivots veya Camrilla Pivots
2. D1 ile sınırlı olmamak üzere istediğiniz zaman dilimini kullanabilirsiniz.
3. Shift parametresi ile Önceki gün Yüksek Düşük Kapanış değeri ile oynayabilirsiniz. 1 = Önceki Çubuk, 2 = Önceki çubuktan önceki Çubuk vb.. Bu parametreler pivotlar üzerinde araştırma ve geliştirme yapmanıza yardımcı olacaktır.
4. Seviyelere dokunduğunuzda Uyarı, E-posta veya Anlık Bildirim. Seviyeye dokunulduğunda pivot seviyesi azaltılmış kabul edilir ve bu nedenle sizi tekrar uyarmaz. Tekrar uyarı almak istiyorsanız uyarıları sıfırlamak için zaman dilimlerini değiştirmeniz gerekir.
5. Çizgi Rengini, Çizgi Stilini, Çizgi Genişliğini, Metin Rengini ve Yazı Tipini tamamen özelleştirin.
Cobra Pivot'lar üç bölgeye ayrılır: LZone (scalping için çok yakın seviyeler), NZone (piyasa konsolide olduğunda) ve HZone (konumsal ticaret için en iyi biraz mesafeli seviye) gösterge ayarlarından gösterilebilir/gizlenebilir.
Camrilla Pivot Formülü:
LS1 = ÖNCEKİ GÜN KAPANIŞ- ((ÖNCEKİ GÜN YÜKSEK-ÖNCEKİ GÜN DÜŞÜK)*0,50);
LS2 = ÖNCEKİ GÜN KAPANIŞ- ((ÖNCEKİ GÜN YÜKSEK-ÖNCEKİ GÜN DÜŞÜK)*0,75);
LS3 = ÖNCEKİ GÜN KAPANIŞ- ((ÖNCEKİ GÜNÜN YÜKSEK-ÖNCEKİ GÜN DÜŞÜK));
LS4 = ÖNCEKİ GÜN KAPANIŞ- ((ÖNCEKİ GÜN YÜKSEK-ÖNCEKİ GÜN DÜŞÜK)*1,25);
HS1 = ÖNCEKİ GÜN KAPALI+ ((ÖNCEKİ GÜN YÜKSEK-ÖNCEKİ GÜN DÜŞÜK)*0,5);
HS2 = ÖNCEKİ GÜN KAPANIŞ+ ((ÖNCEKİ GÜN YÜKSEK-ÖNCEKİ GÜN DÜŞÜK)*0,75);
HS3 = ÖNCEKİ GÜN KAPALI+ ((ÖNCEKİ GÜNÜN YÜKSEK-ÖNCEKİ GÜN DÜŞÜK));
HS4 = ÖNCEKİ GÜN KAPANIŞ+ ((ÖNCEKİ GÜN YÜKSEK-ÖNCEKİ GÜN DÜŞÜK)*1,25);