• Genel bakış
  • İncelemeler
  • Yorumlar
  • Yenilikler

Dow Histogram v1

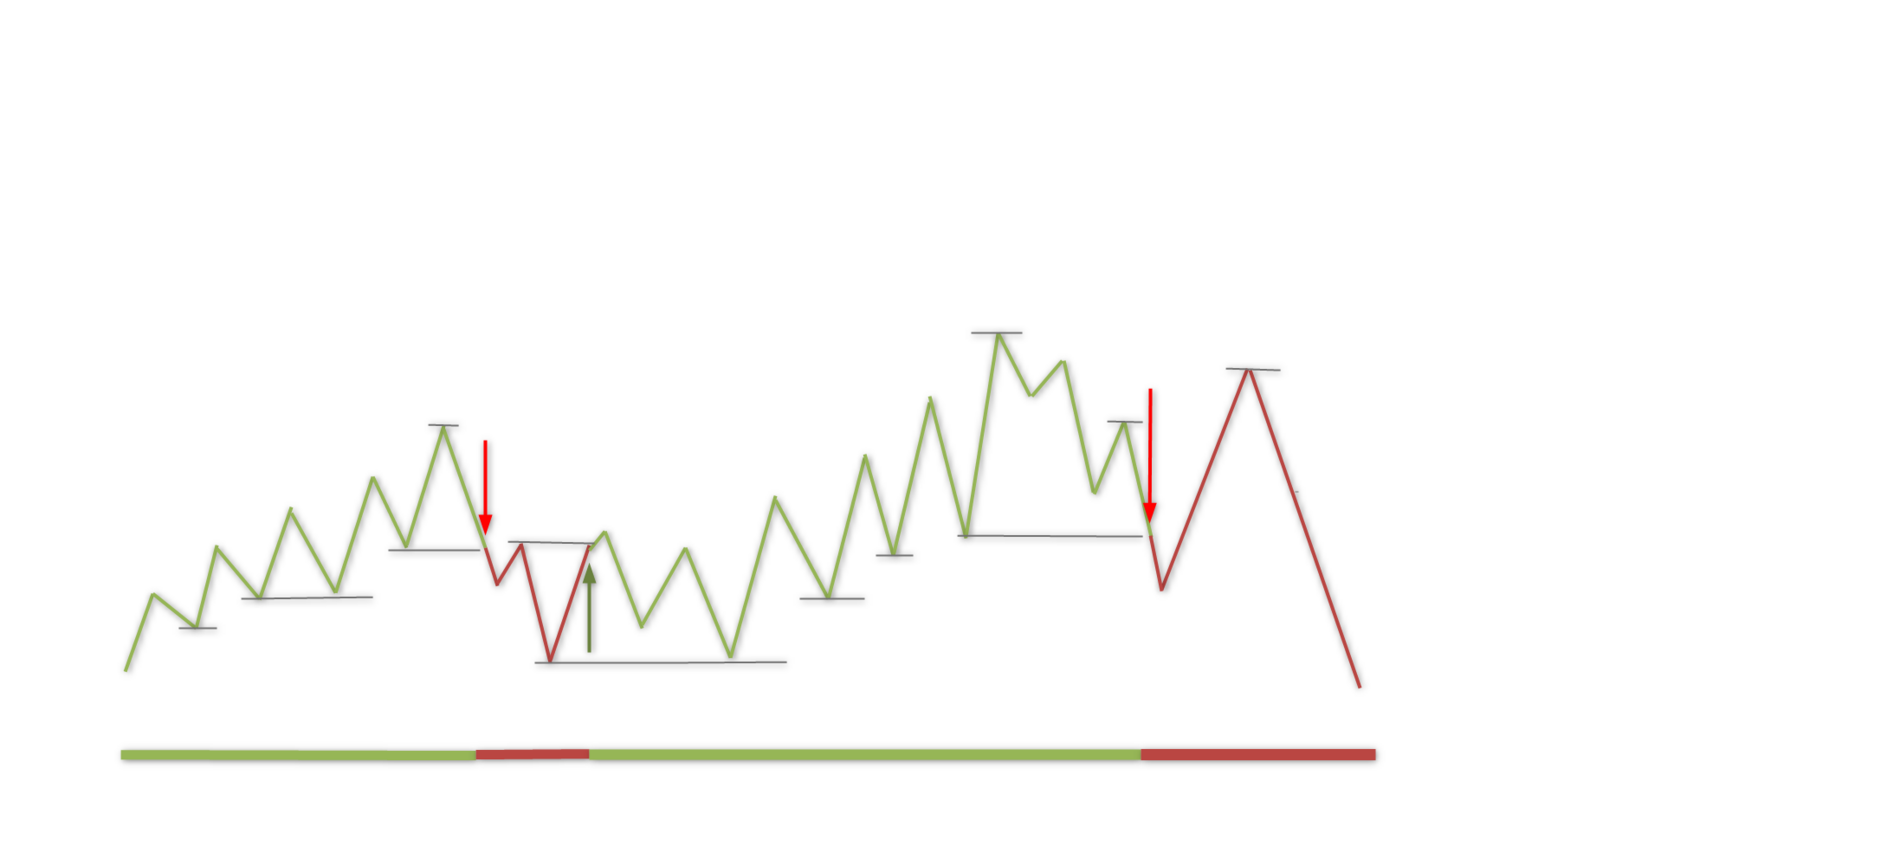
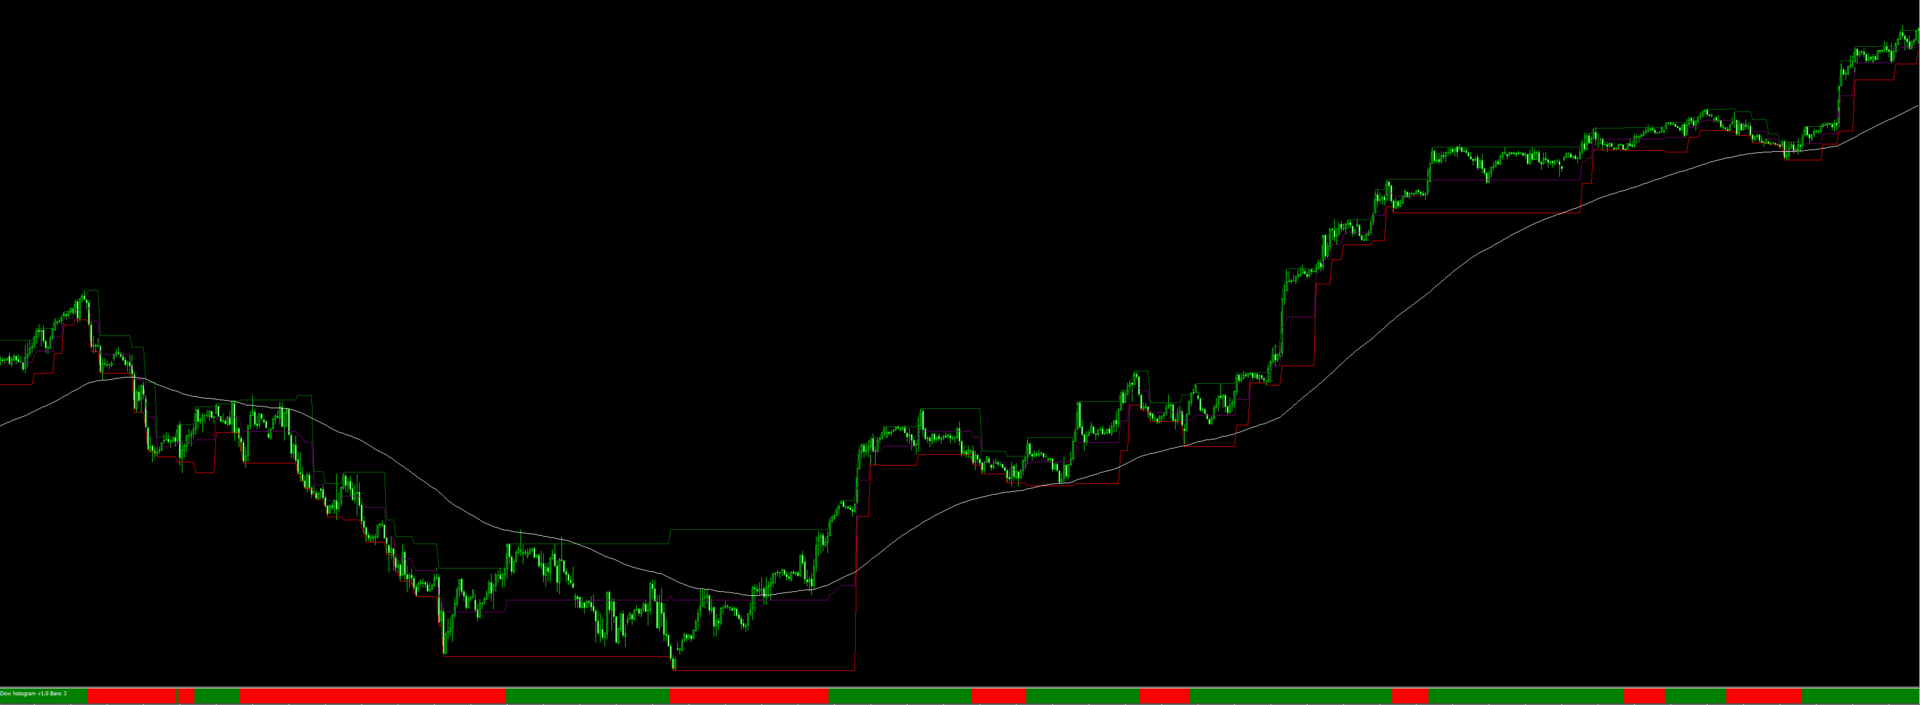
You've probably heard about the Dow trend Theory, where higher highs and lows indicate an uptrend, and lower highs and lows indicate a downtrend. This indicator determines this trend based on the Dow Theory. You just need to enter a number representing the number of candles between extremes. The optimal solution is the number 3, unless you want to have the trend from M5 but you're on M1, then you need to multiply this number by 5.

Check various combinations to trade with the trend.

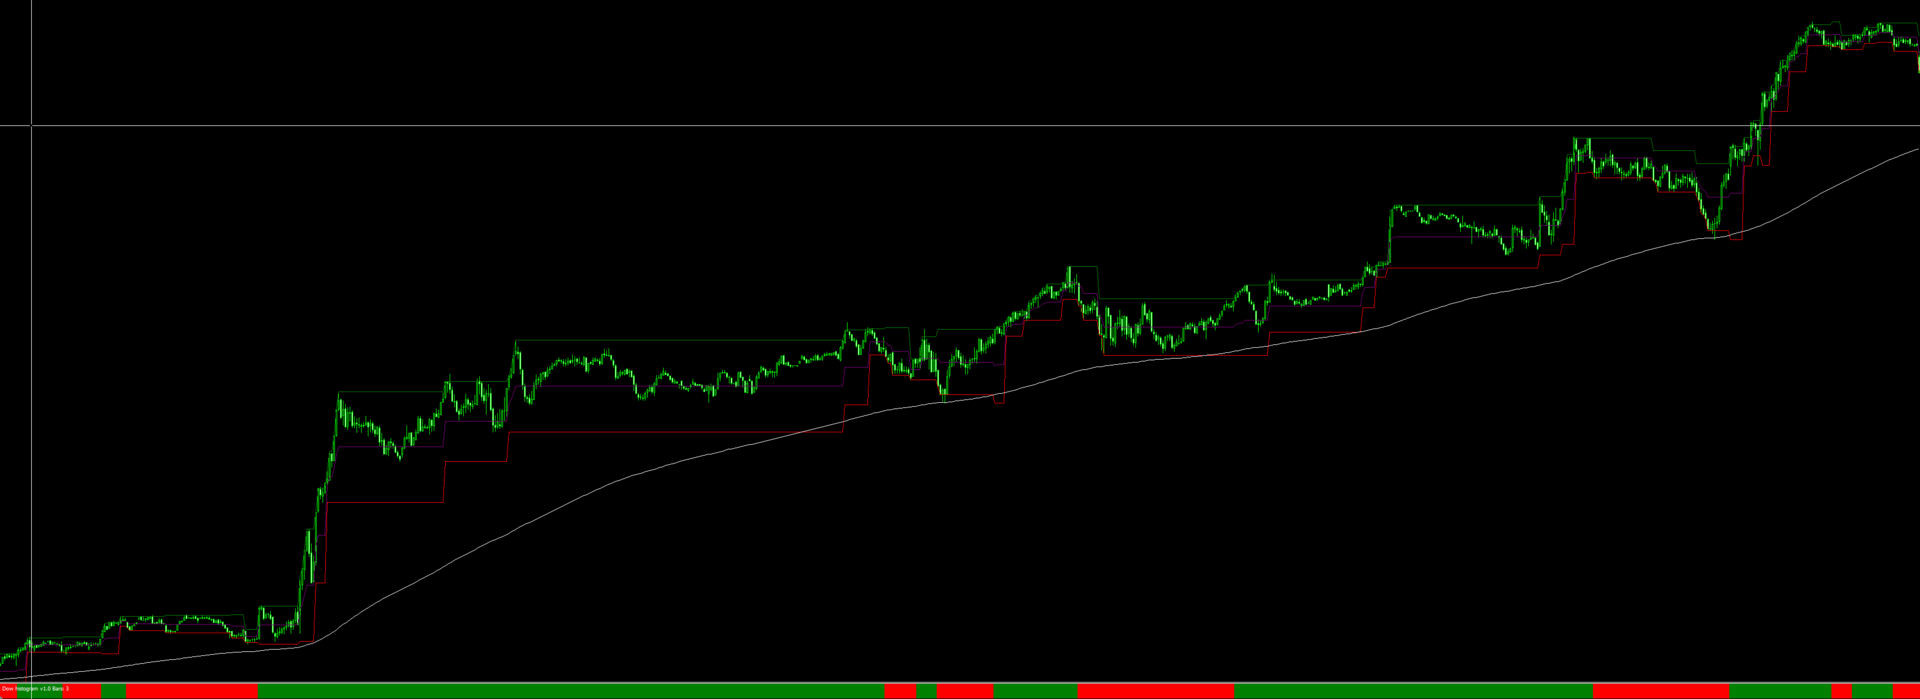
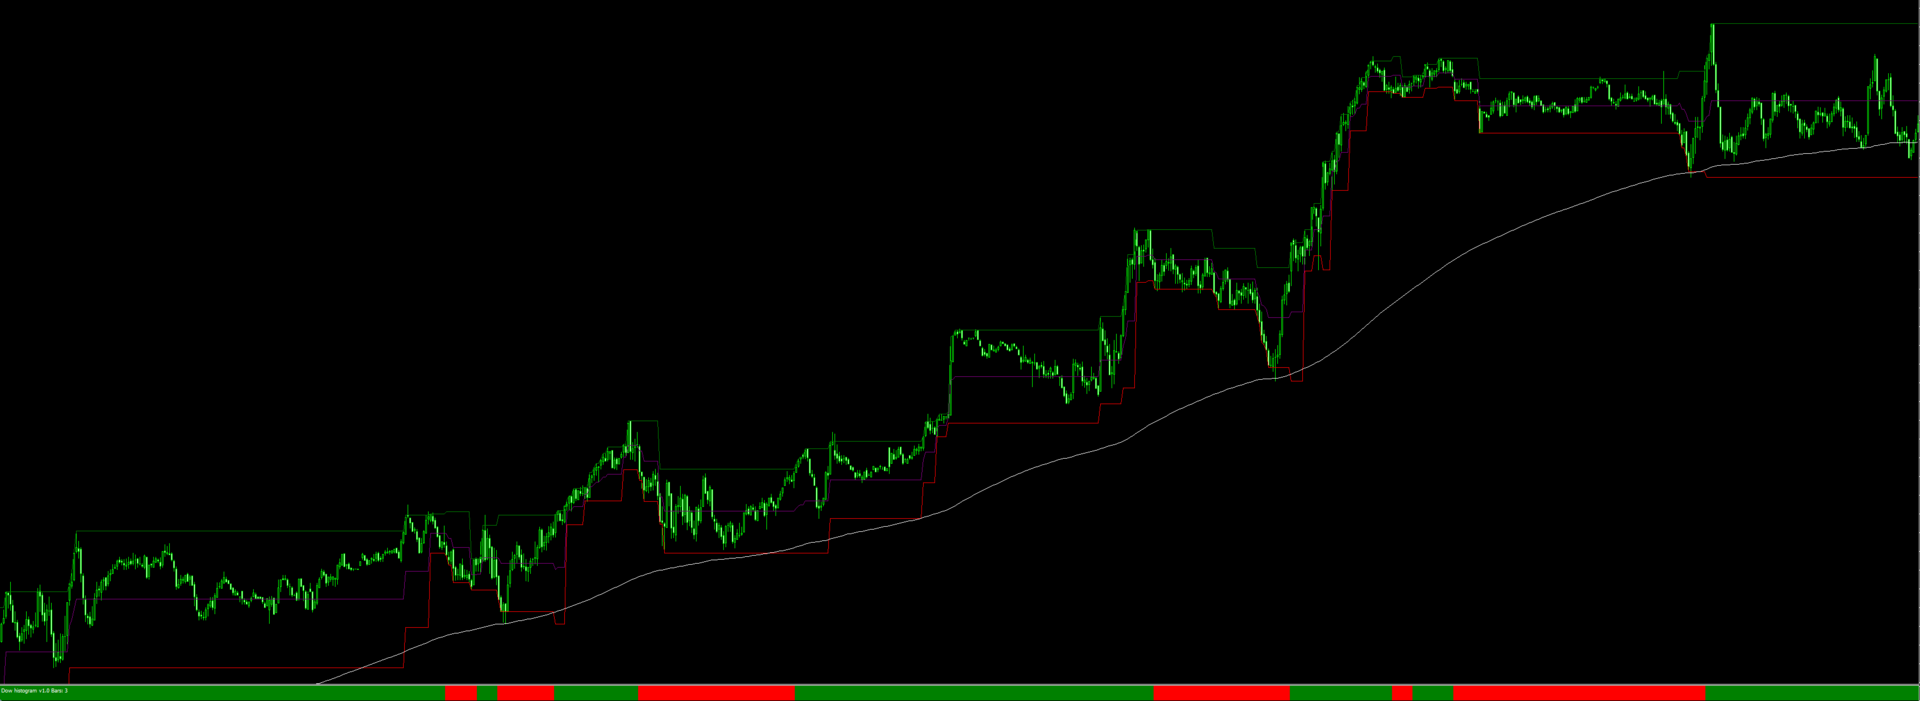
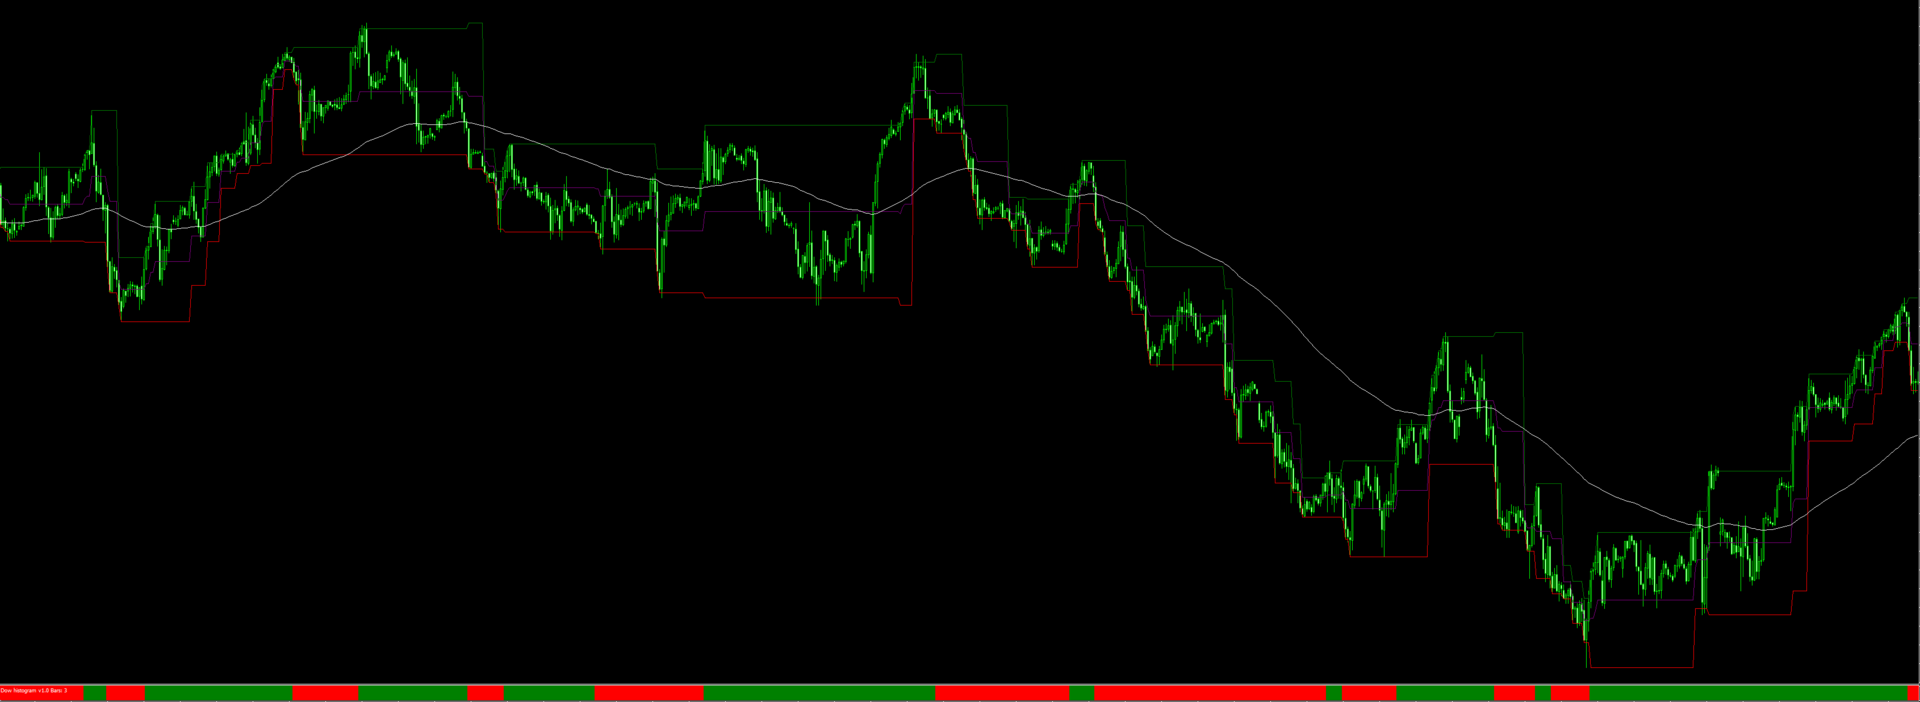
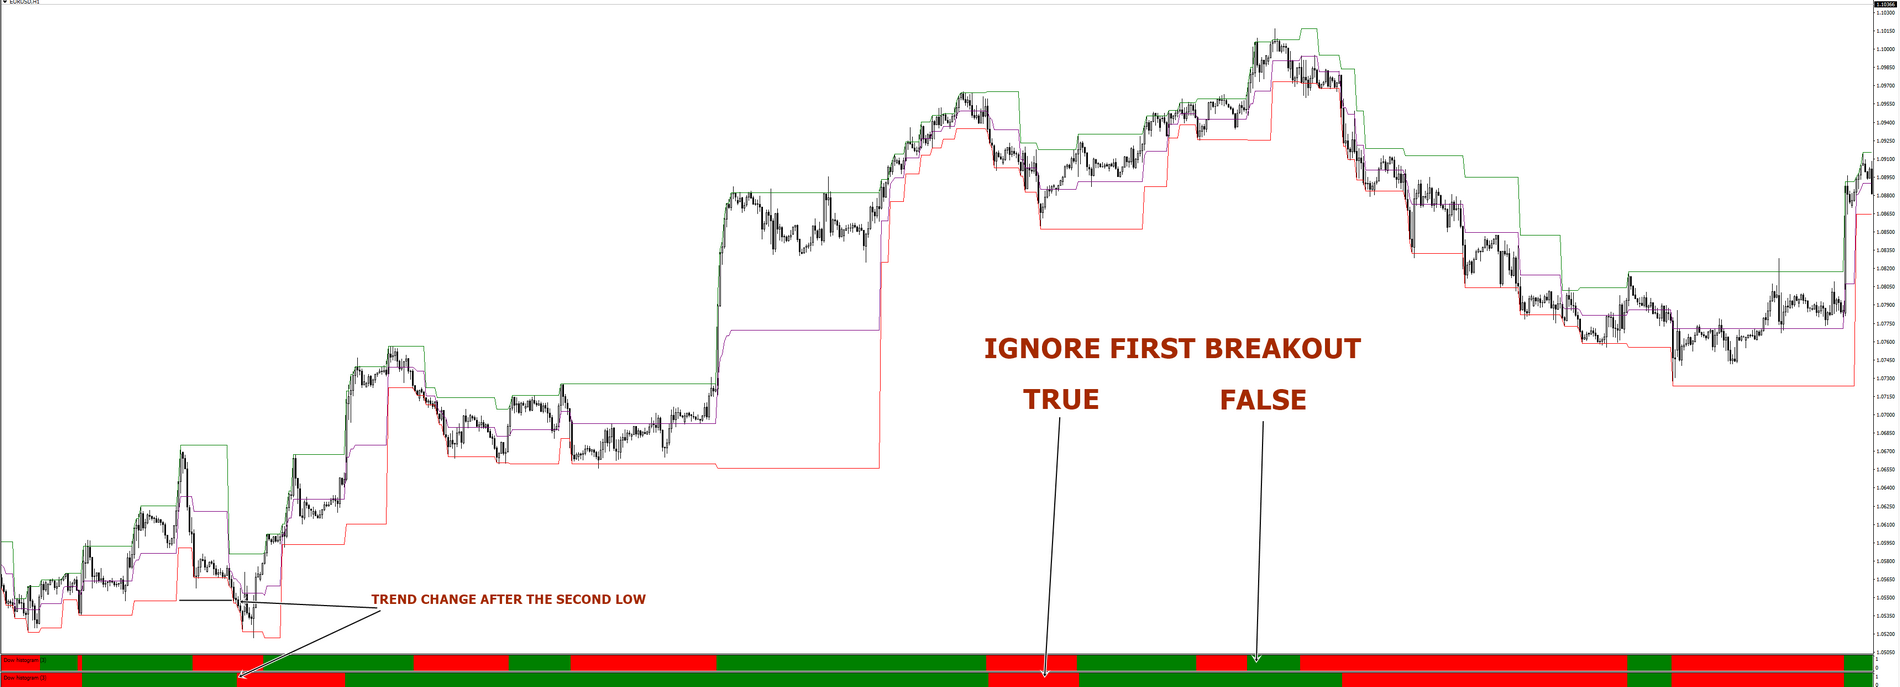
In the screenshots, you can see the "Dow trend band" indicator, which shows how the "Dow histogram" identifies extremes.

Dow trend bands you can dawnoload here: https://www.mql5.com/en/market/product/109778?source=Unknown

The indicator does not repainting, is set to refresh every minute, which means it refreshes after the first tick in each new minute.


Additionally :
-Ignore first breakout
-Sound alert on trend change.
-Alert Notification
-Alert Notification on your mobile phone


Önerilen ürünler
The Scaled Awesome Oscillator (SAO) represents a refined adaptation of the Awesome Oscillator, aimed at establishing consistent benchmarks for identifying market edges. Unlike the standard Awesome Oscillator, which records the variation in pips across different commodities, the only unchanging reference point is the zero line. This limitation hampers investors and traders from pinpointing specific levels for trend reversals or continuations using the traditional Awesome Indicator, a creation of
FREE
TIbors Timer
Tibor Hartmut Sturm
Indikator zur klaren Anzeige im Metatrader Dieser Indikator wurde von mir Entwickelt damit die Anzeige der relevanten Parameter klar und deutlich im Chart auf einen Blick zu sehen ist.  Er dient zur Information und ist ohne Gewähr.  Folgende Parameter werden angezeigt: -   Der  Aktuelle Kurs - Das Aktuelle Handelspaar - Die Restzeit zur nächsten Kerzenbildung / Zum Abschluss der Aktuellen Kerze - Die Kontonummer des Handelskontos - Die Frei Verfügbare Margin - Die Margin auf 1 Lot - Der Akt
FREE
GTAS STrend
Riviera Systems
4.5 (2)
GTAS S-Trend is a momentum indicator that helps to determine trends using combination of MACD, RSI and moving averages. This indicator was created by Bernard Prats Desclaux, proprietary trader and ex-hedge fund manager, founder of E-Winvest. Description The indicator oscillates between -65 and +65 with a neutral zone between -25 and +25 around a 0 equilibrium line. S-Trend between -25 and +25 indicates congestion zones with a bullish bias between 0 and +25, and a bearish bias between 0 and -25
FREE
Email Drawdown Alert
Roman Starostin
5 (12)
Free informative Indicator-helper. It'll be usefull for traders who trade many symbols or using grid systems (Averaging or Martingale). Indicator counts drawdown as percent and currency separate. It has a number of settings: Count deposite drawdown according equity value and send e-mail or notifications to user if DD more than set; Sending e-mail when max open orders reached; Shows price and remaining pips amount before MarginCall on current chart and Account generally; Display summary trade lot
FREE
MASi Three Screens
Aleksey Terentev
5 (2)
MASi Three Screens is based on the trading strategy by Dr. Alexander Elder. This indicator is a collection of algorithms. Algorithms are based on the analysis of charts of several timeframes. You can apply any of the provided algorithms. List of versions of algorithms:     ThreeScreens v1.0 - A simple implementation, with analysis of the MACD line;     ThreeScreens v1.1 - A simple implementation, with analysis of the MACD histogram;     ThreeScreens v1.2 - Combines the first two algorithms
FREE
Stochastic Arrow
Anton Iudakov
4.5 (4)
The indicator has combined 5 popular strategies. Draws an arrow after confirming a signal for the selected strategy. There are signal alerts. Doesn't redraw its values. I recommend watching my advisor -   Night Zen EA 5 strategies. The main line crosses the signal line. The main line crosses the signal line in the oversold (for buy) / overbought (for sell) zones. The main line enters the oversold (for sell) / overbought (for buy) zones . The main line comes out of the oversold (for buy ) / ove
FREE
Are you tired of drawing trendlines every time you're analyzing charts? Or perhaps you would like more consistency in your technical analysis. Then this is for you. This indicator will draw trend lines automatically when dropped on a chart. How it works Works similar to standard deviation channel found on mt4 and mt5. It has 2 parameters: 1. Starting Bar 2. Number of bars for calculation The   starting bar   is the bar which drawing of the trend lines will begin, while the   number of bars for c
FREE
OrderBlock TS Roman
Vladislav Vlastovskii
3.8 (5)
Индикатор строит блоки заказов (БЗ) по торговой системе (ТС) Романа. Поиск блоков осуществляется одновременно на двух таймфремах: текущем и старшем (определяемым в настройках). Для оптимизации и игнорирования устаревших блоков в настройках задается ограничение количества дней в пределах которых осуществляется поиск блоков. Блоки строятся по правилам ТС состоящем из трех шагов: какую свечу вынесли (что?); какой свечой вынесли (чем?); правило отрисовки (как?).
FREE
Free automatic Fibonacci is an indicator that automatically plots a Fibonacci retracement based on the number of bars you select on the BarsToScan setting in the indicator. The Fibonacci is automatically updated in real time as new highest and lowest values appears amongst the selected bars. You can select which level values to be displayed in the indicator settings. You can also select the color of the levels thus enabling the trader to be able to attach the indicator several times with differe
FREE
TrendPlus
Sivakumar Subbaiya
4.08 (12)
Trend Plus   Trendplus  Indicator   Time Frame: Suitable for any time frame.  Purpose: Trend Prediction. Blue and red candle indicate the buy and sell call respectively. Buy: When the blue candle is formed buy call is initiated. close the buy trades when the next red candle will formed.   Sell: When the Red candle is formed Sell call is initiated. close the Sell trades when the next blue candle will formed.   Happy trade!!
FREE
HMA Trend
Pavel Zamoshnikov
4.6 (67)
A trend indicator based on the Hull Moving Average (HMA) with two periods. The Hull Moving Average is an improved variant of the moving average, which shows the moment of trend reversal quite accurately. It is often used as a signal filter. Combination of two types of Hull Moving Averages makes a better use of these advantages: HMA with a slow period identifies the trend, while HMA with a fast period determines the short-term movements and signals in the trend direction. Features The movement
FREE
MTF Heiken Ashi MA is a multiple timeframe Heiken Ashi & Moving Average indicator. Fully customizable for advanced & unique Heiken Ashi & Moving Average calculations. Key Features Modified appearance and appeal from the traditional using only H eiken Ashi MA bodies. MTF Higher or lower timeframes available making this it great for trends and scalping. There are many settings that can be non-repaint for signals at a new bar and at bar 0. Inputs Timeframe  = PERIOD_CURRENT - timeframe of Movin
FREE
Extremum Reverse Bar
Yurij Izyumov
2.8 (5)
This indicator has been created for finding the probable reversal points of the symbol price. A small candlestick reversal pattern is used it its operation in conjunction with a filter of extremums. The indicator is not redrawn! If the extremum filter is disabled, the indicator shows all points that have a pattern. If the extremum filter is enabled, the condition works – if the history Previous bars 1 candles back contains higher candles and they are farther than the Previous bars 2 candle, such
FREE
Tipu Heikin Ashi Panel
Kaleem Haider
4.56 (18)
Tipu Heikin-Ashi Panel is the modified version of the original Heiken Ashi indicator published by MetaQuotes here . A professional version of this indicator is available here . Features An easy to use Panel that shows the Heiken Ashi trend of selected timeframe. Customizable Buy/Sell alerts, push alerts, email alerts, or visual on-screen alerts. Customizable Panel. The panel can be moved to any place on the chart or minimized to allow more space. Heikin means "the average", and Ashi means "foo
FREE
Velvet RVI
Kevin Peter Abate
Velvet RVI is intended for use with the Velvet advanced ordering layer.  It is based on the algorithm for the Relative Vigor Index, provided by Investopedia here . All of the data it displays is accurate and verified against the internal API function iRVI, when it is detected by the ordering layer.  In order to place orders with the Velvet RVI indicator, the ordering layer must be installed and running.  Ordering from the Velvet RVI indicator requires that "Velvet Ordering Layer" ( found here ),
FREE
(traduzione Google) Questo indicatore si basa sul " Time Segmented Volume (TSV)" originale sviluppato da Worden Brothers, Inc . Tuttavia, ho aggiunto alcune funzionalità in più a questo. Si può scegliere il prezzo da applicare, invece di avere solo il prezzo di chiusura predefinito utilizzato dall'originale. Si può anche scegliere quale ponderazione del volume utilizzare, incluso uno pseudo-volume basato sull'intervallo reale o nessuna ponderazione del volume. (Original text) This indicator is b
FREE
Wave Reversal Indicator - determines the direction of trend waves and price reversals. The indicator shows wave movements and trend directions. It gives recommendations where to follow the trader, helps to follow the trading strategy. It is an addition to an intraday or medium-term strategy. Almost all parameters are selected for each time frame and are changed automatically, the only parameter for manual adjustment is the wavelength. Works on various trading instruments and timeframes, rec
FREE
Ppr PA
Yury Emeliyanov
4.5 (2)
"Ppr PA" is a unique technical indicator created to identify "PPR" patterns on the currency charts of the MT4 trading platform. These patterns can indicate possible reversals or continuation of the trend, providing traders with valuable signals to enter the market. Features: Automatic PPR Detection:   The indicator automatically identifies and marks PPR patterns with arrows on the chart. Visual Signals:   Green and red arrows indicate the optimal points for buying and selling, respectively. A
FREE
Follow The Line
Oliver Gideon Amofa Appiah
4.07 (14)
FOLLOW THE LINE GET THE FULL VERSION HERE: https://www.mql5.com/en/market/product/36024 This indicator obeys the popular maxim that: "THE TREND IS YOUR FRIEND" It paints a GREEN line for BUY and also paints a RED line for SELL.  It gives alarms and alerts of all kinds. IT DOES NOT REPAINT and can be used for all currency pairs and timeframes. Yes, as easy and simple as that. Even a newbie can use it to make great and reliable trades. NB: For best results, get my other premium indicators for more
FREE
Traditional MACD MT4
Daniel Lewis
4.59 (56)
MACD indicator in MetaTrader 4/5 looks different than MACD does in most other charting software. That is because the MetaTrader 4/5 version of MACD displays the MACD line as a histogram when it is traditionally displayed as a line. Additionally, the MetaTrader 4/5 version computes the Signal line using an SMA, while according to MACD definition it is supposed to be an EMA. The MetaTrader 4/5 version also does not compute a true MACD Histogram (the difference between the MACD/Signal lines). This
FREE
The Crossing
Anton Iudakov
5 (2)
+ 2 bonus strategies! Alerts! I recommend watching my advisor -   Night Zen EA The indicator combines the most popular moving average strategies: Simple moving average crossover. Moving average crossover relative to the position of the slower moving average. 2 bonus strategies : The crossing of the fast moving average with the calculation of the opening prices of the slow moving average with the calculation of the closing prices taking into account the slower moving average. (The settings for th
FREE
Triple RSI
Pablo Leonardo Spata
1 (1)
LOOK AT THE FOLLOWING STRATEGY WITH THIS INDICATOR. Triple RSI is a tool that uses the classic Relative Strength Indicator, but in several timeframes to find market reversals.    1.  ️ Idea behind the indicator and its strategy: In Trading, be it Forex or any other asset, the ideal is to keep it simple, the simpler the better . The triple RSI strategy is one of the simple strategies that seek market returns. In our experience, where there is more money to always be won, is in the marke
FREE
RSI With Alert Relative strength index (RSI) indicator is a popular technical indicator in the family of oscillators. RSI oscillates between 0 and 100 and traders use it to spot overbought and oversold states in the market. Typically, a value above 70 means that the instrument is overbought and due to a retracement. A value below 30 means that the trading instrument is oversold. RSI indicator strategies This indicator allows you to get notifications when some conditions trigger. You c
FREE
Power Trend Free
Yurij Kozhevnikov
5 (2)
Power Trend Free - the indicator shows the trend strength in the selected period. Input Parameters The indicator has three input parameters: Period - a positive number greater than one, it shows the number of candlesticks used for calculations. If you enter one or zero, there will be no error, but the indicator will not be drawn. Applied Price - the standard "Apply to:" set meaning data used for the indicator calculation: Close - Close prices; Open - Open prices; High - High prices; Low - Low
FREE
MegaTrends
Sivakumar Subbaiya
1 (1)
Megatrends  Indicator   Time Frame: Suitable for any time frame.  Purpose: Trend Prediction. Blue and red color indicate the buy and sell call respectively. Buy: When the blue line is originating it is opened buy call. Sell: When the Red line is origination it is opened sell call Happy trade!! this indicator is suitable for all time frame, but our recommended time frame to use 1hour and 4 hours, suitable for any chart.
FREE
Heiken Ashi Button
Lee Teik Hong
4.67 (3)
Heiken Ashi Button Heiken-Ashi , often spelled Heikin-Ashi, is a Japanese word that means "Average Bar." The Heiken-Ashi approach can be used in conjunction with candlestick charts to spot market trends and forecast future prices. It's useful for making candlestick charts easier to read and analysing patterns. Traders can use Heiken-Ashi charts to determine when to stay in trades while the trend continues and close trades when the trend reverses. The majority of earnings are made when markets a
FREE
Rainbow MT4 is a technical indicator based on Moving average with period 34 and very easy to use. When price crosses above MA and MA changes color to green, it’s a signal to buy. When price crosses below MA and MA changes color to red, it’s a signal to sell. The Expert advisor ( Rainbow EA MT4) based on Rainbow MT4 indicator, as you can see in the short video below is now available here .
FREE
VR Donchian
Vladimir Pastushak
4.92 (13)
VR Donchian göstergesi, Donchian kanalının geliştirilmiş bir versiyonudur. İyileştirmeler kanalın neredeyse tüm işlevlerini etkiledi ancak ana işletim algoritması ve kanal yapısı korundu. Mevcut trende bağlı olarak top göstergesine seviyelerin renginde bir değişiklik eklendi - bu, yatırımcıya trendde veya yatayda bir değişiklik olduğunu açıkça gösterir. Yatırımcıyı akıllı telefon, e-posta veya MetaTrader terminalinde iki kanal seviyesinden birinin kırılması hakkında bilgilendirme yeteneği eklend
FREE
Trend Master Chart MT4
Frederic Jacques Collomb
Trend Master Chart ihtiyacınız olan trend göstergesidir. Grafiği kaplar ve farklı pazar trendlerini/hareketlerini tanımlamak için renk kodlamasını kullanır. İki hareketli ortalamayı ve farklı osilatörleri birleştiren bir algoritma kullanır. Bu üç elementin periyotları değiştirilebilir. Herhangi bir zaman diliminde ve herhangi bir Çiftte çalışır. Bir bakışta yükseliş veya düşüş trendini ve bu trende farklı giriş noktalarını tespit edebileceksiniz. Örneğin, belirgin bir yükseliş eğilimi sırasın
The BB Arrows MTF indicator is based on the Bollinger Bands indicator. Represents input signals in the form of arrows. All signals are generated on the current bar. In 2 modes, Signals are not redrawn (Exception of very sharp jumps)! All signals in MTF mode correspond to signals of the period specified in MTF. It is maximally simplified to use both for trading with only one indicator and for using the indicator as part of your trading systems. A feature of the indicator is that the indicator ti
FREE
Bu ürünün alıcıları ayrıca şunları da satın alıyor
Gann Made Easy
Oleg Rodin
4.85 (81)
Gann Made Easy , bay teorisini kullanarak ticaretin en iyi ilkelerine dayanan, profesyonel ve kullanımı kolay bir Forex ticaret sistemidir. WD Gann. Gösterge, Zararı Durdur ve Kâr Al Seviyeleri dahil olmak üzere doğru SATIN AL ve SAT sinyalleri sağlar. PUSH bildirimlerini kullanarak hareket halindeyken bile işlem yapabilirsiniz. Lütfen satın aldıktan sonra benimle iletişime geçin! Alım satım ipuçlarımı ve harika bonus göstergelerini ücretsiz olarak sizinle paylaşacağım! Muhtemelen Gann ticaret y
TPSpro RFI Levels
Roman Podpora
4.82 (22)
Reversal First Impulse levels (RFI)    INSTRUCTIONS        RUS       -       ENG              R ecommended to use with an indicator   -   TPSpro  TREND PRO -  Version MT5 A key element in trading is zones or levels from which decisions to buy or sell a trading instrument are made. Despite attempts by major players to conceal their presence in the market, they inevitably leave traces. Our task was to learn how to identify these traces and interpret them correctly. Main functions: Displaying activ
Atomic Analyst
Issam Kassas
5 (2)
Öncelikle belirtmek gerekir ki bu Ticaret Göstergesi Yeniden Çizim Yapmaz, Gecikmez ve Gecikme Göstermez, bu da hem manuel hem de robot ticareti için ideal hale getirir. Kullanıcı kılavuzu: ayarlar, girişler ve strateji. Atom Analisti, Piyasada Daha İyi Bir Avantaj Bulmak İçin Fiyatın Gücünü ve Momentumunu Kullanan PA Fiyat Hareketi Göstergesidir. Gürültüleri ve Yanlış Sinyalleri Kaldırmaya ve Ticaret Potansiyelini Artırmaya Yardımcı Olan Gelişmiş Filtrelerle Donatılmıştır. Birden fazla katma
Gold Stuff
Vasiliy Strukov
4.89 (238)
Gold Stuff, özellikle altın için tasarlanmış bir trend göstergesidir ve herhangi bir finansal enstrümanda da kullanılabilir. Gösterge yeniden çizilmez ve gecikmez. Önerilen zaman dilimi H1. Bu göstergede tam otomatik Uzman Danışman EA Gold Stuff çalışır. Profilimde bulabilirsiniz. Ayarları ve kişisel bir bonusu almak için satın alma işleminden hemen sonra benimle iletişime geçin!  Güçlü Destek ve Trend Tarayıcı göstergemizin ücretsiz bir kopyasını pm'den alabilirsiniz. Ben! AYARLAR Ok Ç
Trend Punch
Mohamed Hassan
4.95 (19)
This indicator is unstoppable when combined with our other indicator called  Support & Resistance . After purchase, send us a message and you will get it   for  FREE as a BONUS! Introducing Trend Punch , the revolutionary forex trend indicator that will transform the way you trade! Trend Punch is uniquely designed to provide precise buy and sell arrows during strong market trends, making your trading decisions clearer and more confident. Whether you're trading major currency pairs or exotic sym
Scalper Inside PRO
Alexey Minkov
4.73 (56)
An exclusive indicator that utilizes an innovative algorithm to swiftly and accurately determine the market trend. The indicator automatically calculates opening, closing, and profit levels, providing detailed trading statistics. With these features, you can choose the most appropriate trading instrument for the current market conditions. Additionally, you can easily integrate your own arrow indicators into Scalper Inside Pro to quickly evaluate their statistics and profitability. Scalper Inside
TPSproTREND PrO
Roman Podpora
4.79 (19)
TPSpro TREND PRO,   piyasayı otomatik olarak analiz eden, trend ve değişimlerinin her biri hakkında bilgi sağlayan, ayrıca yeniden çizmeden işlemlere girme sinyalleri veren bir trend göstergesidir! Gösterge her mumu ayrı ayrı analiz ederek kullanır. farklı dürtülere atıfta bulunur - yukarı veya aşağı dürtü. Para birimleri, kripto paralar, metaller, hisse senetleri ve endeksler için işlemlere tam giriş noktaları! Sürüm MT5                   GÖSTERGENİN TAM AÇIKLAMASI       Bunu -   RFI SEVİYELER
FX Power MT4 NG
Daniel Stein
5 (12)
Sabah Brifingimiz burada mql5 ve on Telegram! FX Power MT4 NG , uzun zamandır çok popüler olan döviz gücü ölçerimiz FX Power'ın yeni neslidir. Peki bu yeni nesil güç ölçer ne sunuyor? Orijinal FX Power hakkında sevdiğiniz her şey PLUS GOLD/XAU güç analizi Daha da hassas hesaplama sonuçları Ayrı ayrı yapılandırılabilir analiz dönemleri Daha da iyi performans için özelleştirilebilir hesaplama limiti Özel çokluDaha fazlasını görmek isteyenler için örnek ayarlar Her grafikte en sevdiğiniz renkler i
Şu anda %20 İNDİRİMLİ! Herhangi bir Acemi veya Uzman Tüccar için En İyi Çözüm! Bu gösterge paneli yazılımı 28 döviz çifti üzerinde çalışıyor. Ana göstergelerimizden 2'sine (Gelişmiş Para Birimi Gücü 28 ve Gelişmiş Para Birimi Dürtüsü) dayanmaktadır. Tüm Forex piyasasına harika bir genel bakış sağlar. Gelişmiş Para Birimi Gücü değerlerini, para birimi hareket hızını ve tüm (9) zaman dilimlerinde 28 Forex çifti için sinyalleri gösterir. Trendleri ve / veya scalping fırsatlarını belirlemek içi
Chart Patterns All-in-One göstergesi, traderların teknik analizde yaygın olarak kullanılan çeşitli grafik desenlerini görselleştirmelerine yardımcı olur. Bu gösterge, potansiyel piyasa hareketlerini belirlemeye yardımcı olur ancak kârlılığı garanti etmez. Satın almadan önce göstergeyi demo modunda test etmeniz önerilir. Mevcut Teklif : "Chart Patterns All in One" göstergesinde %50 indirim. Dahil Edilen Desenler : 1-2-3 Deseni : Üç önemli nokta (yüksekler veya düşükler) kullanarak piyasa tersine
Trend Screener
STE S.S.COMPANY
4.8 (87)
Trend Göstergesi, Trend Alım Satım ve Filtreleme için Çığır Açan Benzersiz Çözüm, Tüm Önemli Trend Özellikleriyle Tek Bir Araç İçinde Yerleştirildi! Forex, emtialar, kripto para birimleri, endeksler ve hisse senetleri gibi tüm sembollerde/araçlarda kullanılabilen %100 yeniden boyamayan çoklu zaman çerçevesi ve Çoklu para birimi göstergesidir. SINIRLI SÜRELİ TEKLİF: Destek ve Direnç Tarama Göstergesi sadece 50$ ve ömür boyu mevcuttur. (Orijinal fiyat 250$) (teklif uzatıldı) Trend Screener, grafik
FX Volume
Daniel Stein
4.58 (33)
Sabah Brifingimiz aracılığıyla ayrıntılar ve ekran görüntüleri ile günlük piyasa güncellemenizi alın burada mql5 ve on Telegram ! FX Volume, bir brokerin bakış açısından piyasa duyarlılığı hakkında GERÇEK bir fikir veren İLK ve TEK hacim göstergesidir. COT raporlarından çok daha hızlı bir şekilde, brokerlar gibi kurumsal piyasa katılımcılarının Forex piyasasında nasıl konumlandıklarına dair harika bilgiler sağlar. Bu bilgileri doğrudan grafiğinizde görmek, ticaretiniz için gerçek oyun değiştir
- Real price is 80$ - 40% Discount ( It is 49$ now ) Contact me for instruction, add group and any questions! Related EA Product: Bitcoin Expert Introduction The breakout and retest strategy is traded support and resistance levels. it involves price breaking through a previous level.  The break and retest strategy is designed to help traders do two main things, the first is to avoid false breakouts. Many false breakouts start with a candlestick that breaks out of a level but ends with an immedi
ŞU ANDA %31 INDIRIMLI !!! Yeni Başlayanlar veya Uzman Tüccarlar için En İyi Çözüm! Bu gösterge benzersiz, yüksek kaliteli ve uygun fiyatlı bir ticaret aracıdır çünkü bir dizi tescilli özellik ve gizli bir formül ekledik. Yalnızca BİR grafikle 28 döviz çiftinin tümü için Uyarılar verir. Yeni bir trendin veya scalping fırsatının tam tetik noktasını belirleyebildiğiniz için ticaretinizin nasıl gelişeceğini hayal edin! Yeni temel algoritmalar üzerine inşa edilen bu sistem, potansiyel işlemler
Enigmera
Ivan Stefanov
5 (3)
ENIGMERA: Pazarın çekirdeği https://www.enigmera.com Giriş Bu gösterge ve ticaret sistemi, finansal piyasalar için dikkate değer bir yaklaşımdır. ENIGMERA, destek ve direnç seviyelerini doğru bir şekilde hesaplamak için fraktal döngüleri kullanır. Gerçek birikim aşamasını gösterir ve yön ve hedefler verir.  İster bir trendde ister bir düzeltmede olalım çalışan bir sistem.  Nasıl çalışır? ENIGMERA üç çizgiden oluşur: destek/direnç çizgisi, hedef çizgisi ve sapma çizgisi. Sistem, geçmiş veril
Trend Cutter
Oleg Rodin
5 (2)
Trend Cutter, M1 ve M5 gibi daha düşük zaman dilimleri de dahil olmak üzere herhangi bir zaman diliminde kullanılabilen bir trend göstergesidir. Gösterge, gün içi ticareti tercih eden yatırımcılar için idealdir ve uzun vadeli ticareti tercih edenlere de yardımcı olacaktır. Bu göstergeyi ticaret sisteminiz için bir temel olarak veya bağımsız bir ticaret çözümü olarak kullanabilirsiniz. Gösterge, PUSH bildirimleri de dahil olmak üzere her türlü uyarıyı sağlar. Göstergenin kullanımı çok kolaydır. S
PRO Renko Sistemi, RENKO grafikleri ticareti için özel olarak tasarlanmış son derece hassas bir ticaret sistemidir. Bu, çeşitli ticaret araçlarına uygulanabilen evrensel bir sistemdir. Sistemi etkin piyasa sana doğru ters sinyallerine erişim hakkı denilen ses nötralize eder. Göstergenin kullanımı çok kolaydır ve sinyal üretiminden sorumlu tek bir parametreye sahiptir. Aracı, seçtiğiniz herhangi bir ticaret aracına ve renko çubuğunun boyutuna kolayca uyarlayabilirsiniz. Yazılımımla karlı b
ŞU ANDA %26 INDIRIMLI Yeni Başlayanlar veya Uzman Tüccarlar için En İyi Çözüm! Bu Gösterge benzersiz, yüksek kaliteli ve uygun fiyatlı bir ticaret aracıdır çünkü bir dizi tescilli özellik ve yeni bir formül ekledik. Sadece BİR grafik ile 28 Forex çifti için Döviz Gücünü okuyabilirsiniz! Yeni bir trendin veya scalping fırsatının tam tetik noktasını belirleyebildiğiniz için ticaretinizin nasıl gelişeceğini hayal edin? Kullanım kılavuzu: buraya tıklayın Bu ilk olan, orijinal! Değersiz bir
Fiyat tersine döndükçe ve geri çekildikçe piyasa yapısından elde edilen kâr değişir. Piyasa yapısını tersine çevirme uyarısı göstergesi, bir trendin veya fiyat hareketinin ne zaman tükenmeye yaklaştığını ve tersine dönmeye hazır olduğunu tanımlar. Genellikle bir geri dönüş veya büyük bir geri çekilme meydana gelmek üzereyken meydana gelen piyasa yapısındaki değişiklikler konusunda sizi uyarır. Gösterge, olası bir tükenme noktasının yakınında her yeni yüksek veya düşük oluştuğunda, başlangıçta
TakePropips Donchian Trend Pro
Eric John Pajarillaga Aldana
4.44 (16)
TakePropips Donchian Trend Pro   (MT4), Donchian Kanalı'nı kullanarak trendin yönünü otomatik olarak tespit eden ve size ticarete giriş ve çıkış sinyalleri sağlayan güçlü ve etkili bir araçtır! Bu çok işlevli gösterge, bir trend tarayıcı, ticaret sinyalleri, istatistiksel panel, tarayıcı, ticaret oturumları ve uyarı geçmişi panosu içerir. Size ticaret sinyalleri sağlamak ve çizelgeleri analiz ederek saatlerce tasarruf etmenizi sağlamak için tasarlanmıştır! Kullanım kılavuzunu ve kurulum kılavuzu
Grafiğinizde otomatik olarak destek ve direnç seviyeleri PLUS itici mum boşlukları çizin, böylece fiyatın nereye gidebileceğini ve / veya potansiyel olarak tersine dönebileceğini görebilirsiniz. Bu gösterge, web sitemde (The Market Structure Trader) öğretilen pozisyon ticareti metodolojisinin bir parçası olarak kullanılmak üzere tasarlanmıştır ve hedefleme ve potansiyel girişler için temel bilgileri görüntüler. Göstergede 2 TEMEL özellik ve 4 ek özellik bulunmaktadır: TEMEL ÖZELLİK 1 - Günl
Currency Strength Wizard , başarılı ticaret için size hepsi bir arada çözüm sağlayan çok güçlü bir göstergedir. Gösterge, birden çok zaman dilimindeki tüm para birimlerinin verilerini kullanarak şu veya bu forex çiftinin gücünü hesaplar. Bu veriler, şu veya bu para biriminin gücünü görmek için kullanabileceğiniz, kullanımı kolay para birimi endeksi ve para birimi güç hatları biçiminde temsil edilir. İhtiyacınız olan tek şey, işlem yapmak istediğiniz tabloya göstergeyi eklemektir ve gösterge size
IX Power MT4
Daniel Stein
5 (5)
IX Power nihayet FX Power'ın rakipsiz hassasiyetini Forex dışı sembollere getiriyor. En sevdiğiniz endeksler, hisse senetleri, emtialar, ETF'ler ve hatta kripto para birimlerindeki kısa, orta ve uzun vadeli eğilimlerin yoğunluğunu doğru bir şekilde belirler. Terminalinizin sunduğu her şeyi analiz edebilirsiniz. Deneyin ve işlem yaparken zamanlamanızın nasıl önemli ölçüde iyileştiğini deneyimleyin. IX Power Temel Özellikler 100 hassas, yeniden boyanmayan hesaplama sonuçları - terminalini
ADR Ters Çevirme Göstergesi, normal ortalama günlük aralığına göre fiyatın şu anda nerede işlem gördüğünü bir bakışta size gösterir. Fiyat, ortalama aralığı ve seçtiğiniz seviyenin üzerindeki seviyeleri aştığında, açılır pencere, e-posta veya push yoluyla anında uyarılar alacaksınız, böylece hızlı bir şekilde geri çekilmelere ve geri dönüşlere atlayabilirsiniz. Gösterge, grafikte ortalama günlük aralık uç noktalarında yatay çizgiler ve ayrıca fiyatları aşan matematiksel olasılıkları olan seviye
Trend Pulse
Mohamed Hassan
5 (4)
Please contact me after purchase to immediately get your PDF strategy + documentation for Trend Pulse !  Introducing Trend Pulse , a unique and robust indicator capable of detecting bullish, bearish, and even ranging trends! Trend Pulse uses a special algorithm to filter out market noise with real precision. If the current symbol is moving sideways, Trend Pulse will send you a ranging signal, letting you know that it's not a good time to enter a trade. This excellent system makes Trend Pulse
RSI / TDI uyarı panosu, ticaret yaptığınız her büyük çiftte RSI'leri (sizin tarafınızdan seçilebilir) bir kerede izlemenize olanak tanır. İki şekilde kullanabilirsiniz: 1. Birden fazla zaman çerçevesi seçin ve çizgi, normal ticaret koşullarının ötesine geçen birden fazla zaman çerçevesi olduğunda size gösterecektir. Birden fazla zaman diliminde aşırı alım veya aşırı satım seviyesine ulaştığı için fiyatın son zamanlarda sert bir şekilde yükseldiğinin harika bir göstergesi, bu nedenle yakın
Stratos Pali Indicator   is a revolutionary tool designed to enhance your trading strategy by accurately identifying market trends. This sophisticated indicator uses a unique algorithm to generate a complete histogram, which records when the trend is Long or Short. When a trend reversal occurs, an arrow appears, indicating the new direction of the trend. Important Information Revealed Leave a review and contact me via mql5 message to receive My Top 5 set files for Stratos Pali at no cost! D
Gold Channel is a volatility-based indicator, developed with a specific timing algorithm for the XAUUSD pair, which consists of finding possible corrections in the market. This indicator shows two outer lines, an inner line (retracement line) and an arrow sign, where the theory of the channel is to help identify overbought and oversold conditions in the market. The market price will generally fall between the boundaries of the channel. If prices touch or move outside the channel it is a tra
M1 Arrow
Oleg Rodin
4.73 (15)
Piyasanın iki temel ilkesine dayanan bir gün içi stratejisi. Algoritma, ek filtreler kullanarak hacimlerin ve fiyat dalgalarının analizine dayanmaktadır. Göstergenin akıllı algoritması, yalnızca iki piyasa faktörü bir araya geldiğinde bir sinyal verir. Gösterge, daha yüksek zaman çerçevesinin verilerini kullanarak M1 grafiğinde belirli bir aralıktaki dalgaları hesaplar. Ve dalgayı doğrulamak için gösterge, hacme göre analizi kullanır. Bu gösterge hazır bir ticaret sistemidir. Bir tüccarın ihtiya
Bomb Bank Signal
Igor Pereira Calil
5 (1)
Bomb Bank Signal: Your Trusted Indicator for MetaTrader 4 The Bomb Bank Signal is a powerful indicator for MetaTrader 4, designed to identify the most relevant trends in the financial market. If you are looking for a tool that accurately anticipates movements, Bomb Bank is the ally you need. How it Works: This indicator combines three distinct methods – volume analysis, candle closes and symmetrical trend – to detect and signal buying and selling opportunities. Bomb Bank is like a "bomb"
Yazarın diğer ürünleri
Donchian channels are a tool in technical analysis used to determine the relative volatility of a market and the potential for price breakouts. Can help identify potential breakouts and reversals in price, which are the moments when traders are called on to make strategic decisions. These strategies can help you capitalize on price trends while having pre-defined entry and exit points to secure gains or limit losses. Using the Donchian channel can thus be part of a disciplined approach to manag
FREE
Dow trend bands
Mariusz Piotr Rodacki
This indicator is not only for trading but also for learning, thanks to it, you can learn to identify trend, support and resistance. You've probably heard about the Dow trend theory, where higher highs and higher lows indicate an uptrend, and lower highs and lower lows indicate a downtrend. This indicator determines this trend based on the Dow Theory. You just need to enter a number representing the number of candles between extremes. The optimal solution is the number 3 (H1 TF), unless you
FREE
Trend Edges
Mariusz Piotr Rodacki
The "Trend Edges" indicator determines whether the trend is rising or falling. It is suitable for any time frame (tested on DAX). The indicator should be treated like Bollinger Bands, meaning that if it breaks out upwards, you can buy with a stop loss below the lower edge. Find a trending pair, index or CFD. Additionally : -Sound alert on trend change. -Alert Notification -Alert Notification on your mobile phone Check my other indicator "Trend Edges histogram"
FREE
Comfort zone signal
Mariusz Piotr Rodacki
The " Comfort Zone Signal " indicator identifies a daily zone that, when broken, has a high probability of the market continuing the established trend . Upon signal, the indicator calculates stop loss and take profit, which can be set by you. You can also set the trend. If the price is above the MA, it looks only for long positions, if below, it looks only for short positions. You can choose to ignore the moving average and display all signals. Additionally, you have the risk percentage d
FREE
This indicator is a histogram showing the trend based on 3 different moving averages. When all averages are set in ascending order, the indicator is green, and when in descending order, it is red. If the averages do not show a trend, the color is yellow. Additionally, each average can have different settings, such as Mode MA and Price MA. You can also set an alert and receive notifications on your phone. To enable the alert and push notification, you need to activate them first in the MT4 setti
FREE
This indicator is an addition to "Trend Edges." The "Trend Edges histogram" indicator determines whether the trend is rising or falling. It is suitable for any time frame (tested on DAX). Find a trending pair, index or CFD. Additionally : -Sound alert on trend change. -Alert Notification -Alert Notification on your mobile phone Check my other indicators.
FREE
MA Search 3
Mariusz Piotr Rodacki
This indicator allows you to overlay three different moving averages on the chart simultaneously. Each of these moving averages has additional settings such as: -Time frame -Shift -MA method -Applied price Using this indicator, you can easily set up three moving averages and find the one that suits you the best. You can also use this indicator to determine the trend when the moving averages cross.
FREE
Kombajn Signal
Mariusz Piotr Rodacki
The indicator still has a few bugs but is ready for testing. This is my first indicator that determines entry and exit points. The entry point is based on breaking the peaks determined by a channel indicating highs and lows (invisible channels). TP1 is a probable target at which most positions can be closed. The channel determining the opening and closing of positions is based on different assumptions. The red stop loss line is determined based on lows and highs. The stop loss can be adjusted
FREE
The Cossover MA Histogram indicator is a simple tool showing the trend based on crossover of moving averages. Simply specify two mobving averages and addicional parameters like MA method and Applied price. When fast MA is above slow MA the histogram is green, indicating an uptrend. When MA fast is below MA slow the histogram is red, indicating an downtrend.
FREE
Filtrele:
İnceleme yok
İncelemeye yanıt
Sürüm 2.0 2024.01.01
Additionally :
-Sound alert on trend change.
-Alert Notification
-Alert Notification on your mobile phone