Resistances Supports and Direction
- Göstergeler
- Alberto Caselli
- Sürüm: 1.1
- Güncellendi: 1 Aralık 2023
- Etkinleştirmeler: 10
DIRENÇLERIN VE DESTEKLERIN GÜCÜNÜ ÖLÇER
RSD göstergesi - Direnç, Destekler ve Yön - uzman tüccarın operasyonel aracıdır.
Gerçekten fark yaratan göstergedir.-
Her tür ticaret için vazgeçilmez bir göstergedir
-
her zaman diliminde mükemmel çalışır
-
dirençlerin ve desteklerin hesaplanacağı mum sayısını girdi olarak alır
-
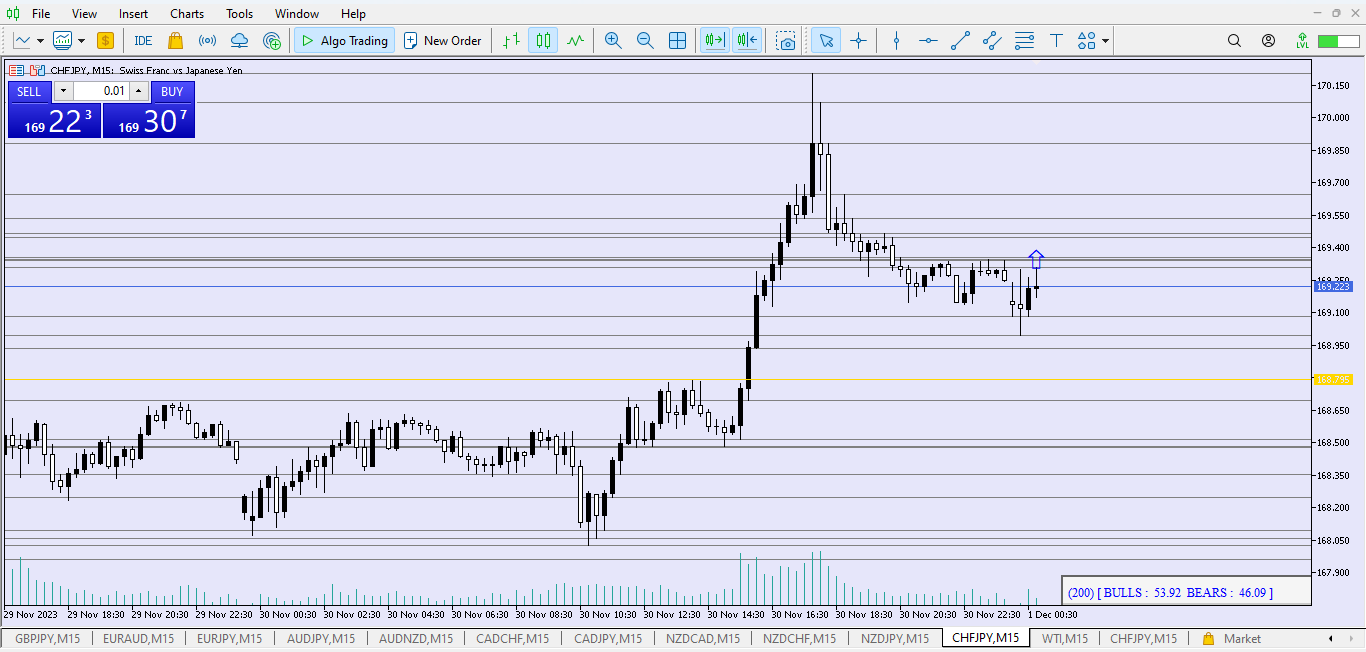
dirençler ve destekler çizer: çizgiler ne kadar yakın ve kalınsa, dirençler ve destekler o kadar güçlüdür
-
"merkez" çizgisini, en yüksek direnç ile en düşük destek arasındaki ortalama fiyat çizgisi olarak çizer ve hesaplanan dönem için piyasanın ağırlık merkezini gösterir
-
ayrıca girdi olarak Piyasa Duyarlılığının hesaplanacağı mum sayısını alır ve ardından kazanan yükseliş baskısını belirtmek için yeşil bir yukarı ok ve kazanan düşüş baskısını belirtmek için kırmızı bir aşağı ok çizer
-
grafiğin sağ alt köşesindeki bir etikette seçilen mum sayısı (Duyarlılık) için yükseliş baskısının yüzdesini ve düşüş baskısının yüzdesini görüntüler.
Deneyimli tüccarlar tarafından kullanılan RSD - Direnç Destekleri ve Yön göstergesi, gerçekten fark yaratan göstergedir.