Extremum levels
- Göstergeler
- VLADISLAV AKINDINOV
- Sürüm: 2.0
- Güncellendi: 12 Ocak 2024
- Etkinleştirmeler: 5
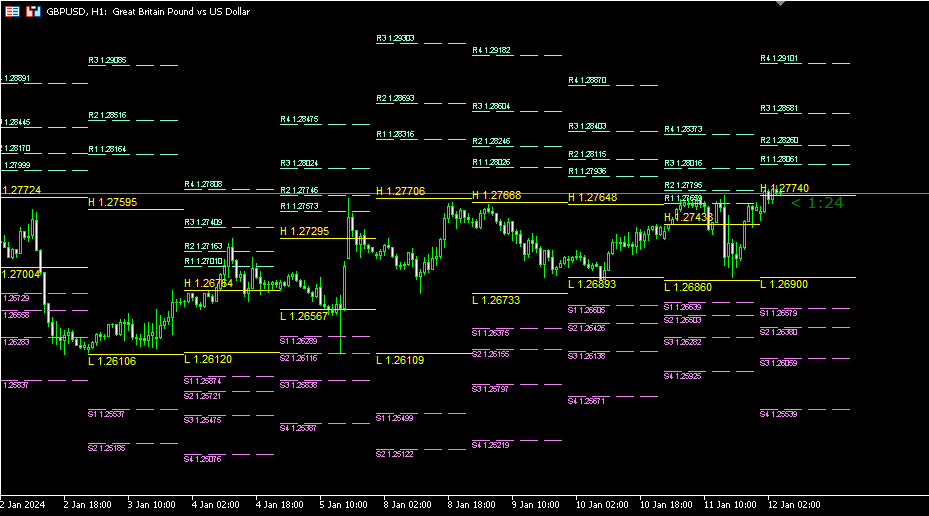
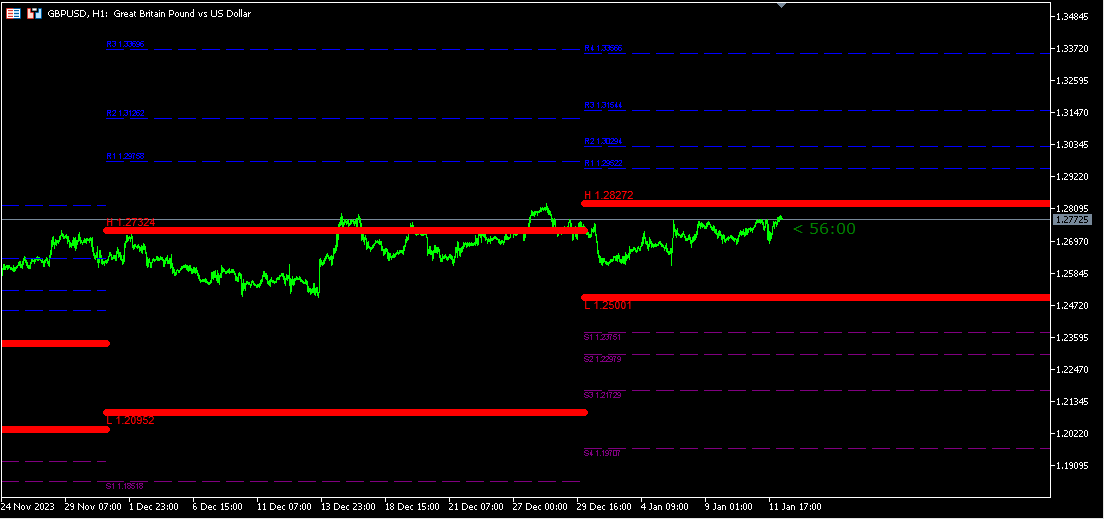
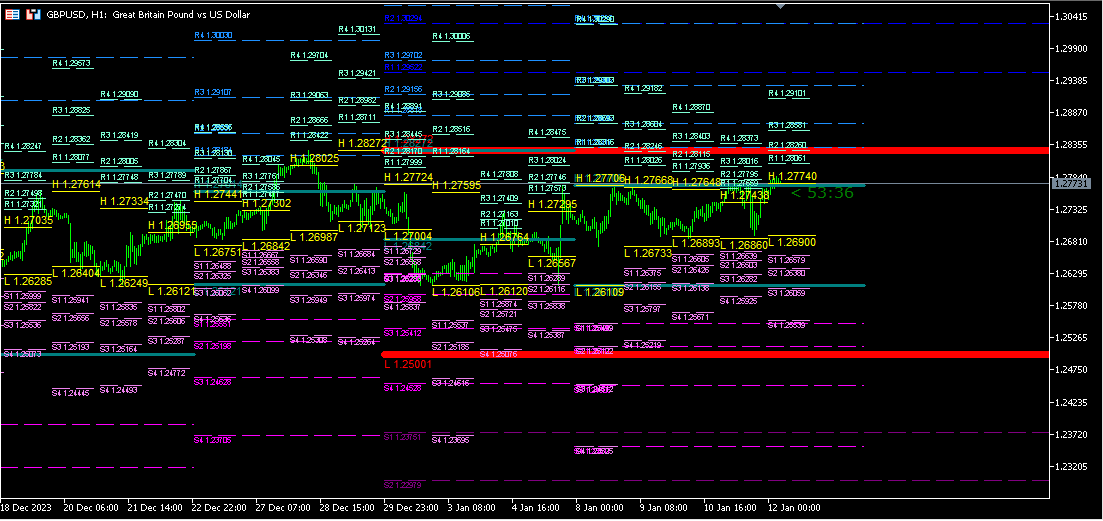
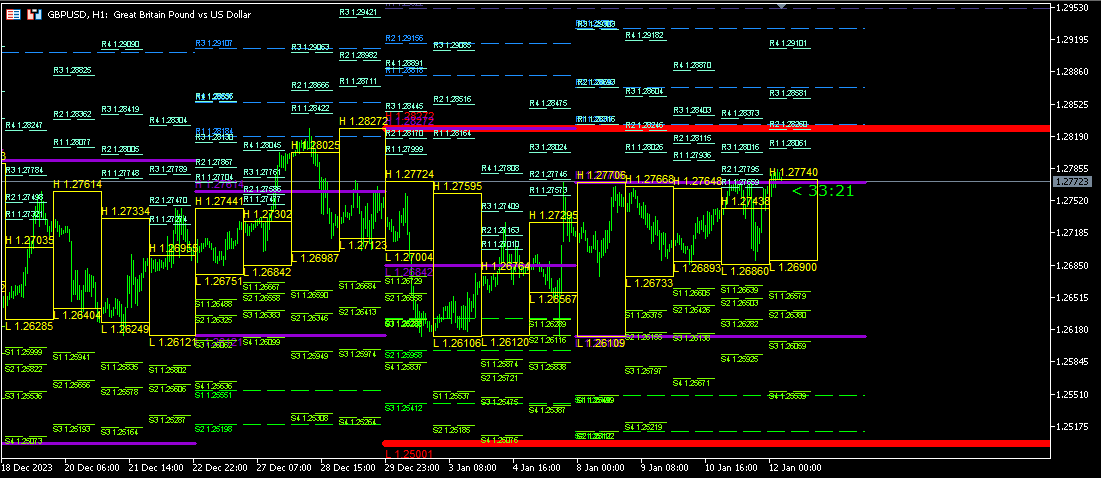
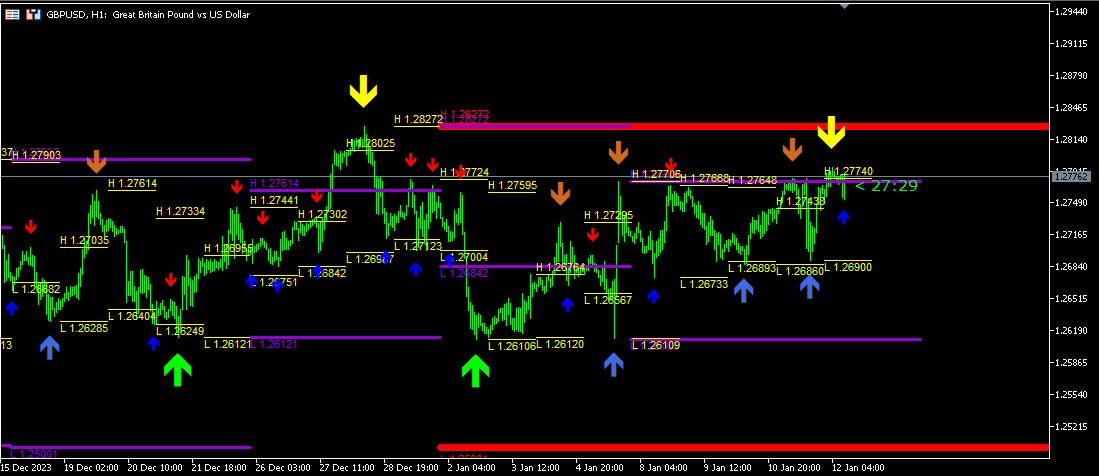
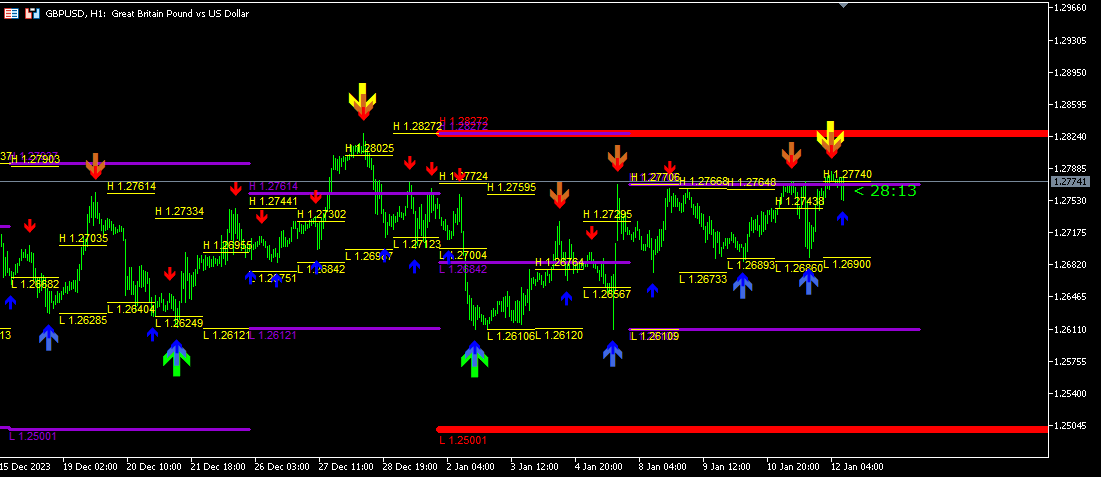
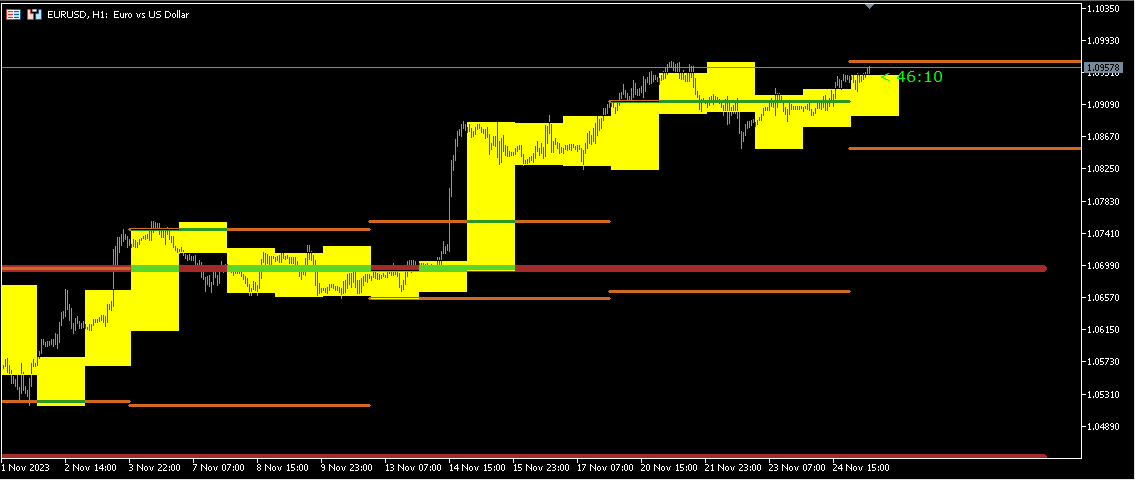
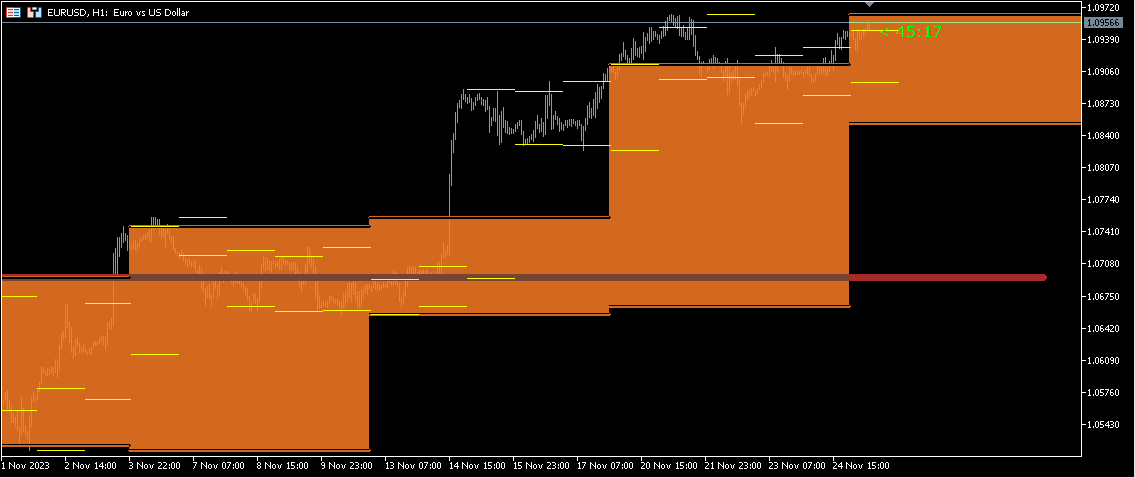
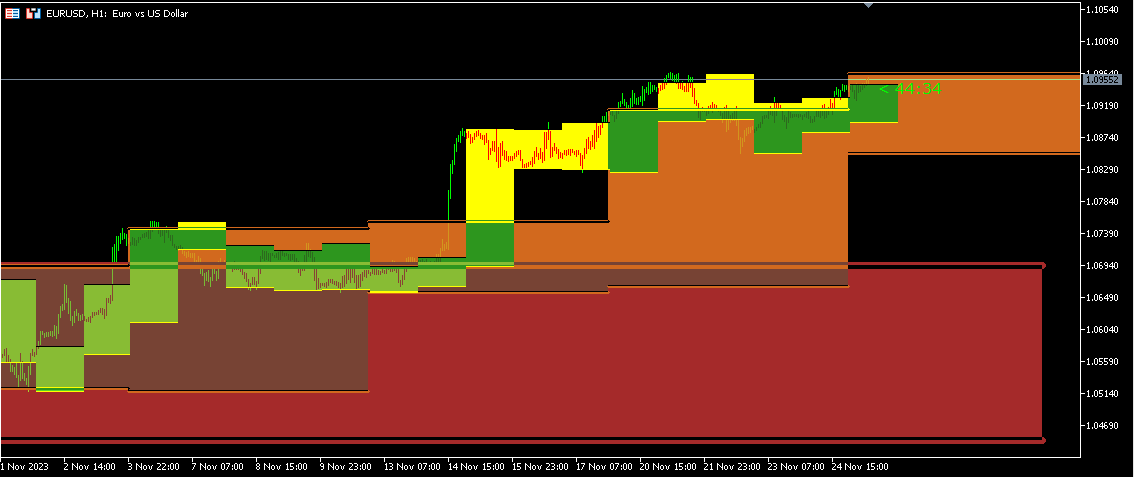
Bu gösterge bir önceki günün, haftanın ve ayın maksimum ve minimum fiyatlarını gösterir. Aşırı noktaların kırılmalarını tespit etmek ve bir ticarete giriş yönünü belirlemek için tasarlanmıştır. Geri dönüş seviyelerini daha doğru belirlemek için Fibonacci seviyelerini görüntüleyebilirsiniz. Önceki fatura dönemindeki fiyat hareketini daha net göstermek için yüksek ve düşük fiyatlar arasındaki alanda da çizilebilir. Mevcut mumun (çubuğun) kapanmasına kadar geçen süreyi gösterir.
Sürüm 2.0, 3 yeni zikzak ters sinyal seviyesi ekler ve her seviye için alarm sağlar.