• Genel bakış
  • İncelemeler (2)
  • Yorumlar
  • Yenilikler

Big Player Range

5

"BigPlayerRange"ın Gücünü Keşfedin: Pazar Teknik Analizinde Sizin Müttefikiniz 📈🔍

BigPlayerRange'ı tanıtıyoruz, piyasalarda kurumsal yatırımcıların ilgi alanlarını ortaya çıkaran gelişmiş bir teknik analiz aracıdır. Bu araç sayesinde, büyük oyuncuların aktif olduğu alanları hassas bir şekilde belirleyebilir ve bunun ticaret stratejilerinizi nasıl etkileyebileceğini anlayabilirsiniz.

Ana Özellikler:

  • Kurumsal İlgi Alanlarının Haritalanması 📊: BigPlayerRange, kurumsal yatırımcıların yüksek etkinlik gösterdiği bölgeleri vurgular ve potansiyel piyasa hareketleri hakkında değerli bilgiler sunar.

  • Çıkış Referansları İçin Tahminler 🎯: Göstergeler, iki aşamada olası çıkış noktalarını önererek, fiyatların gelecekteki yönlerine dayalı stratejiler planlamanıza yardımcı olur.

  • Geri Dönüş Olasılığı 🔄: Fiyatın belirlenen bölgeye geri döndüğünde geri dönüş olasılığını değerlendirir. Bu özellik, risk yönetimi ve strateji ayarlamaları için faydalıdır.

BigPlayerRange Nasıl Kullanılır:

  1. İlgi Alanlarının Belirlenmesi 📍: Göstergeleri kullanarak, kurumsal yatırımcıların yüksek faaliyet gösterdiği bölgeleri belirleyin, bu da önemli piyasa hareketlerini tahmin etmek için gereklidir.

  2. Çıkış İçin Tahminler 🏁: Çıkış kararlarınızı göstergenin sağladığı tahminlere dayandırarak, pozisyonlarınızı kapatırken stratejik bir yaklaşım benimseyin.

  3. Geri Dönüş Olasılığının Değerlendirilmesi 📉: Fiyatın ilgi alanına geri dönme olasılığını izleyin ve stratejilerinizi buna göre ayarlayın.

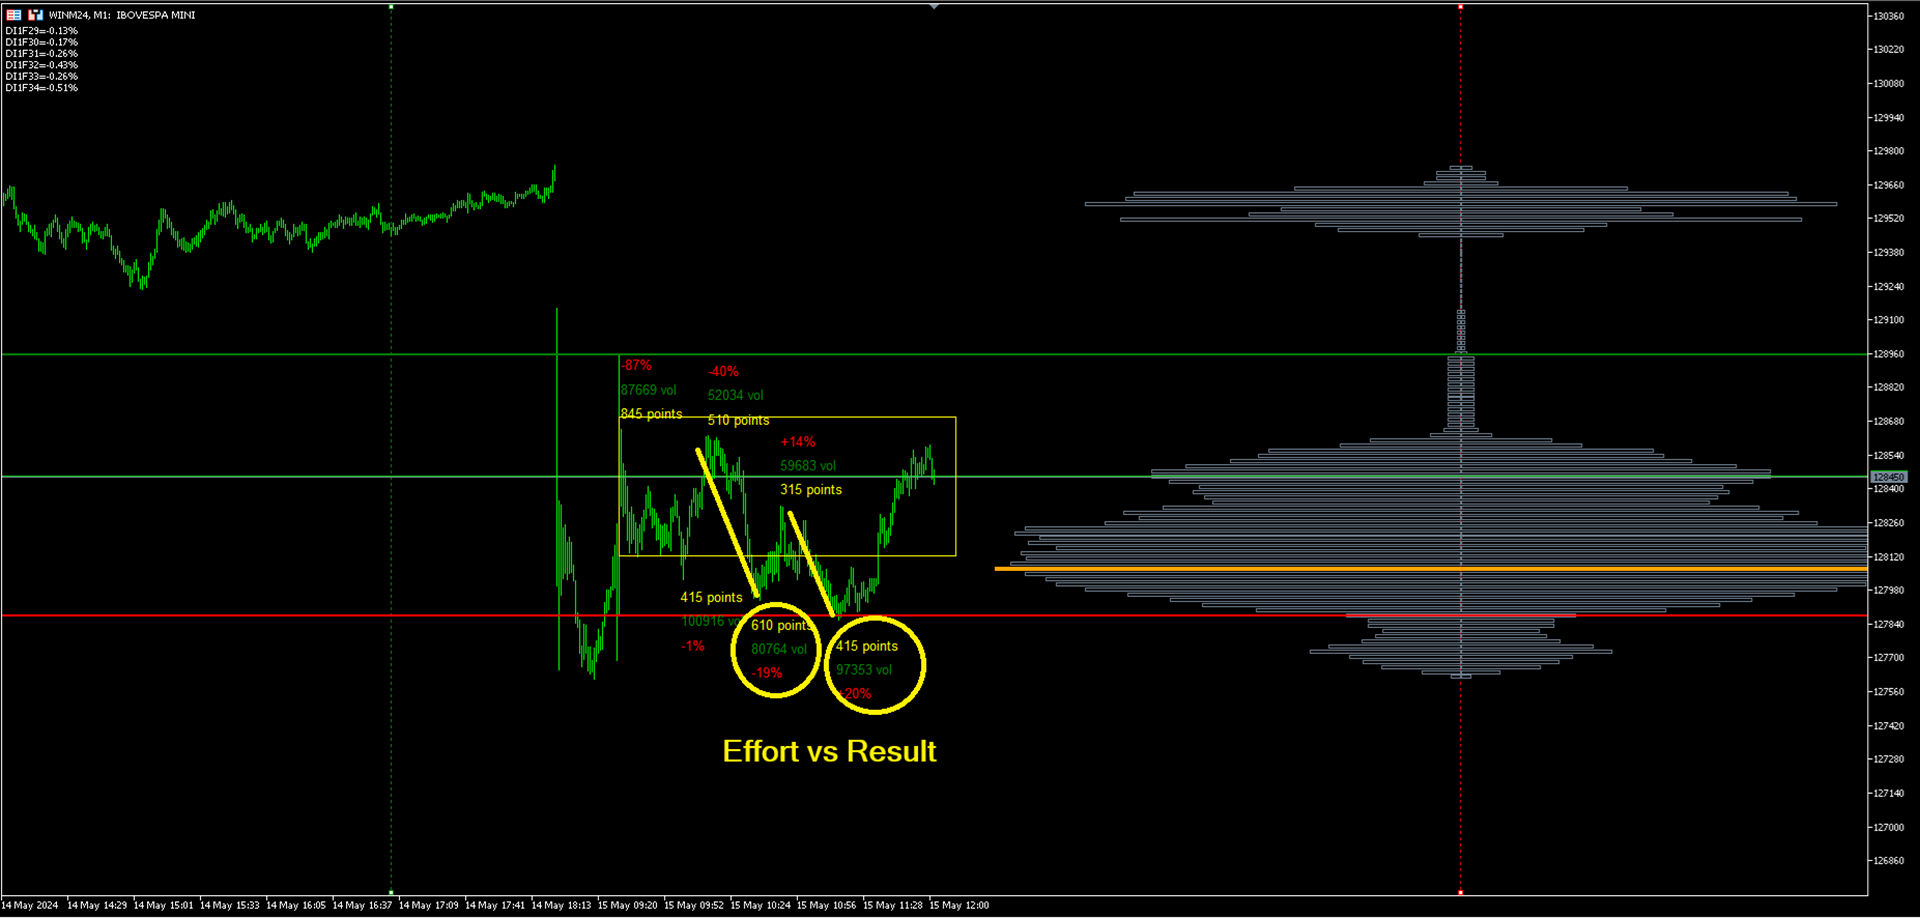
Ana Tetikleyici: Fiyatın Yeşil ve Kırmızı Çizgilere Göre İzlenmesi 🔍

BigPlayerRange kullanırken, dikkat edilmesi gereken ana nokta, fiyatın merkezi dikdörtgenin üzerindeki yeşil ve kırmızı çizgilerin üzerinde veya altında kapanmasıdır. Bu bölge kritik öneme sahiptir çünkü büyük bir kurumsal enerji barındırır. Bu bilgileri nasıl kullanacağınız aşağıda açıklanmıştır:

  • Yeşil Çizginin Üzerinde Kapanış 📈: Fiyat yeşil çizginin üzerinde kapanırsa, bu güçlü bir alım baskısı ve potansiyel bir yükseliş hareketi anlamına gelebilir.

  • Kırmızı Çizginin Altında Kapanış 📉: Fiyat kırmızı çizginin altında kapanırsa, bu güçlü bir satım baskısı ve potansiyel bir düşüş hareketi anlamına gelebilir.

Giriş Onayı ve Çıkışlar 🎯

Girişleri doğrulamak için Swing Volume ve Profile kombinasyonunu, ayrıca BigPlayerRange'ın ek analizini dikkate alın. Bu ek araçlar sinyalleri doğrulamanıza ve daha bilgilendirilmiş kararlar almanıza yardımcı olur.

  • Çıkışlar: Çıkış referansı olarak her zaman Targets 1 ve 2'yi kullanın. Göstergenin sağladığı tahminler ve analizlere dayanarak yapılandırılmış ve stratejik bir yaklaşım benimseyin.

Analizi Ayarlama ve Kişiselleştirme:

  • Saat ve İşlem Hacmi Türü Seçimi ⏰📊: Analizi kişiselleştirmek ve sağlanan verilerin doğruluğunu optimize etmek için saati ve işlem hacmi türünü (tik veya Gerçek Hacim) seçin.

  • Veri Yorumlama 🧠: Gösterge tarafından sağlanan bilgileri kullanarak stratejilerinizi netleştirin ve daha bilinçli kararlar alın.

BigPlayerRange, analizleri özel ihtiyaçlarınıza göre ayarlamanızı sağlayan esnek ve uyarlanabilir bir yaklaşım sunar. Bu gelişmiş araçla bilgiye dayalı kararlar almak için bir adım önde olacaksınız! 🚀📈


İncelemeler 2
fabioa333
19
fabioa333 2024.01.23 15:19 
 

Ótimo indicador, para quem já possui um operacional, desenvolvedor sempre disponível para esclarecimento de eventuais dúvidas.

guigbz
19
guigbz 2023.12.20 15:00 
 

Indicador com alto nível de acerto, ajuda muito na tomada de decisão. O desenvolvedor é muito atencioso e prestativo quanto ao uso do indicador.

Önerilen ürünler
The indicator tracks the trend in 5 different chart times for the same asset, based on 6 signals for each chart time. The main objective of the indicator is to show us the majority trend of the financial asset in which it was placed. The system transmits the information of the trends in several graphical times, in this way the user is able to have a wide view of the movement of the asset, this type of tool makes the user have a higher hit rate by helping the operator to execute orders in fa
Limitless MT5
Dmitriy Kashevich
Limitless MT5 is a universal indicator suitable for every beginner and experienced trader. works on all currency pairs, cryptocurrencies, raw stocks Limitless MT5 - already configured and does not require additional configuration And now the main thing Why Limitless MT5? 1 complete lack of redrawing 2 two years of testing by the best specialists in trading 3 the accuracy of correct signals exceeds 80% 4 performed well in trading during news releases Trading rules 1 buy signa
This indicator was creating a perfect structure to not re-paint or recalculate, all signals are accurate. I can create a robotic version of this indicator but I need more precision in the signals. So appreciate this work. Tips to use when trading, do not buy at the top or sell at the bottom, always buy at the bottom  and sell at the top. Risk 1 to 3. In the settings you can adjust the size of the shadow or trail of the candle, you can change the colors and sizes of the arrows.
FREE
Go Binary
Fabio Oliveira Magalhaes
The main idea of this product is to generate statistics based on signals from 5 different strategies for the Binary Options traders, showing how the results would be and the final balance based on broker's payout. Strategy 1: The calculation is secret. Strategy 2: The signal is based on a sequence of same side candles (same color). Strategy 3: The signal is based on a sequence of interspersed candles (opposite colors). Strategy 4: The signal consists of the indicators bollinger (we have 3 typ
Trend On Close
David Ben Svaiter
TrendOnClose, İkili piyasa yatırımcıları için tasarlanmış, belirli mum döngüleri içindeki trendlerin ve karşı trendlerin istatistiksel analizine odaklanan sofistike bir göstergedir. Her döngü, bir sonraki döngünün başlangıcına kadar sonraki istatistiksel analiz için trend yönünü (YUKARI / AŞAĞI - BOĞA / AYI) belirleyen mum KAPANIŞ fiyatı ile tanımlanır. İstatistiksel analiz iki konfigürasyonla çalışır: ⦁ SONRAKİ MUM OLARAK İSTATİSTİKSEL HEDEF: Algoritma, döngü içindeki sonraki muma odaklanı
Deriv Boom sell
Yaovi Inoussa Atchou
Our BOOM SELL ALERT indicator is specifically engineered to   take candles on BOOM 1000 , BOOM 500 is tool is optimized for M1 (1-minute) timeframe, ensuring you receive timely and actionable insights.   The indicator is a combination of   many indicators. -        AO Oscillator -        Stochastic   HOW TO USE THIS INDICATOR To use well this indicator , it   need to use SCHAFF TREND RSX ( 5 MIN OR M5) IF SCHAFF trend RSX is GREEN and you have a signal then SELL when you have ENTRY and out with
Slow AMA
David Ben Svaiter
Compared to simple or exponential moving averages, slow adaptive trend lines might offer a more nuanced view of the trend by adjusting their sensitivity based on market conditions. However, their slow nature might also mean they are late in signaling reversals when market conditions change rapidly - and that is the difference between them and our SlowAMA . SlowAMA was designed to be a better long-term trend indicator than EMA and other Moving Averages. It uses our JurMA calculations, reducing
A powerful oscillator that provide Buy and Sell signals by calculating the investor liquidity. The more liquidity the more buy possibilities. The less liquidity the more sell possibilities. Please download the demo and run a backtest! HOW IT WORKS: The oscillator will put buy and sell arrow on the chart in runtime only . Top value is 95 to 100 -> Investors are ready to buy and you should follow. Bottom value is 5 to 0 -> Investors are ready to sell and you should follow. Alert + sound will app
Strong Candle Indicates the size of each candlestick with the text value above it and indicates which candlestick has a body larger than the one specified in the parameters in percentage, that is, a strong candlestick (between Size_Min and Size_Max) with at least x% of body. The candlestick size is placed in the buffer and that is the buy or sell indication, where: value > 0 = bullish candle or value < 0 bearish candle, value = 0 means no indication (the candle did not match the desired pattern
Smooth price for Monarch
Konstantin Gruzdev
5 (1)
The Smooth Price technical indicator is used for plotting a smoothed line as close to the price of the financial instrument as possible, and serves to eliminate its noise components. The indicator is part of the Monarch trading system, but here it is presented as an independent technical analysis tool. The indicator is based on the cluster digital filter , which, unlike the ClusterSMA , is applied directly to the price time series. Smooth Price does not redraw (except the very last, zero bar) an
ForexAndCryptoTradeTool
Gabriel Ferreira Da Silva
Quantitative analysis software, this indicator came from another country and thanks to my network today I can share this software with you! Russian Tool plots arrows on your asset, indicating the trend the asset will enter, easy to use and easy to install indicator We have been working with robots and indicators since 2018! We came to MQL5 to be able to bring better benefits at the time of payment by our customers!, our Instagram where we post daily stories of operations: https://www.inst
The Plasma Trend indicator is a simple technical indication that is used to determine the current trend direction in the market. The Plasma Trend indicator is a powerful tool for determining the direction of the trend in the Forex market. It is based on both standard technical indicators and proprietary mathematical calculations, which provides a more accurate and reliable trend determination. Its implementation in the form of lines of two colors simplifies the visual determination of a change
Trend indicator, a revolutionary unique solution for trend trading and filtering with all important trend features built into one tool! This is a 100% non-repainting multi-timeframe and multi-currency indicator that can be used on all currency pairs. HandleTrend is an effective trend following indicator that gives trend signals in the form of arrows on the chart.
Binary Options Assistant (BOA) BOIL Signals Indicator provides signals based on Ana Trader Binary Options Strategy. Indicators: Stochastic Stop missing trades, stop jumping from chart to chart looking for trade set-ups and get all the signals on 1 chart! U se any of the BOA Signals Indicator with the  Binary Options Assistant (BOA) Multi Currency Dashboard .  All BOA Signal Indicator settings are adjustable to give you more strategy combinations. The signals can be seen visually and heard au
Gösterge, İKİLİ SEÇENEKLER için giriş sinyalleri üretir, grafikte bir ok çizer ve sesli bir uyarı verir. ÇALIŞMA SAATLERİ: 6.OO GMT/ 17.00 GMT (17.00 GMT'den sonra ve gece çok düşük volatilite ve hacim eksikliği nedeniyle önerilmez) ÇİFTLER: EUR/USD (@EU6), GBP/USD (BP6). Zaman dilimleri: 1,2,3,5,10,15 dakika En iyi zaman aralığı: 3 dakika SON KULLANMA TARİHİ: 1 mum Göstergenin çalışması için gerçek hacimlere (onay hacmi yok) ihtiyacı vardır: EUR/USD, GBP/USD ECC spot çiftlerinde çalı
The implementation of the Trend Turn trend indicator is simple - in the form of lines of two colors. The indicator algorithm is based on standard indicators as well as its own mathematical calculations. The indicator will help users determine the direction of the trend. It will also become an indispensable advisor for entering the market or closing a position. This indicator is recommended for everyone, both beginners and professionals. How to interpret information from the indicator. We se
This indicator builds upon the previously posted Nadaraya-Watson smoothers. Here we have created an envelope indicator based on Kernel Smoothing with integrated alerts from crosses between the price and envelope extremities. Unlike the Nadaraya-Watson estimator, this indicator follows a contrarian methodology. Please note that by default this indicator can be subject to repainting. Users can use a non-repainting smoothing method available from the settings. The triangle labels are designed
Consolidation Zone   Indicator is a powerful tool designed for traders to identify and capitalize on consolidation patterns in the market. This innovative indicator detects consolidation areas and provides timely alerts when the price breaks above or below these zones, enabling traders to make informed trading decisions. MT4 Version :  https://www.mql5.com/en/market/product/118734 Key Features: 1.   Consolidation Detection :    -   Precise Identification : The Consolidation Zone Indicator a
FREE
Binary Options Assistant (BOA) BURN Signals Indicator provides signals based on Ana Trader Binary Options Strategy. Indicators: MACD & Stochastic Stop missing trades, stop jumping from chart to chart looking for trade set-ups and get all the signals on 1 chart! U se any of the BOA Signals Indicator with the  Binary Options Assistant (BOA) Multi Currency Dashboard .  All BOA Signal Indicator settings are adjustable to give you more strategy combinations. The signals can be seen visually and hea
The "Trend Orbital" indicator is a tool for tracking trends in the financial asset market. It is based on the analysis of price data and provides a visual interpretation of the current direction of price movement. Options: InpAmplitude: Amplitude - determines the amount of volatility that the indicator takes into account when determining the trend. Group "Arrow": InpCodeUpArrow: Up Arrow Code - Defines the arrow symbol to display an uptrend. InpCodeDnArrow: Down Arrow Code - Defines the arrow
Dependence
Andriy Sydoruk
Dependence arrow indicator for forex, futures and binary options without redrawing. It gives a lot of signals, which requires additional indicators to check them. Works only on opening prices. Therefore, reliable and without redrawing. Often signals that went in the wrong direction are canceled out on the next signal. Unfortunately, most popular indicators in practice give a huge number of false signals, since they all work without any consideration of global trends. That is why in today's co
Fibrillar
Vitalii Zakharuk
It is very easy to use the Fibrillar indicator, since the simplest is to look at the chart and act according to the indications of the colored arrows. The algorithm takes into account the measurement of prices, and this method also focuses on measuring each of the price drops (H / C, H / O, LC, LO) - which gives more detailed information, but also more averaged. When calculating this indicator, logarithmic gains are first calculated at the closing price, which allows you to filter out the tre
Rivoluziona il Tuo Trading con l'Indicatore di Segnali Scalping su Timeframe Multipli   Scopri il segreto del successo nel trading con il nostro esclusivo indicatore di SEGNALI scalping su timeframe multipli. Questo strumento avanzato è progettato per trovare segnali efficienti e precisi, aiutandoti a massimizzare i profitti e a ridurre i rischi associati al trading veloce L'indicatore di segnali Alien Scalper MTF è uno strumento di analisi tecnica altamente efficace, progettato per identificare
New to Binary Options Trading? You are not able to win while trading binary options? Need help with your trading? You have come to the right place! This indicator provides Put (SELL) and Call (BUY) signals for binary options on the M1-M15 timeframes. Advantages Ability to easily recognize impulsive moves. Effective and flexible combination to different trading strategies. Advanced statistics calculation following the entry point. Signals strictly on the close of a bar. Works in all symbols and
Weis Wave with Alert MT5
Trade The Volume Waves Single Member P.C.
4.93 (15)
Rental/Lifetime Package Options and Privileges  * For optimum results the yearly or lifetime package is suggested due to live training ! Rent Monthly Six Months   Yearly/Lifetime Weis Wave with Speed with Alert+Speed Index x x x Manual  x x x Quick Set up Video x x x Blog x x x Lifetime Updates x x x Setup and Training Material x x Free Rectangle Break Alert Tool      x Discord Access Channel "The SI traders" x 2-hour live methodology training x How to trade with it:    http://ww
CBT Quantum Maverick Yüksek Verimli İkili Kar Elde Etme Sistemi CBT Quantum Maverick, hassasiyet, basitlik ve güvenilir karlar arayan yatırımcılar için tasarlanmış, ince ayarlı, yüksek performanslı bir ikili opsiyon ticaret sistemidir. Özelleştirme gerekmez; bu sistem, kutudan çıktığı anda en iyi sonuçları elde etmek için optimize edilmiştir. Temel Özellikler: - İki Sinyal Hassasiyeti Modu: - "Yeniden Boyamaya İzin Ver" Modu: Sinyalleri önceden sunar ve bir sonraki mum için işleminizi haz
ScalperMultiMT5 is a multicurrency indicator for professional traders. The indicator shows the complete market situation for the trader. The main advantage of this indicator is that it simultaneously analyzes six major currency pairs on all timeframes from M1 to MN. The indicator analyzes the trend strength. The indicator generates color-coded signals to visualize the market situation: Green - ascending trend. Red - descending trend. Yellow - trend is not defined. The indicator is excellent for
MarketMagnet
Kelly Adediran Raymond
Are you ready to take your trading journey to new heights? Look no further than MarketMagnet, this groundbreaking indicator designed to propel your trading success with excitement and accuracy. Powered by the convergence of Momentum and CCI (Commodity Channel Index), MarketMagnet equips traders with the ultimate tool to determine direction and entry prices for a wide range of recommended currency pairs and instruments. It is designed for traders seeking to scalp for a few pips on lower timeframe
Volume Confluence
Mussadiq Abdul Rahim
Dikkat! Ürünümüzü kullanmadan önce, İngilizce sorumluluk reddi beyanını dikkatle okumanız önemlidir. Ürünümüz, potansiyel piyasa eğilimleri ve fiyat hareketleri hakkında bilgi sağlamak için tasarlanmıştır. Ancak, ticarette belirli kar veya sonuçlar garanti edilemez. Finansal piyasalarda işlem yapmak riskli olabilir ve olası kayıplardan sorumlu değiliz. Tüm ek bilgiler İngilizce sorumluluk reddi beyanında yer almaktadır.
What is KTrend indicator ? KTrend is a powerful indicator for trading medium-term binary options that identify the trend of price by candlesticks. Sell signal is formed when the value is below the zero line. Similarly, buy signal is formed when the value is above the zero line. It is separated from KTrend trading system and you can get the backtest result from the pictures below.
Bu ürünün alıcıları ayrıca şunları da satın alıyor
IVISTscalp5
Vadym Zhukovskyi
5 (5)
What's new about iVISTscalp5 forecast indicator (Version 10)? iVISTscalp5 is a unique nonlinear forecasting for a week ahead system for any financial instrument which executes fast scalping using time levels. iVISTscalp5 is a tool for easy study and understanding of financial market. 1) iVISTscalp5 forecast indicator has been completely rewritten into another programming language (C++), which has accelerated data loading and processing. As a result, a different graphical display of forecast
VTrende Pro
Andrii Diachenko
5 (1)
VTrende Pro - MTF indicator for trend trading with a display panel for MT5 *** Videos can be translated into any language using subtitles (video language - Russian) Although the signals of the VTrende Pro indicator can be used as signals of a full-fledged trading system, it is recommended to use them in conjunction with the Bill Williams TS. VTrende Pro is an extended version of the VTrende indicator. Difference between Pro version and VTrende: - Time zones - Signal V - signal 1-2 waves
The indicator is designed to close positions on the market in time. For example: to take profits ahead of schedule if the price has not reached TakeProfit, and the market is turning around. The indicator analyzes the momentum, not the trend. He does not give any information about the trend. The indicator is well suited for finding divergence. The Ershov 38 Parrots indicator dynamically adjusts to the market and detects price movement impulses of medium and high amplitude. It almost does not rea
EQ Cutrim Theory
Marco Aurelio Santos Costa
Ronal Cutrim has been a dedicated mathematician for 14 years and has more than 10 years of experience in the financial market. The concept of the theory is simple, find imbalance between buyers and sellers. Which makes a lot of sense, because nothing goes up forever, nothing falls forever.   When you find an asset with a mathematical probability of unbalanced equilibrium, it is a great way to get into trading:  TUTORIAL: Turn on the subtitles, the video is subtitled
Классификатор силы тренда. Показания на истории не меняет. Изменяется классификация только незакрытого бара. По идее подобен полной системе ASCTrend, сигнальный модуль которой, точнее его аппроксимация в несколько "урезанном" виде, есть в свободном доступе, а также в терминале как сигнальный индикатор SilverTrend . Точной копией системы ASCTrend не является. Работает на всех инструментах и всех временных диапазонах. Индикатор использует несколько некоррелируемых между собой алгоритмов для класси
Premium seviye, %80'den fazla doğru tahmin doğruluğuna sahip benzersiz bir göstergedir! Bu gösterge en iyi Ticaret Uzmanları tarafından iki aydan uzun süredir test edilmiştir! Yazarın göstergesini başka hiçbir yerde bulamazsınız! Ekran görüntülerinden bu aracın doğruluğunu kendiniz görebilirsiniz! 1, sona erme süresi 1 mum olan ikili opsiyon ticareti için harikadır. 2 tüm döviz çiftleri, hisse senetleri, emtialar, kripto para birimleri üzerinde çalışır Talimatlar: Kırmızı ok görün
Pendiente de Precio
Cesar Juan Flores Navarro
Indicador en base a la pendiente de la linea de precio, dibuja una línea de color cuando sube a base de los precios que previamente has sido procesados o linealizados, y cuando baja la pendiente la linea linealizada toma otro color. En este caso se a considerado 6 lineas de diferentes procesos desde pendientes largas hacia las cortas, observándose que cuando coincidan las pendientes se produce un máximo o mínimo, lo que a simple vista nos permitirá hacer una COMPRA O VENTA.
WanaScalper
Isaac Wanasolo
1 (1)
A scalping indicator based on mathematical patterns, which on average gives signals with relatively small SL, and also occasionally helps to catch big moves in the markets (more information in the video) This indicator has three main types of notifications: The first type warns of a possible/upcoming signal on the next bar The second type indicates the presence of a ready signal to enter the market/open a position The third type is for SL and TP levels - you will be notified every time price r
Индикатор Coefficient Of Determination (COD) представляет собой значение коэффициента детерминации или квадрат коэффициента корреляции между зависимой переменной — ценой и объясняющей переменной — тиковым объемом. Что это дает нам на практике? COD отлично распознает кульминацию трендовых движений, что позволяет подбирать оптимальные точки и ловить развороты рынка. Как использовать индикатор: Наиболее популярная торговая стратегия строится совместно с трендовым индикатором Moving Average (MA), пе
Fibonacci Multiple 12
Cesar Juan Flores Navarro
Fibonacci Múltiple 12, utiliza la serie fibonacci plasmado en el indicador fibonacci, aumentadolo 12 veces según su secuencia. El indicador fibonacci normalmente muestra una vez, el presente indicador se mostrara 12 veces empezando el numero que le indique siguiendo la secuencia. Se puede utilizar para ver la tendencia en periodos cortos y largos, de minutos a meses, solo aumentado el numero MULTIPLICA.
Recommended TimeFrame >= H1. 100% Non Repainted at any moment.  Use it carefully, only with Trend Direction. Trading Usage: 2 Variants: as Range System or as BreakOut System (Both Only With Trend Direction)::: (Always use StopLoss for minimise Risk); [1] as Range System: (Recommended) in UP TREND:  - BUY in Blue Line , then if price goes down by 50 points (on H1) open Second BUY.   Close in any Profit you wish: TrailingStop(45 points) or Close when Price touches upper Gold Line. in DOWN TR
En base a cálculos matemáticos de determino una linea Horizontal que cruza a todas las señales de trading, mostrando los máximos y mínimos. La linea horizontal parte en dos las subidas y bajadas de las señales de trading, de tan manera que es fácil identificar los máximos y mínimos, y es inteligente por que es sensible a las subidas y bajadas, afín de no quedarse en un solo lado por siempre, trabaja excelentemente con otros indicadores suavizadores ya que les garantiza que en un intervalo de tie
Spike Detector
Tete Adate Adjete
this indicator is a Spike detector indicator, it is specially designed to trade Boom 1000, Boom 500, Crash 1000 and Crash 500 We recommend using it on Deriv Boom and Crash indices only Its setting is intuitive, familiar, easy to use it has notification functions; audible notifications and push notifications. this tool is simple to use, easy to handle This update is based on different strategies for spikes
trend view panel; AutoSignals Trend The indicator tracks the trend in 5 different chart times for the same asset, based on 6 signals for each chart time. The main objective of the indicator is to show us the majority trend of the financial asset in which it was placed. The system transmits the information of the trends in different graphic times, in this way the user is able to have a wide view of the movement of the asset, this type of tool makes the user have a higher hit rate by
Escalera Inteligente
Cesar Juan Flores Navarro
Indicador en MQL5, recibe la información del precio SUAVIZADO, lo procesa anulando los picos inteligentemente, y el resultado lo envía al desarrollo de la escalera que iniciara y subirá o bajara según el peldaño o INTERVALO ingresado Ingreso PERIODO = 50 (variar segun uso) Ingreso MULTIPLICA AL PERIODO = 1 (variar segun uso) Segun la configuración la escalera puede pegarse o separarse de los precios,, Se aplica toda la linea de tiempo, y a todas las divisas, etc.  
Fibonacci Suavizado
Cesar Juan Flores Navarro
Indicador en MQL5, que obtiene el promedio de 10 EMAS, que son alineadas según Fibonacci, obteniendo un promedio, que sera suavizado.  Se puede ingresar un numero desde 2 a N, que multiplica a los EMA-Fibonacci. Funciona en cualquier criptomoneda, etc. etc... pudiendo calcular el futuro segun la tendencia de las EMAS. Funciona excelentemente en tramos largos, determinando exactamente el mejor inicio/salida. El precio inicial por apertura sera por un periodo de tiempo, luego aumentará.
Seconds Charts
Aleksandr Goryachev
Micro  ******************* Секундные графики MT5 ********************** Более точного инструмента для входа в сделку вы не найдёте. Входные параметры: Timeframe, sek - период построения графика, секунды Displayed bars - отображаемые бары Step of price levels, pp, 0-off - шаг отрисовки ценовых уровней, пункты Scale points per bar, 0-off - масштаб в пунктах на бар Show lines - отображение текущих уровней Show comment - отображение комментария Standard color scheme - стандартная цветовая сх
QuantXSTocks Trading Range Indicator for MT5: INSTRUCTIONS TO USE OUR INDICATOR:- User needs to take trade on Arrow or after an Arrow CandleStick, You can achieve up-to 35-125 pips target by this Indicator. Best Timeframes for Stocks and Indices are M30 and H1: AMAZON M30 (50 pips) TESLA M30 (50 pips) APPLE M30 (50 pips) ADOBE M30 (50 pips) NASDAQ100 H1 (125 pips) The above are the approximate amount of pips you can achieve by this Indicator, Green arrow appears to be buy arrow while the Red a
Super Suavizador
Cesar Juan Flores Navarro
Indicador en MQL5 que obtiene el promedio de 10 EMAS que son alineadas y procesadas según Fibonacci luego el promedio es suavizado"  Se ingresa un número de 2 a N que multiplica los EMA-Fibonacci y por consiguiente aumenta los fibonacci, resultando un promedio.   Se ingresa un número que suaviza los EMA-Fibonacci. Considerando los números 1/1 seria la suavización minima. Considerando los números 3/5 seria la suavización media. Considerando los números 10/30 seria la suavización alta.....etc
Trend and Signals MT5  indicator scans  30 trading Instruments (Forex, Metals and Indices).     It uses special algorithm on the  current market   based on   Pure Price Action   and display the overall trend and signal on the dashboard. When signals are produced the indicator sends alert and notification. Strategy for Signals This indicator uses the daily timeframe to determine the direction of the trend. The hourly timeframe is used to identify possible entries. Main trend and is determined by
This indicator is based on a mathematical formula and an ANN combined, designed to make a model(using previous prices) of the most recent market condition (any chart*) in order to use the model as a forecasting tool. *This indicator can operate on any chart/timeframe, but it's suggested you use multiple timeframes for each trade because this method relies solely on the time factor, you can not use this indicator to predict price volatility, but if it's fit correctly it will show you when the nex
This indicator is based on the crossing of two Moving Average with the RSI It is intended for scalpers Specially designed for Boom and Crash syhtetic indices from Binary.com/Deriv.com It is easy to use and intuitive. We recommend its use on M1 and is equipped with three types of notification Email alert Sound notification Push notification these parameters can be activated and deactivated.
Bu araç sayesinde grafiklerinizde regresyon kanalını kontrol etme yeteneği elde edersiniz. Kanal seviyelerini, destek ve direnç seviyelerini sağlayacaktır. Ayrıca düzeltme dalgası seviyelerini sunar. Ayrıca, dolum ve ışın seçenekleri gibi kanalı doğrudan kontrol etme imkanını sağlayan bir kontrol paneli üzerinden kanalı yönetebilirsiniz. Ayrıca, farklı çiftlerle işlem yaparken daha iyi bir görünüm elde etmek için daha yüksek zaman dilimlerinden veri yükleyebilirsiniz. Nasıl Kullanılır: Trend Çiz
Use with JUMP 25. However it can can with the volatility indices as well because it is a modified version. It is advisable to use create a healthy account management. Measure your risk and happy trading. Other experts to be loaded soon. These are modified in order to optimise profits. Ideal candidates are high risk, high returns individuals who hold trades at a maximum of 1 - 2 hours
This indicator is a scalping indicator intended solely for the Boom and Crash indices of the Deriv Limited market It supports Boom 500, Boom 1000, Crash 500 and Crash 1000 Not repaint and no bug The settings are intuitive and easy to use The product activation number is 20 The Time Frame used depends on the user If you are an aggressive scalper then just use M1 For long trades use M15 If you are conservative use M5 Please contact me for more details of its use
RadioMedia
Cesar Juan Flores Navarro
Indicador de MQL5 basado en 3 EMAs, en función del precio. El precio influye en las EMAs, de tal forma que los Máximos y Mínimos solo la alteran minimamente, este influjo lo llame radio. Considerando la influencia del radio como constante, por lo que no tiene valores de entrada. Ideal para todas las criptomonedas. Funciona en todos los tiempos. Se sugiere operar cuando el precio este abajo y en bajada.... o cuando el precio este encima y en subida.
El Super Suavizador Inteligente es la culminación de la evolución de los suavizadores en funcion del precio, funciona en todos los pares de divisas, es fácil de usar, y puedes usarlo varias veces en un mismo par, afin de darte una idea de hacia donde va el precio, muy util para ver la tendencia a largo plazo. El SSI trata siempre de formar ondas de subidas y bajadas a fin de poder mostrar el máximo y/o mínimo de la tendencia del precio.
Aliens dougkang de moviles
Cesar Juan Flores Navarro
Tomamos 5 medios móviles las unimos en una la cual suavizamos y volvemos a suavizar, resultando un mega suavizador de medios móviles suavizadas. Indicador de mql5 funciona en cualquier broker y para todos los tiempos, siendo el mas optimo el de 5, 15 a mas. Funciona mejor en grupo consigo misma osea poner uno de 14 y otro de 50 y 400,, así se observa mejor su desempeño.
AIS MT5 INDICATOR 5 ALL INCLLUSIVE SET GUIDE CHAPTER 1  IMPORTANT INFORMATION <1> THIS INDICATOR IS ONE OF THE SERIES OF NEW AIS INDICATORS AIS MT5 INDICATOR 1 =ADVANCED CLASSIC= AIS MT5 INDICATOR 2 =MULTIFRAMES= AIS MT5 INDICATOR 3 =LINES= AIS MT5 INDICATOR 4 =MARKET PROFILES= AIS MT5 INDICATOR 5 =ALL INCLUSIVE SET CHAPTER 2 GENERAL FEATURES OF THE SERIES <1> AIS MT5 INDICATOR 1 =ADVANCED CLASSIC= < DEVELOPMENT PAUSED >     DISPLAYS MAIN TIME POINTS AND PRICE LEVELS OF THE CHART     
Dört topluluğa bölünmüş on iki yapay sinir ağı gelecekte fiyat hareketinin yönünü tahmin etmeye çalışmak: küçük: 1 dakika, orta: 5 dakika, büyük: 30 dakika, kraliyet: 15 dakika. Aktif yüksek frekanslı ticaret için bu gösterge ile çalışmaya hazır Ayrı olarak başlatılan ve gösterge tarafından yayınlanan küresel değişkenler biçiminde göstergeden sinyal alan bir EA. Bu gösterge strateji test cihazında çalışmıyor, bu nedenle videoyu izleyin veya size bir hafta ile sınırlı bir deneme demo sürümü sağl
Yazarın diğer ürünleri
SwingVolumePro
Thalles Nascimento De Carvalho
Genel Bakış SwingVolumePro , geniş bir finansal varlık yelpazesi üzerinde kullanılmak üzere tasarlanmış gelişmiş ve çok yönlü bir göstergedir. Hacim ve fiyat analizi üzerine kurulmuş olan bu gösterge, tüm seviyelerdeki trader'ların yüksek kaliteli verilere dayanarak bilinçli kararlar almasını sağlayacak şekilde net ve hassas sinyaller sunar. SwingVolumePro.PDF Ana Özellikler Çok Yönlülük: SwingVolumePro, hisse senetleri, forex, kripto paralar ve daha fazlası dahil olmak üzere çeşi
Box Weis Wave
Thalles Nascimento De Carvalho
5 (1)
Weis Wave Box ile analizlerinizi bir üst seviyeye taşıyın! Eğer ticaretinizde hassasiyet ve netlik arıyorsanız, Weis Wave Box ihtiyaç duyduğunuz araçtır. Bu ileri düzey gösterge, hacim dalgaları ve swing noktalarının ayrıntılı görsel analizini sunarak, piyasalarda çaba ve sonuç arasındaki ilişkiyi daha iyi anlamanıza yardımcı olur. Weis Wave Box’ın Başlıca Özellikleri: Kişiselleştirilebilir Hacim Dalgaları: Ticaret stratejilerinize uygun olarak hacim dalgalarını tik bazında ayarlayın.
AI Channel
Thalles Nascimento De Carvalho
4 (4)
Welcome to the presentation of the AI Channel indicator, a powerful tool that uses artificial intelligence for price channel analysis in the financial market. In this session, we will explore how this revolutionary indicator can assist investors and traders in making more informed and strategic decisions. Let's get started! I. What is the AI Channel indicator? AI Channel is an indicator developed based on advanced artificial intelligence algorithms. It utilizes historical price data of financial
FREE
Cumulative Volume Bands
Thalles Nascimento De Carvalho
CVB Cumulative Volume Bands: Birikmiş Hacim ile İşlemlerinizi Güçlendirin! CVB Cumulative Volume Bands , birikmiş hacme dayalı kesin sinyaller arayan traderlar için tasarlanmış ileri düzey bir göstergedir. Birikmiş hacim bantlarını kullanarak, bu gösterge piyasanın alım ve satım baskılarının net okumasını sağlar ve dönüşleri ve güçlü fiyat hareketlerini tanımlamada yardımcı olur. Cumulative Volume Bands for MT5 ! Temel Özellikler: Birikmiş Hacim Analizi : Hacme dayalı baskı n
FREE
Swing Point Volume
Thalles Nascimento De Carvalho
Swing Point Volume, the indicator that signals weakness and strength at the tops and bottoms. This indicador can be for used the Wyckoff Method. Information provided; - Swing on customized ticks. - Volume and points in each balance sheet. - Percentage of Displacement. - Sound alert option on top and bottom breaks. - Volume in ticks and Real Volume. - Volume HL (extreme) or (opening and closing) - Customized volume shapes.
Atr Projection
Thalles Nascimento De Carvalho
ATR Projeksiyon Göstergesi, finansal piyasalardaki fiyat hareketlerinin potansiyel sınırları konusunda keskin görüşler sunmak amacıyla tasarlanmış teknik analizde güçlü bir araç olarak öne çıkıyor. Esnek yaklaşımı, kullanıcıların analiz ölçümlerini sezgisel bir şekilde özelleştirmelerine, her işlem yapılan varlığın özel ihtiyaçlarına uyarlamalarına izin verir. Özelleştirilebilir İşleyiş: Varsayılan olarak, ATR Projeke 100 mumun ortalamasının %30'unu göz önünde bulundurarak çalışır. Bu esne
Long Short Pro
Thalles Nascimento De Carvalho
Long & Short Göstergesi - Pro Versiyon: Pazar Analizinizi Sınırsız Olanaklarla Güçlendirin! Tüm Varlıklar İçin Sınırsız Kullanım Long & Short göstergesinin Pro versiyonu, herhangi bir finansal varlık üzerinde tam özgürlük sunar. Artık sınırlama olmadan aynı göstergiyi tüm tercih ettiğiniz varlıklara uygulayabilirsiniz! Sınırsız Erişim Göstergeyi hiçbir kısıtlama olmadan kullanmanın tadını çıkarın. Pro versiyonu, size tam ve sınırsız bir deneyim sunarak her piyasa fırsatını en üst
Didi Index Volume
Thalles Nascimento De Carvalho
Sunuyoruz, Didi Index Volume adlı bir teknik analiz göstergesi. Bu gösterge, Brezilyalı trader Odir Aguiar tarafından geliştirilmiştir ve finansal piyasalardaki fırsatları tespit etmede ileri ve güçlü bir yaklaşımıyla öne çıkmaktadır. Çeşitli platformlarda mevcut olan Didi Index Volume, kesin bilgilere ve değerli bilgilere ihtiyaç duyan işlemciler için vazgeçilmez bir araç haline gelmiştir. Gösterge, Odir Aguiar tarafından oluşturulan saygın Didi Index ile işlem hacminin akıllı bir şekilde ku
Smart Binary Volume
Thalles Nascimento De Carvalho
Smart Binary Volume göstergesi, ticaret hacmi analizini makine öğrenimi ile birleştiren çok yönlü bir araçtır. Scalping ve diğer kısa vadeli ticaret stratejileri de dahil olmak üzere çeşitli piyasalarda ve stratejilerde kullanılabilir. Gelişmiş makine öğrenimi algoritmalarını kullanarak, gösterge karmaşık desenleri tanımlar ve daha hassas alım satım sinyalleri üretir. Buffer to Create EA. Buffer Line Gold = 0. Buffer Line Red = 2 Buffer   AI  =  3 AI Buffer  >=  0  ("SIGNAL BUY") AI Buffer 
TimeChannel
Thalles Nascimento De Carvalho
The "Timechannel" is a powerful technical analysis tool designed specifically for traders who want to gain deeper and more accurate insights into price movements across multiple timeframes (multi-timeframe). This indicator is an essential addition to the toolbox of any serious trader seeking to make informed and data-driven trading decisions. Key Features: Advanced Multi-Timeframe Analysis : Timechannel allows traders to analyze price movements on different timeframes simultaneously. This is cr
Master OBV
Thalles Nascimento De Carvalho
MasterOBV: Pazar Trendlerini Hassasiyetle Yönetin! MasterOBV , hacim , pozitif korelasyon ve Hareketli Ortalama (MA) kombinasyonunu kullanarak finansal piyasalarda trendleri tanımlama yeteneğini artıran bir teknik analiz göstergesi dir. Ana Özellikler: Akıllı Hacim: Ticaret hacmini analiz ederek trend gücündeki önemli değişimleri belirler. Pozitif Korelasyon: Korele olmuş varlıkları dahil ederek daha geniş ve doğru bir bakış açısı sağlar, çiftlerin hacmine dayalı olarak fiyat kayması
Smart Delta Volume
Thalles Nascimento De Carvalho
Smart Delta Volume: Dinamik Pazar Koşullarına Uyarlanabilir ve Hassas Araç Smart Delta Volume , sürekli değişen bir piyasa ortamında hassas ve uyarlanabilir analizler sunmak için tasarlanmış gelişmiş bir teknik göstergedir. Bu gösterge, volatiliteye göre otomatik olarak ayarlanan dinamik seviyeleri kullanarak, hacim akışı ile fiyat hareketleri arasındaki etkileşim hakkında daha kapsamlı ve güvenilir bir görüş sağlar. Bu uyarlanabilirlik, özellikle değişken piyasalarda hızlı ve doğru bilgiler
VolaMetrics VSA
Thalles Nascimento De Carvalho
VolaMetrics VSA | Teknik Analizde Güçlü Bir Yardımcı VolaMetrics VSA , Volume Spread Analysis (VSA) metodolojisini ayrıntılı işlem hacmi analizi ile birleştiren bir teknik analiz göstergesidir. Önemli fiyat hareketlerini belirlemek ve izlemek için tasarlanan bu araç, hacim ve fiyat yayılması arasındaki etkileşimi kullanarak, ticaret kararlarına yardımcı olabilecek değerli içgörüler sağlar. Volume Spread Analysis (VSA) Temelleri Volume Spread Analysis (VSA) , teknik analizde saygı gören bir
CVD SmoothFlow Pro
Thalles Nascimento De Carvalho
CVD SmoothFlow Pro - Her Varlık İçin Sınırsız Hacim Analizi! CVD SmoothFlow Pro , hassas ve sınırsız bir hacim analizi arayan trader'lar için nihai çözümüdür. Cumulative Volume Delta (CVD) hesaplamasını ve gelişmiş gürültü filtrelemesini kullanarak, Pro sürümü herhangi bir finansal varlık için gereken esneklik ve doğruluğu sağlar. CVD SmoothFlow Pro Neler Sunar? Açık Analiz : Pazar gürültüsünü filtreler ve her finansal varlıkta önemli hacim hareketlerini vurgular. ️ Kesin Hesaplama : Alım
VolumeSecret
Thalles Nascimento De Carvalho
VolumeSecret: Volume’un Gücü Elinizde Programlama dünyasında karşılaştığımız zorluklar, sürekli olarak büyümemize ve gelişmemize neden olur. Pazarın getirdiği zorlukları ve traderların en yüksek performansa ulaşma mücadelesini derinden anlıyoruz. Bu yüzden, pazar kararlarını daha akıcı ve hassas hale getirmek için yenilikçi çözümler üzerinde durmaksızın çalışıyoruz. VolumeSecret , bu bağlılığın bir sonucudur. Bu gelişmiş göstergeler, hacim analizi ile sofistike bir stratejiyi birleştirerek piyas
Cumulative Vol Bands
Thalles Nascimento De Carvalho
CVB Cumulative Volume Bands: Birikmiş Hacim ile İşlemlerinizi Güçlendirin! CVB Cumulative Volume Bands , birikmiş hacme dayalı kesin sinyaller arayan traderlar için tasarlanmış ileri düzey bir göstergedir. Birikmiş hacim bantlarını kullanarak, bu gösterge piyasanın alım ve satım baskılarının net okumasını sağlar ve dönüşleri ve güçlü fiyat hareketlerini tanımlamada yardımcı olur. Temel Özellikler: Birikmiş Hacim Analizi : Hacme dayalı baskı noktalarını tespit edin. Açık Giriş/
ZigWave Oscillator
Thalles Nascimento De Carvalho
ZigWave Oscillator: Osilatörler ve ZigZag ile İşlemlerinizi Güçlendirin! ZigWave Oscillator, finansal piyasalarda doğruluk ve netlik arayan traderlar için mükemmel bir araçtır. Bu gösterge, osilatörlerin gücünü ZigZag’ın görsel sadeliğiyle birleştirir ve en iyi alım ve satım fırsatlarını hızlı ve etkili bir şekilde tanımlamanıza yardımcı olur. Neden ZigWave Oscillator'ı Seçmelisiniz? Doğru Osilatör Analizi : RSI, Williams %R veya CCI’yi entegre ederek piyasanın ana hareketlerini yakala
Filtrele:
fabioa333
19
fabioa333 2024.01.23 15:19 
 

Ótimo indicador, para quem já possui um operacional, desenvolvedor sempre disponível para esclarecimento de eventuais dúvidas.

Thalles Nascimento De Carvalho
6309
Geliştiriciden yanıt Thalles Nascimento De Carvalho 2024.01.23 15:24
Obrigado! 🙏
guigbz
19
guigbz 2023.12.20 15:00 
 

Indicador com alto nível de acerto, ajuda muito na tomada de decisão. O desenvolvedor é muito atencioso e prestativo quanto ao uso do indicador.

Thalles Nascimento De Carvalho
6309
Geliştiriciden yanıt Thalles Nascimento De Carvalho 2024.01.05 16:43
Obrigado pelo feedback! 🙏
Algoritmo poderoso em indices ,principalmente no WIN e WDO.
İncelemeye yanıt
Sürüm 2.5 2024.05.16
atualização no menu input
Sürüm 2.4 2024.05.14
Adicionado swing de volume (Esforço Vs Resultado)
Sürüm 2.3 2024.04.22
Adicionado taxa de juros DI (correlação )
Sürüm 2.2 2024.01.29
Adicionado volume profile!
Sürüm 2.1 2024.01.17
Adicionado alerta email
Sürüm 2.0 2024.01.12
added arrows for structure breach.
Sürüm 1.6 2023.11.30
Update das marcações
Sürüm 1.5 2023.11.29
Ajuste na contagem do volume.
Sürüm 1.4 2023.11.21
Ajuste nas as targets
Sürüm 1.3 2023.11.20
Otimização em objetos onchart
Sürüm 1.2 2023.11.17
Melhorias no uso de hardware.