Black horse indicator MT5
- Göstergeler
- Shengzu Zhong
- Sürüm: 1.22
- Güncellendi: 2 Haziran 2024
- Etkinleştirmeler: 10
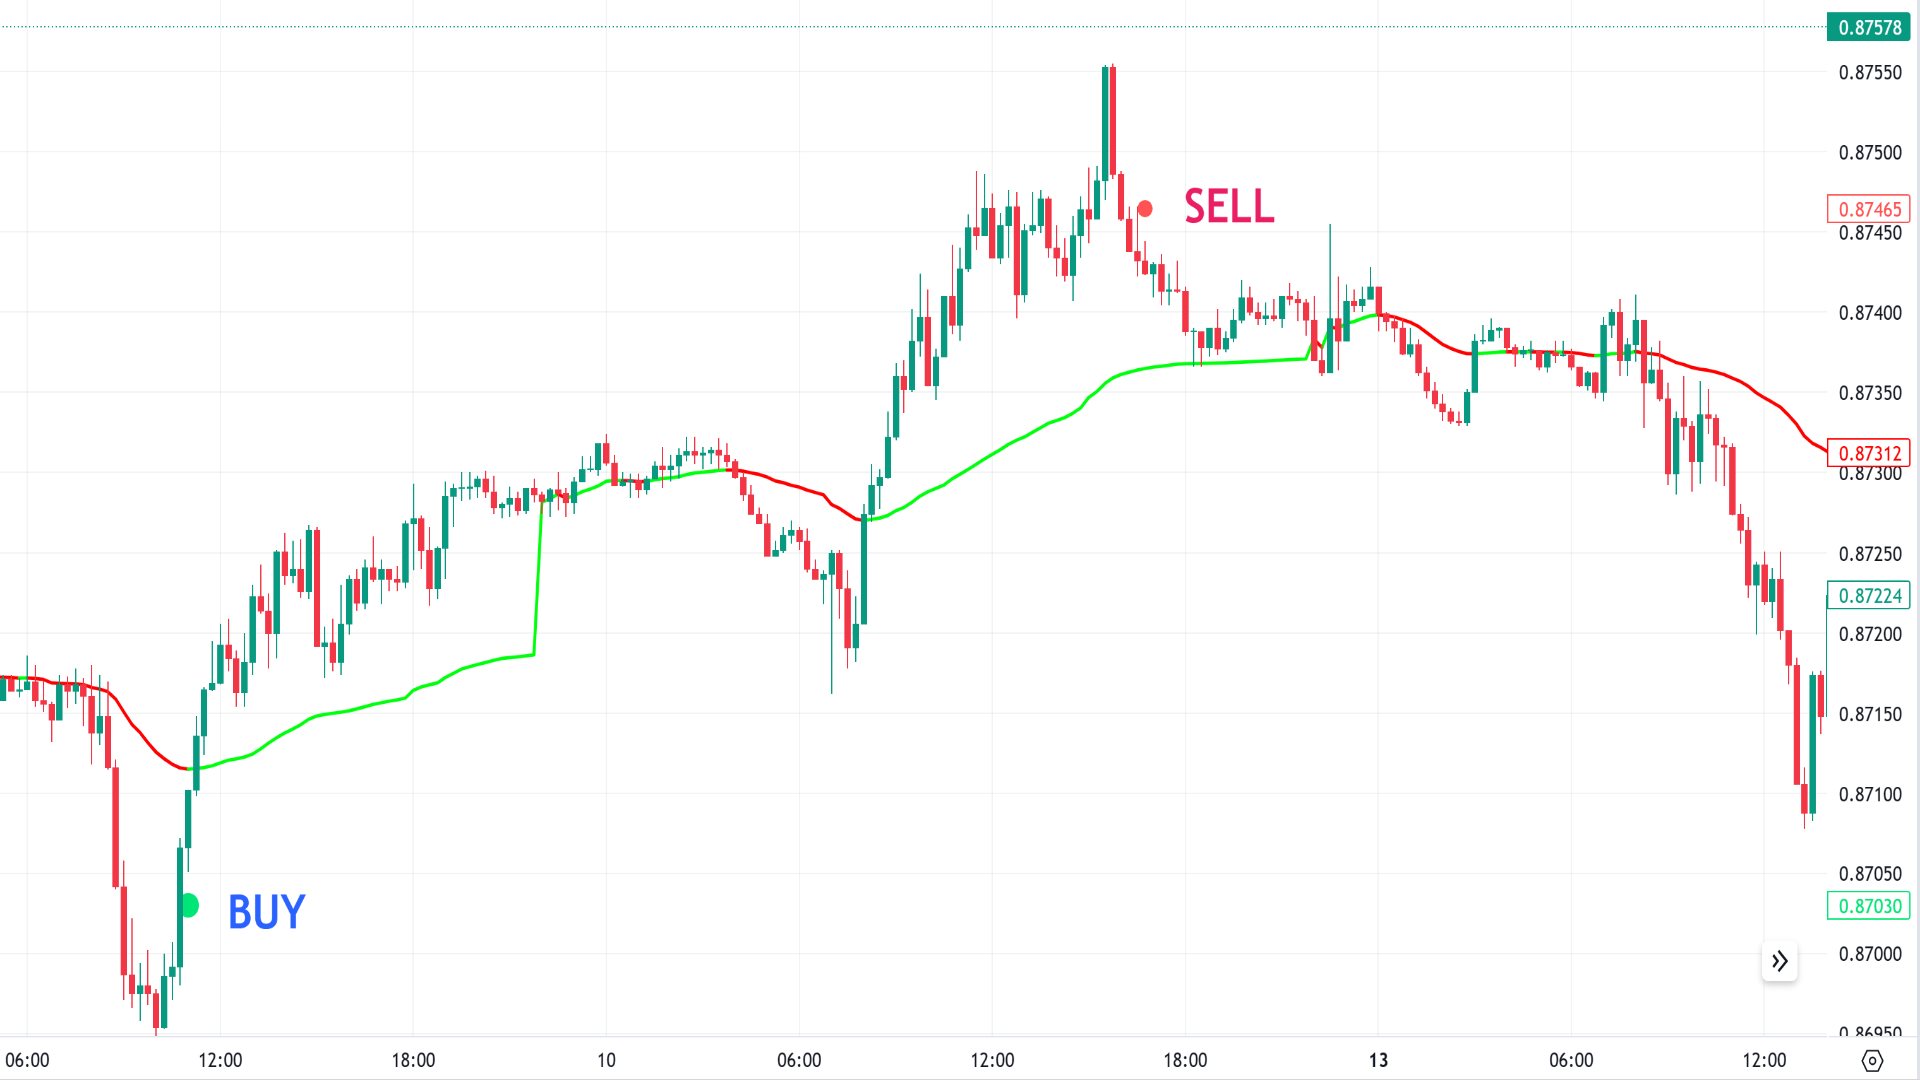
"Black Horse" göstergesinin amacı, fiyat hareketleri ile VWAP göstergesi arasındaki sapmaları belirlemektir. Potansiyel yanlış sapmaları filtrelemek ve yüksek kaliteli, doğru uyarıları göstermek için filtreleri kullanır.
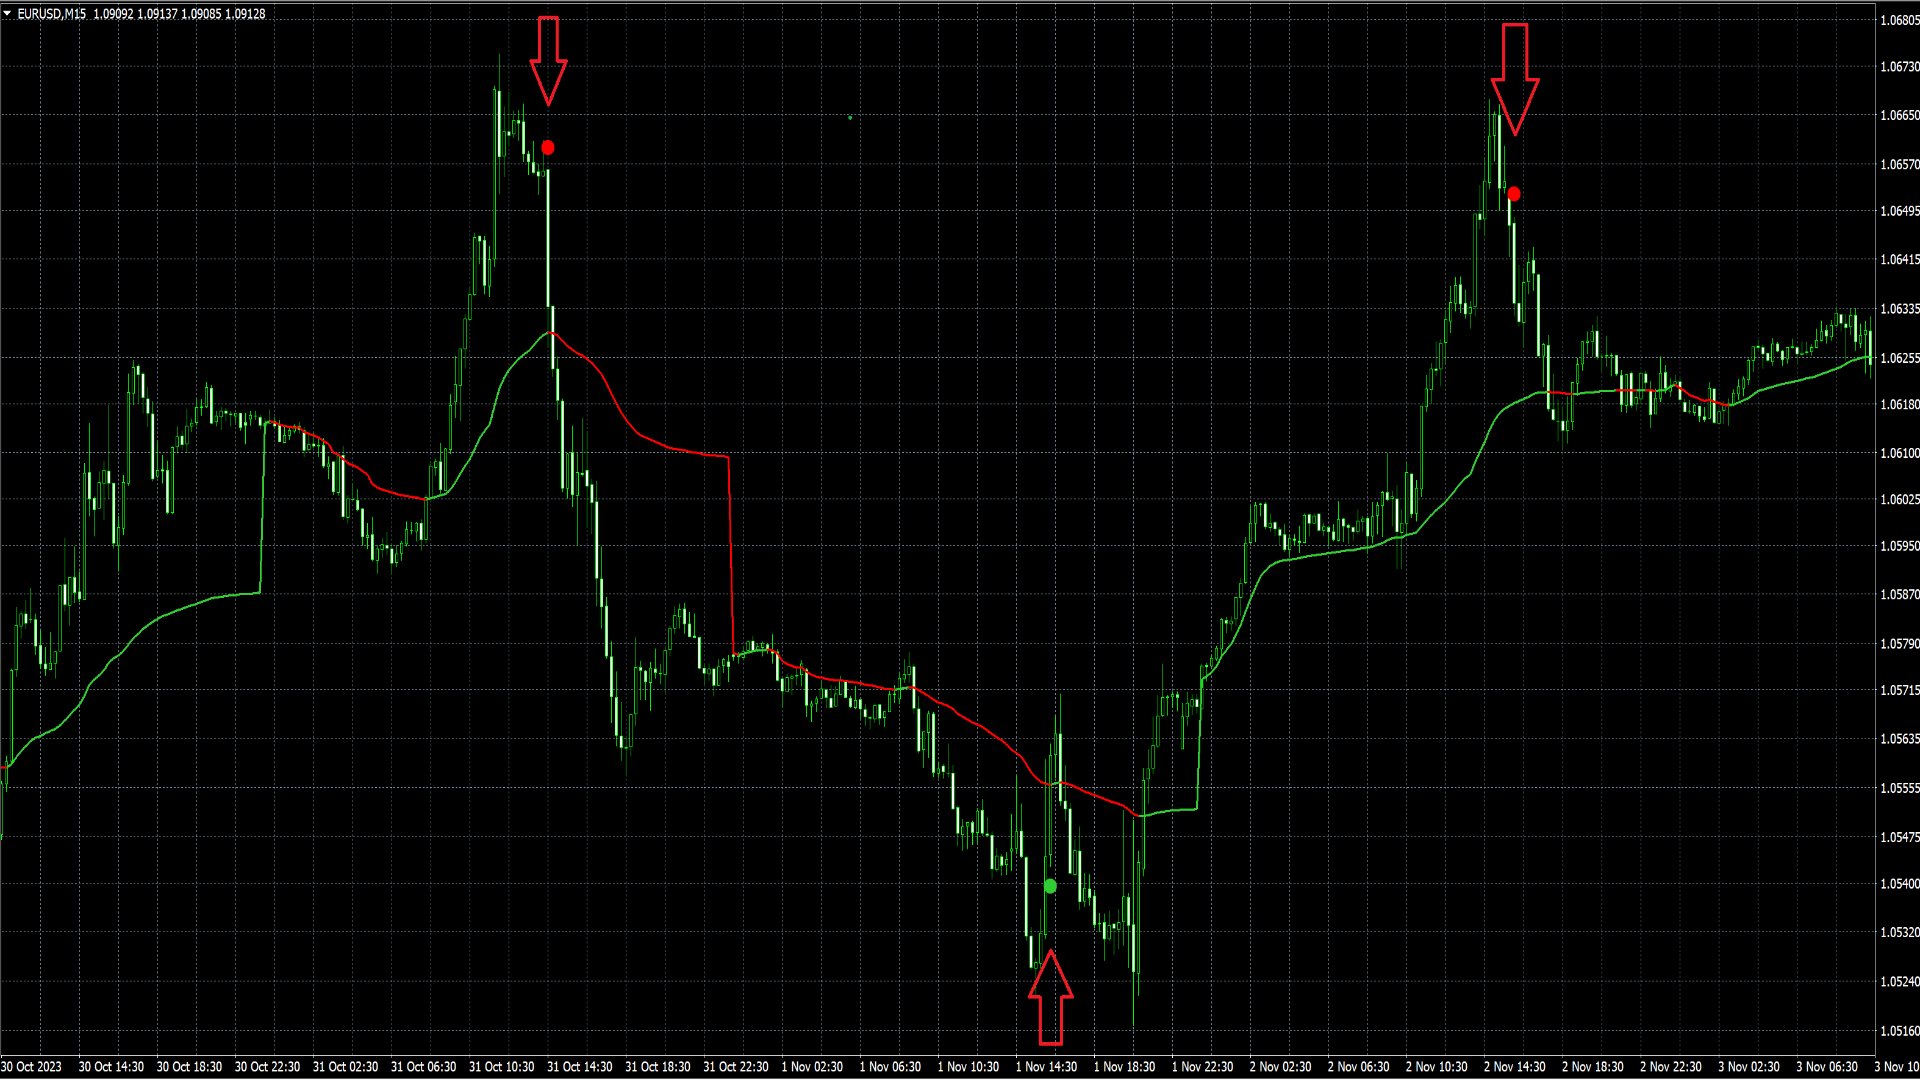
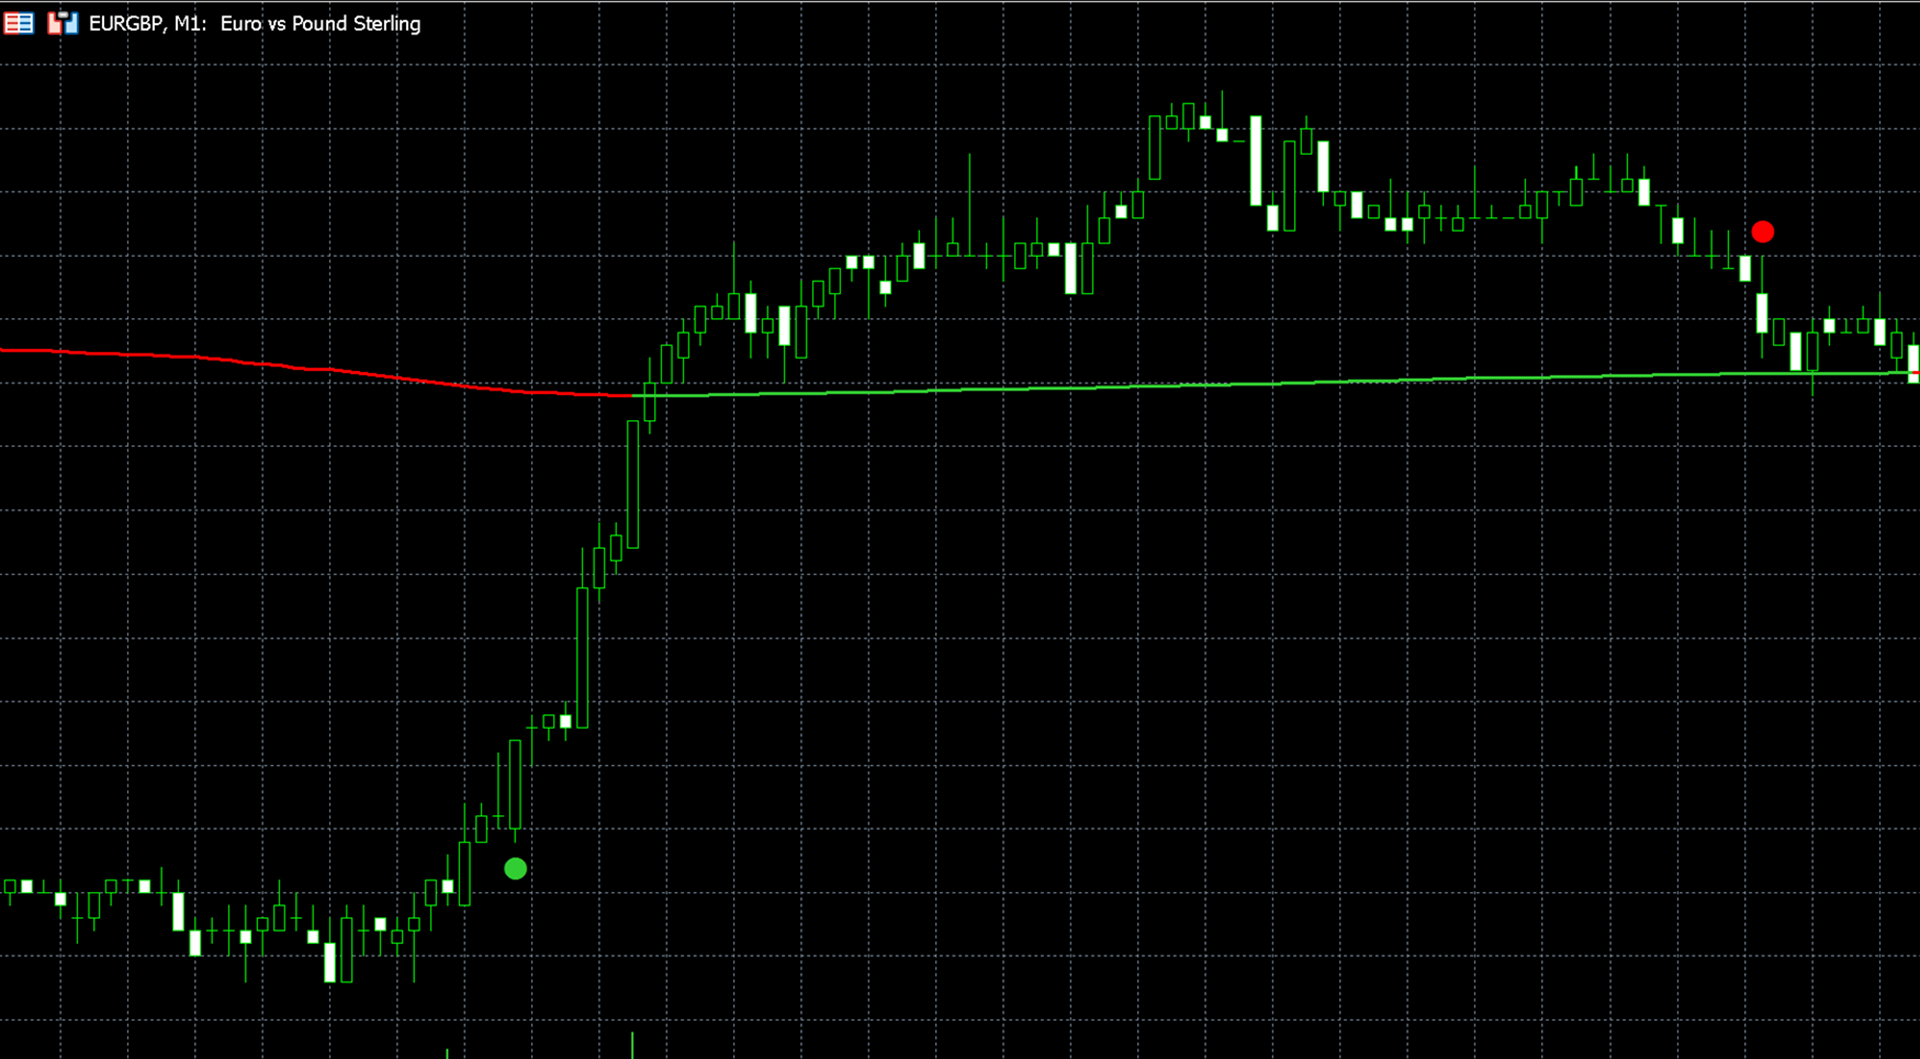
Ayı sapmaları, mumun üzerindeki kırmızı noktalarla gösterilirken, boğa sapmaları mumun altındaki yeşil noktalarla temsil edilir.
Temel sapma filtresi, ATR (Ortalama Gerçek Aralık) ve gözden geçirme dönemi içindeki önceki mumların fiyat hareketine odaklanmaktadır. Sapmalar, gözden geçirme dönemi içindeki fiyat hareketinin yeterince keskin olması ve ATR çarpanı ile ATR'nin çarpımını aşması durumunda belirlenir.
Hesaplama özelliklerinden dolayı, daha yüksek zaman dilimleriyle çalışırken ATR çarpanı ve gözden geçirme dönemi için daha düşük değerler belirlemek tavsiye edilir. Daha yüksek zaman dilimlerinde, fiyat hareketlerinin daha düzleştirildiği 15 dakikalık grafik gibi, keskin fiyat dalgalanmaları daha az sıklıkta meydana gelir ve genellikle daha az mum içinde sınırlıdır, düşük zaman dilimlerine göre. Daha düşük volatiliteye sahip hisse senetleri, HSBC gibi, daha düşük ATR çarpanları ve kısa gözden geçirme dönemleri kullanmalıdır.
"Görsel Ayarlar" bölümünde, VWAP çizgisinin rengini değiştirme, sıralı VWAP renklerini gösterme, sapma sinyallerinin boyutunu ayarlama ve VWAP çizgisini gösterme veya gizleme seçeneğiniz bulunmaktadır.