MTF Support Resistance with Fibo and LR Channel
- Göstergeler
- Huu Hai Ngo
- Sürüm: 1.35
- Güncellendi: 26 Mayıs 2024
- Etkinleştirmeler: 20
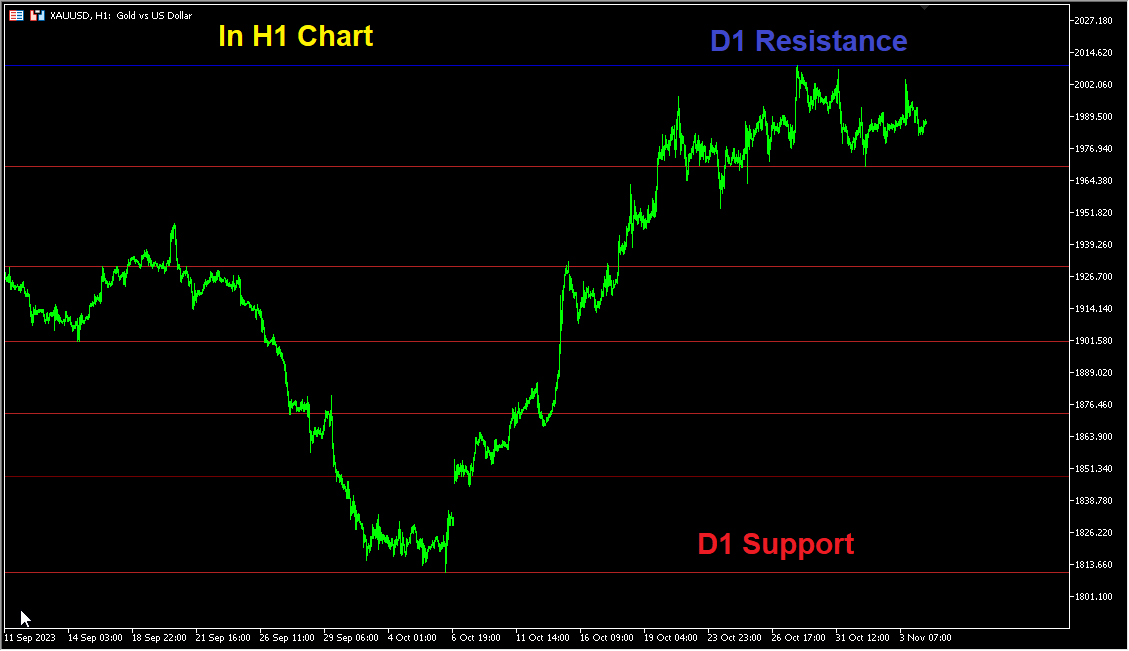
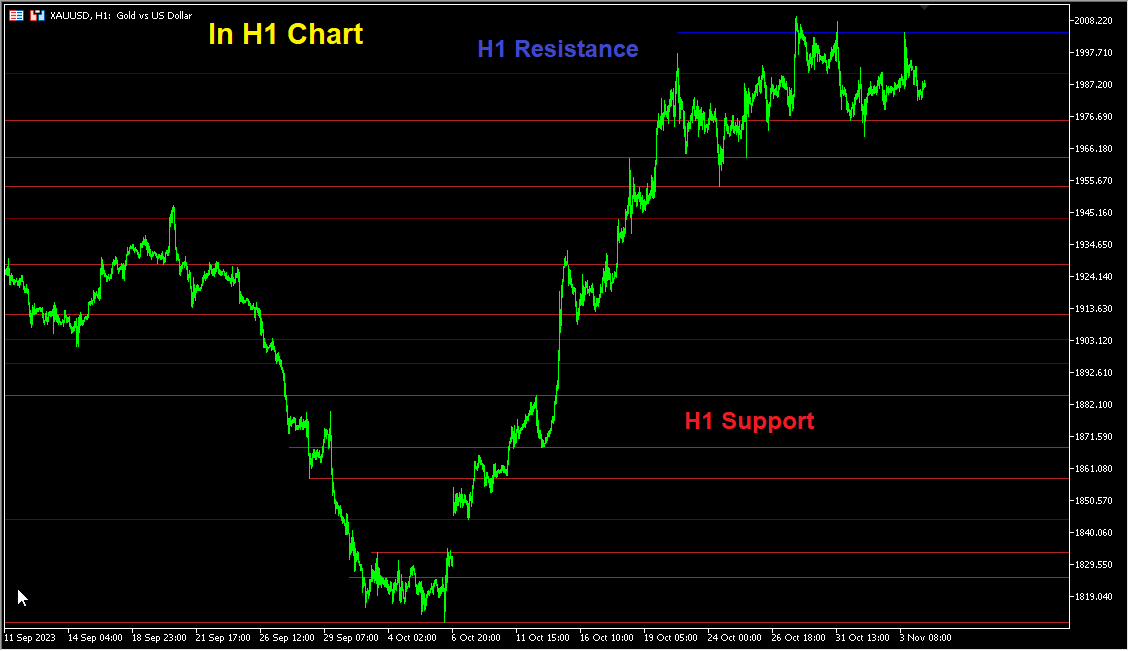
This is a multi-timeframe indicator that detects and displays support and resistance (S&R) lines using the ZigZag indicator.
Features
Input parameters
Features
- The support and resistance lines are not redrawing.
- The indicator is capable of adding new support and resistance levels as they appear.
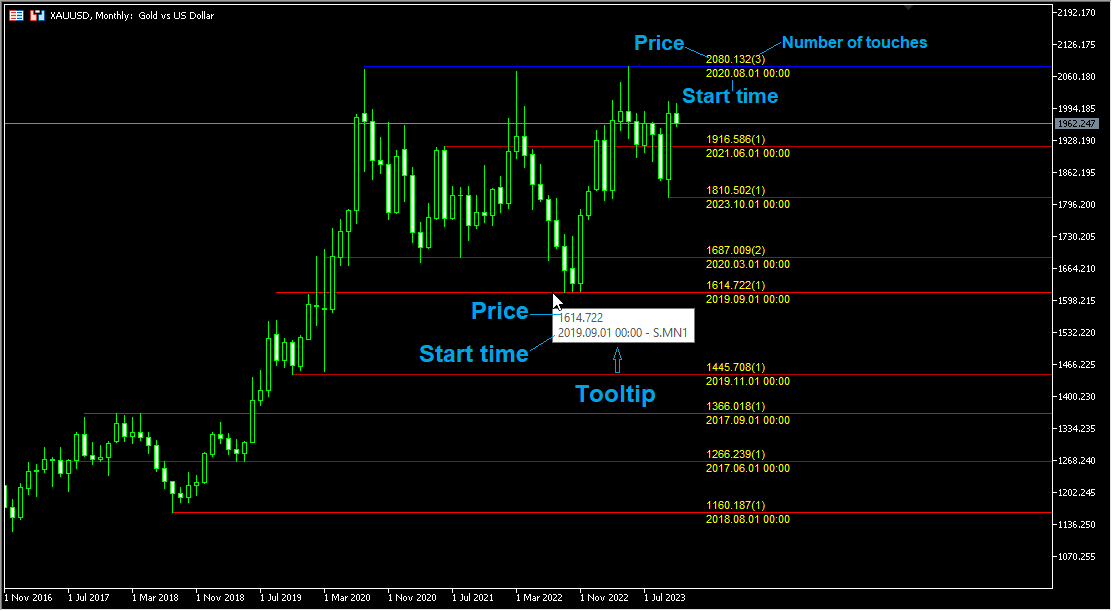
- Each S&R line has a tooltip that displays the price level and start time.
- Shows the start time, price level and number of touches of all S&R lines when pressing the shortcut Shift+I
- Save time for multi-timeframe analysis on trades.
- All types of alerts (sound, pop-up, email, mobile push notification) are available.
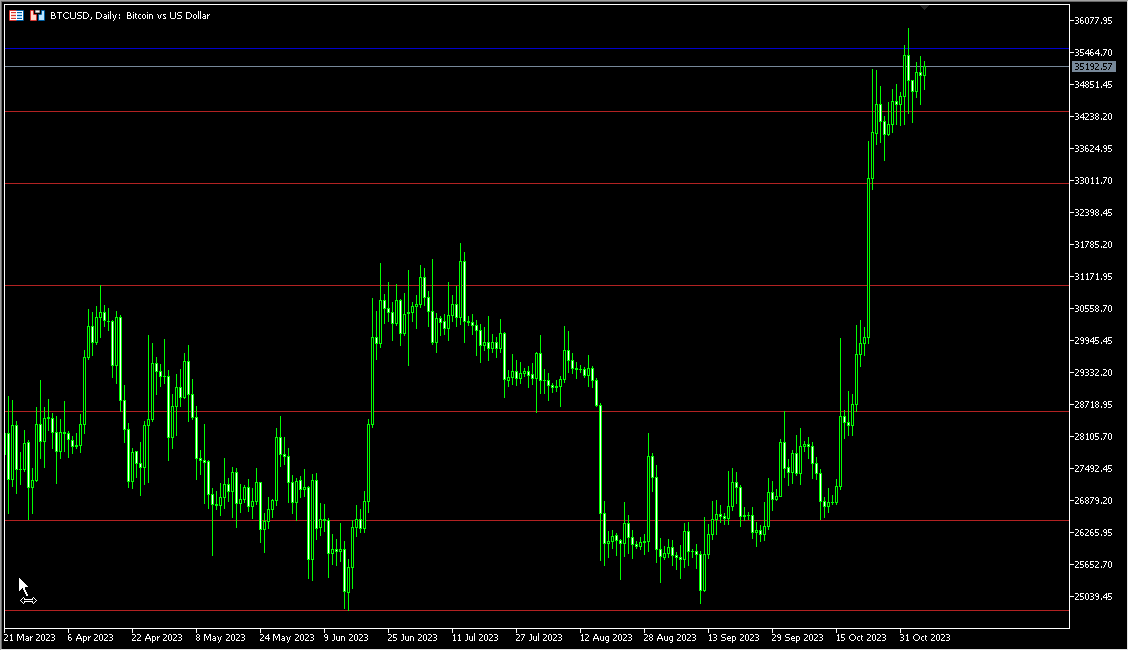
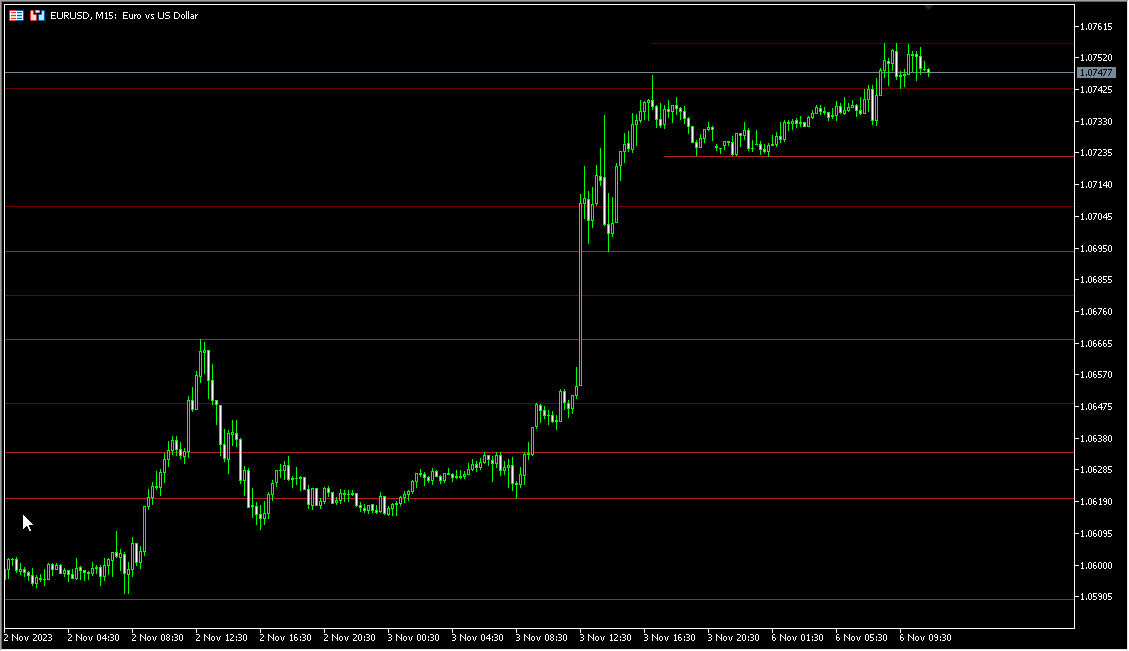
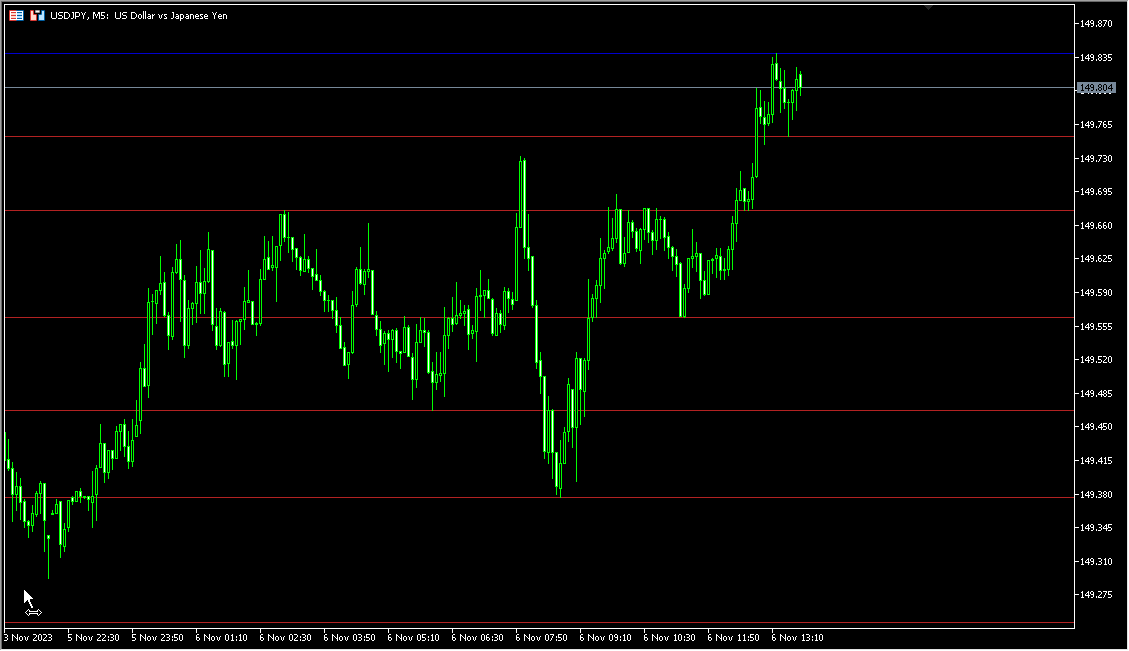
- Working with all pairs (forex, metals, indices, stocks, cryptos,...).
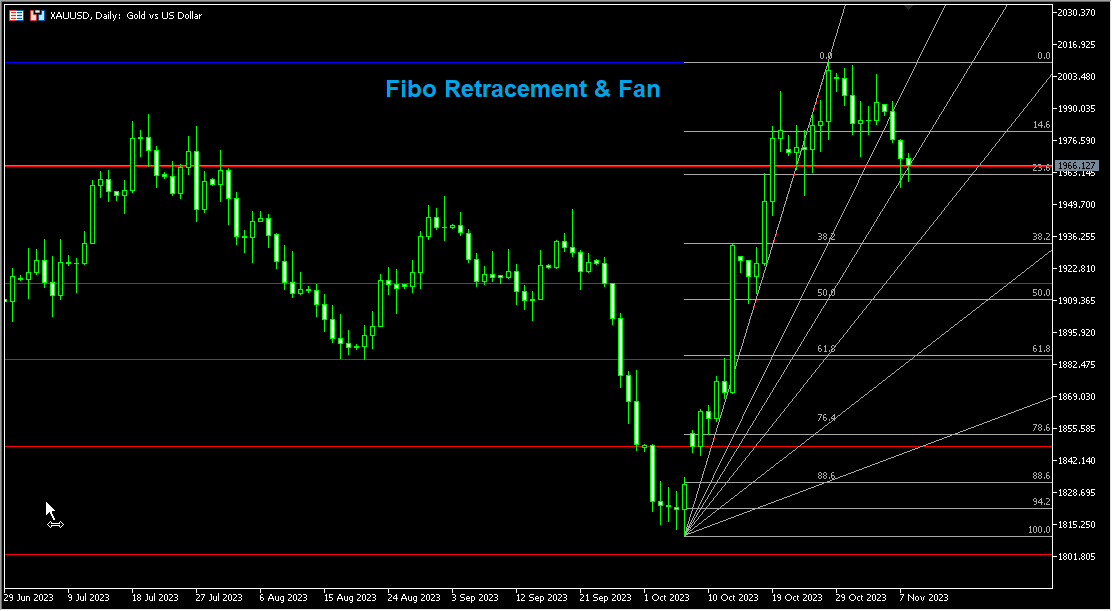
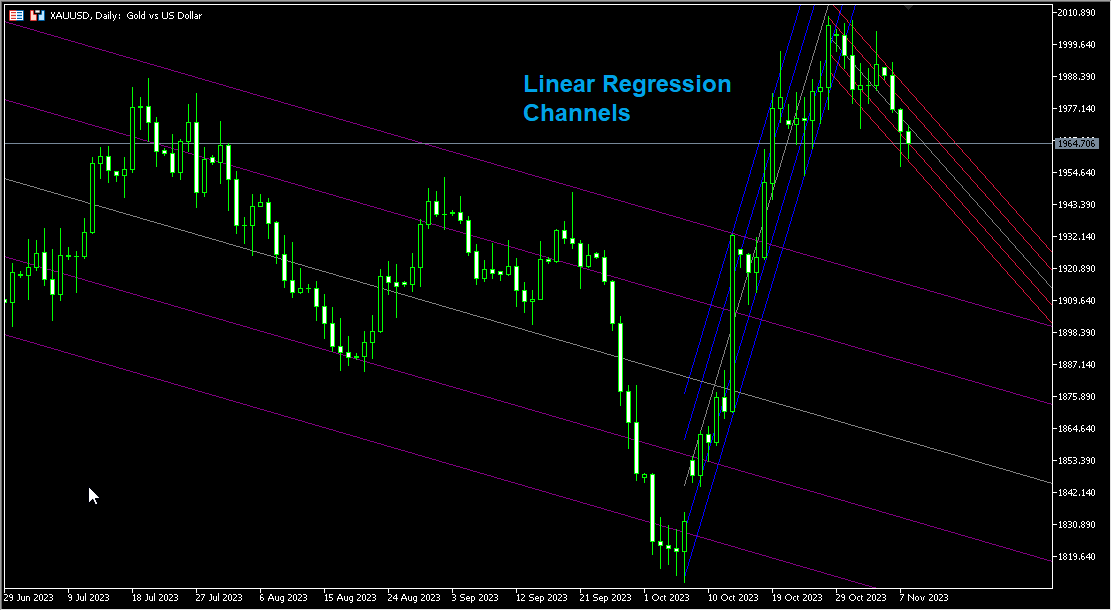
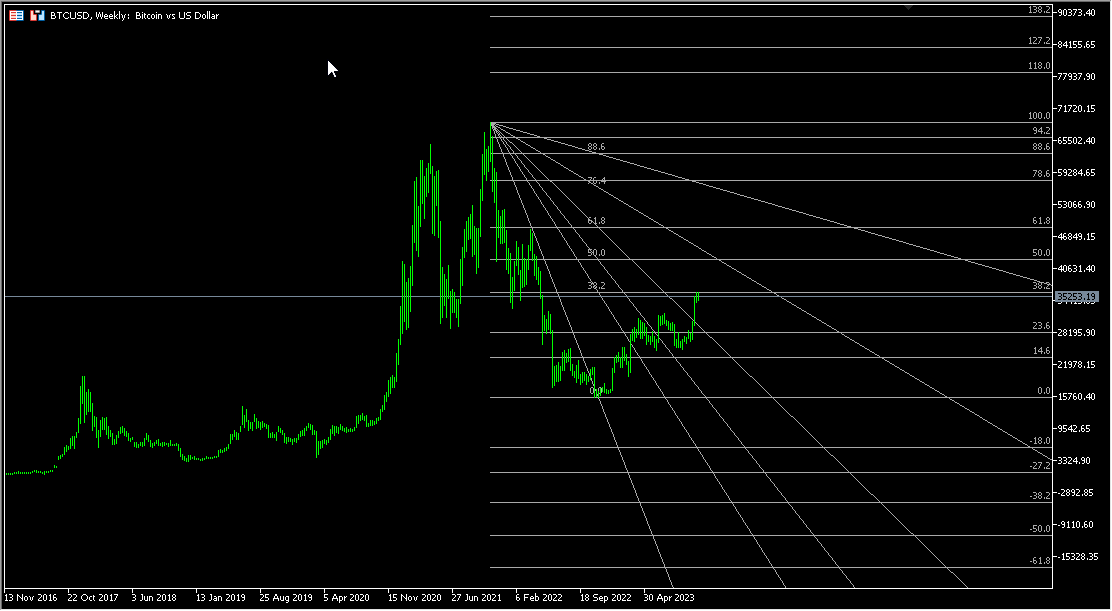
- In addition, the indicator also has the functions of drawing Fibonacci Retracement levels, Fibonacci Fan lines and Linear Regression channels when pressing the corresponding shortcut keys.
- Shift + I: Show or hide the start time, price level and number of touches of all S&R lines. I = (I)nformation.
- Shift + F: Show or hide the Fibonacci Retracement levels, Fibonacci Fan lines. F = (F)ibo.
- Shift + L: Show or hide the Linear Regression channels. L = (L)inear.
- Shift + H: Show or hide all S&R lines. H = (H)ide.
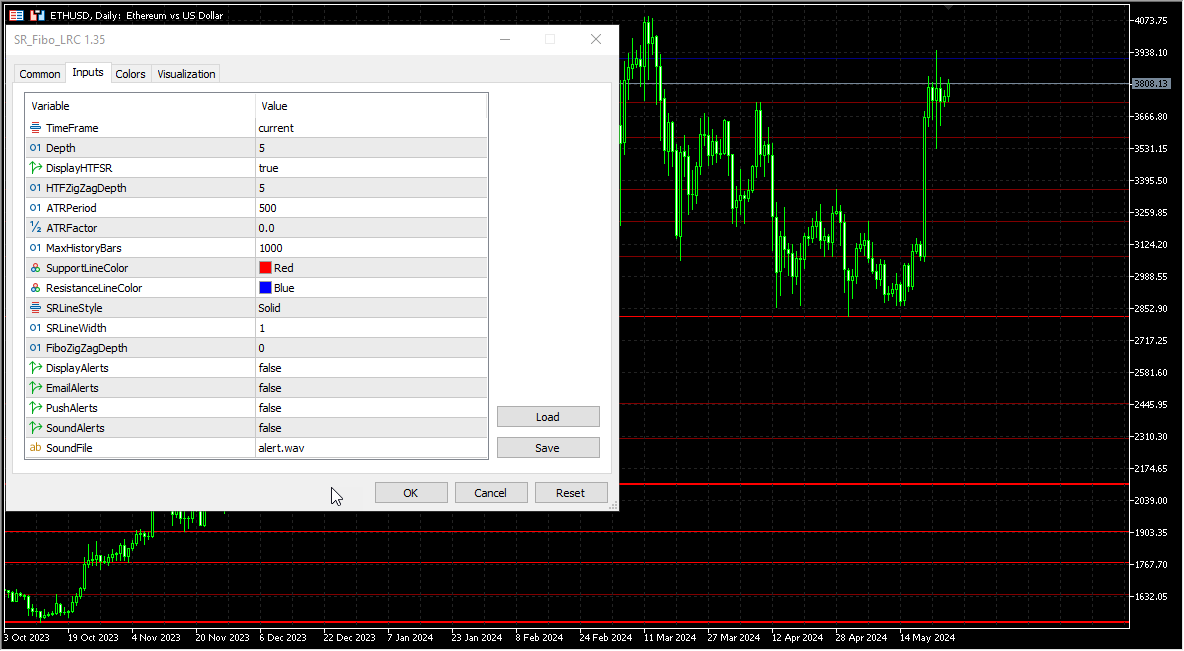
Input parameters
- TimeFrame - Choose the Timeframe to analyze. Can be current or higher.
- Depth - The minimum of the candles on which the ZigZag will not make a new extreme.
- DisplayHTFSR - Display additional support and resistance levels based on higher timeframes than the selected 'TimeFrame' value.
- HTFZigZagDepth - ZigZag depth of higher timeframes.
- ATRPeriod - ATR Period used to adjust the distance between S&R lines.
- ATRFactor - A higher ATR Factor value will produce fewer S&R lines. Zero means the indicator will choose the best value.
- MaxHistoryBars - The number of bars for calculation (to speed up the calculations and reduce the CPU usage).
- SupportLineColor - Color of the support lines.
- ResistanceLineColor - Color of the resistance lines.
- SRLineStyle - Style of the support/resistance lines.
- SRLineWidth - Width of the support/resistance lines.
- FiboZigZagDepth - The depth of the zigzag for drawing fibonacci lines. Zero means the indicator will choose the best value.
- DisplayAlerts - Display alerts (pop-up) when touching a level.
- EmailAlerts - Send alerts via email when touching a level.
- PushAlerts - Send alerts to mobile when touching a level.
- SoundAlerts - Play sound alerts when touching a level.
- SoundFile - Name of the sound file.