• Genel bakış
  • İncelemeler (1)
  • Yorumlar
  • Yenilikler

Double PSAR AM

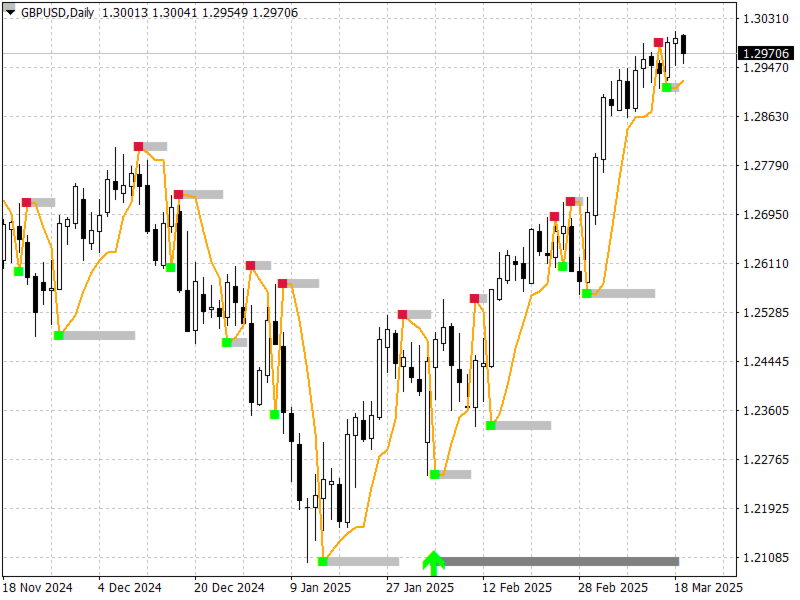
This indicator is the author's implementation of the classic indicator Parabolic Support and Resist (PSAR).

A time-tested product that allows you to not only determine entry/exit points but also reasonable levels for setting protective stop orders.

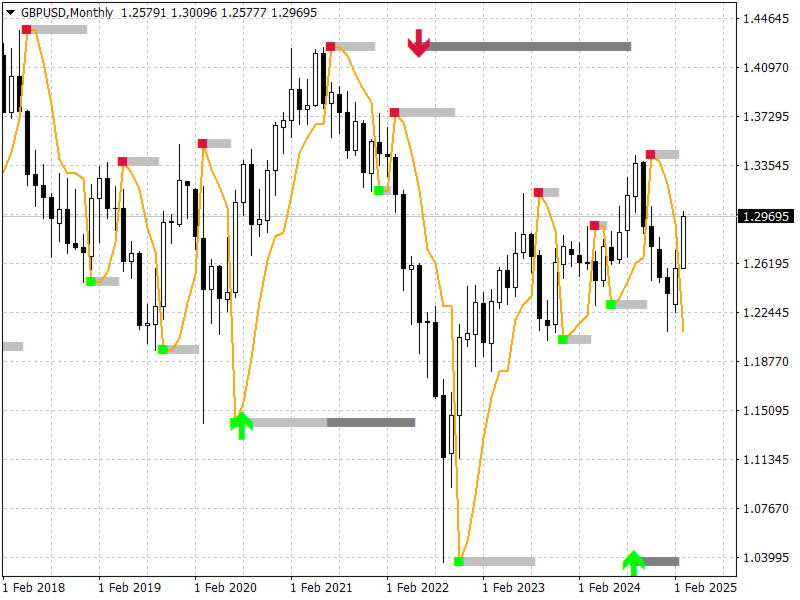
The indicator has two customizable ranges, which allows you to identify long-term and short-term trends.

The indicator does not repaint on the data history.

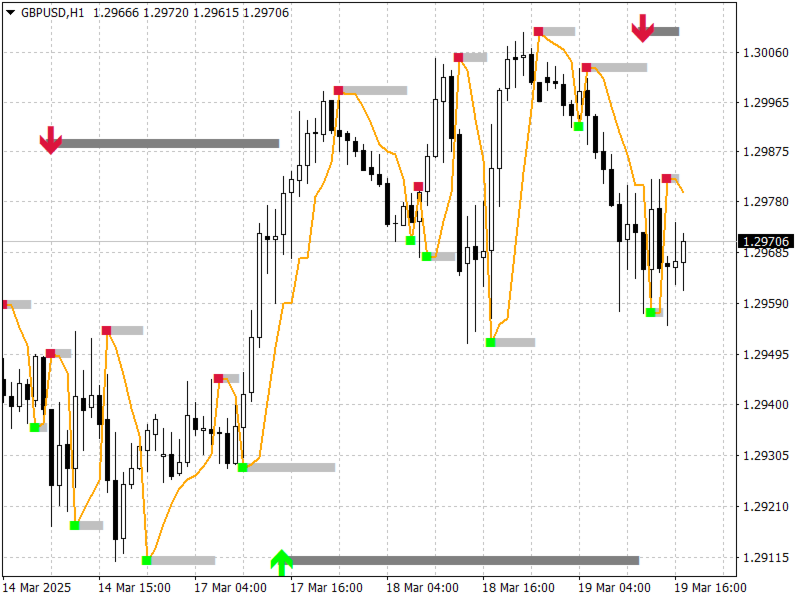
The indicator has the ability to give signals and send notifications about them to e-mail and the terminal.

Customizable indicator parameters:

  • Smal_Step - step size for fast PSAR;
  • Smal_Maximum - step indent for fast PSAR;
  • Big_Step - step size for slow PSAR;
  • Big_Maximum - step indent for slow PSAR;
  • Fast_line_style - display style for the fast PSAR line;
  • Slow_line_style - display style for the slow PSAR line;
  • Fast_signal_IN_TREND - the indicator displays fast PSAR signals if they match slow PSAR signals;
  • Fast_signal_UN_TREND - the indicator displays fast PSAR signals even if they do not match slow PSAR signals;
  • Slow_signal - the indicator displays slow PSAR signals;
  • Fast_signal_style - display style for the fast PSAR signal;
  • Slow_signal_style - display style for the slow PSAR signal;
  • Alerts - the indicator displays a dialog box containing user data;
  • Send_Mail - the indicator sends an email to the address specified in the settings window on the "Mail" tab;
  • Send_Notification - the indicator sends a notification to mobile terminals whose MetaQuotes IDs are specified in the settings window on the "Notifications" tab.


Önerilen ürünler
Multi Andrew PitchFork
Kourosh Hossein Davallou
5 (1)
ANDREW’S PITCHFORK TRADING STRATEGY       Essentially, Andrew’s Pitchfork is a tool for drawing price channels. While two lines surrounding price are usually enough to draw a channel, the Pitchfork has an extra line. It is the median line or the handle of the Pitchfork.     The median line is central to this trading method. This is why Andrew’s Pitchfork is also known as the Median Line Method. TRADING RULES      There are many ways to trade using Andrew’s Pitchfork but the basic idea is that pr
A top-quality from the famous XSuper Trend indicator. It is completely loyal to the original algorithm, and implements many useful features Which includes Trend Indicators as Filters like MACD,CCI and Alligator. The Chefs Super Trend Plus Indicator is a great way to identify the current market trend. The indicator shows a clear distinction between uptrends and downtrends. The indicators has optional filters for sound signal. Suitable for the following trending pairs: EUR/USD, GBP/USD, USD/JPY,
FIBO Trend PRO mt4
Evgenii Aksenov
5 (6)
The indicator allows you to instantly determine the current trend by color and FIBO levels. Higher Timeframe the panel shows the current trend of higher periods, helping to determine the strength of the trend Trade according to the trend when changing the color of candles or trade against the trend when the price hit the extreme levels of the   FIBO Trend PRO  indicator     Advantages of the FIBO Trend PRO Indicator never repaint and does not change their values Very easy to use and intuitive
Summary This indicator is based on RSI and Momentum indicators. It also considers moving averages of these two indicators. The three indicators have adjustable settings. The arrows do not repaint since the indicator only uses confirmed values and waits for the candle to close before painting an arrow. The indicator is also able to alert when arrows appear. There are 3 types of alerts - Popup, Email and Mobile Push Notifications. The arrows can be used in the EA and the inputs can also be optimiz
FREE
Description of the Indicator Trend Stop shows the highest/lowest value of the last N periods. Can help traders identify the trend direction and potential stop levels.    Use Trend Stop indicator to detects the trend direction. Downtrend if the price crosses the Trend Stop line upwards  Uptrend if the price crosses the Trend Stop line downwards  Use Trend Stop indicator to  define  optimal stop levels. Downtrend Place your stops    above the Trend Stop line Uptrend Place your stops below the T
First Dawn
Innovicient Limited
The First Dawn indicator uses a unique mechanism to search and plot signals. This keeps searching for signals, making it a great indicator for scaping and identification of changes in direction, swing trading and trend trading. The  First Dawn   helps you get early signals. The backtest gives the true picture of how the indicator works with real/demo accounts. Although this is a tiny indicator it is packed with advantageous settings that will help you whether you desire to: Snap the Peaks and
Trend Divergence Indicator: Your Essential Tool for Market Analysis The Trend Divergence Indicator is a powerful tool designed to assist traders in identifying market trends and pinpointing entry points with precision. By leveraging price divergence, this indicator enhances your trading strategy, offering reliable insights and filtering unnecessary signals. Key Features and Benefits of the Trend Divergence Indicator Accurate Trend Analysis: The Trend Divergence Indicator uses price divergence t
SFO Trend Racer
Tevin Marshall
5 (1)
SFO Trend Racer system is a trend indicator created by the CEO and Founder of " Simple Forex Options ", Tevin Marshall . It serves 6 different functions all in one. It shows the trader the entry signals as well as exit signals, whether it is a take profit or a stop loss. It also uses trend filters and signal confirmations so that the trader is able to make the most logically fit decision. Trend Racer uses various filters and specific settings from a plethora of indicators. The beauty in this ind
Colored indicator of the linear channel based on the Fibonacci sequence. It is used for making trading decisions and analyzing market sentiment. The channel boundaries represent strong support/resistance levels, as they are the Fibonacci proportion levels. Users can select the number of displayed lines of channel boundaries on the chart by means of the input parameters. Attaching multiple instances of the indicator to the chart with different calculation periods leads to displaying a system of c
Precision Channel Indicator: Master the Market with Ease! Description : The Precision Channel Indicator is a powerful tool designed to help you better understand market trends and identify the optimal entry and exit points. With its intuitive channel visualization, you can easily spot price ranges and make smarter trading decisions. Key Features : Clear Channel Visualization: Instantly identify key support and resistance areas in the market. Efficient Trading Signals: Pinpoint critical buy and s
FREE
Over Trend MT4
Mansour Babasafary
Trend based indicator Identify trends with this indicator A simple-to-use trend indicator No complicated settings Attributes: Can be used in all symbols Can be used in all time frames Relatively high signals No complicated settings Specific to the trend Lifetime support Settings: Alarm Show Alert: By activating these settings, after receiving the signal, you will receive an alarm in Metatrader Alarm Show Notification: By activating these settings, after receiving the signal, you will receive a
The indicator plots flexible support and resistance levels (dots). A special phase of movement is used for construction. Levels are formed dynamically, that is, each new candle can continue the level or complete it. The level can provide resistance or support to the price even where it is no longer there. Also, support and resistance levels can change roles. The importance of levels is affected by: the amount of time the level is formed and the number of touches. The significance of these lev
The indicator draws trend lines based on Thomas Demark algorithm. It draws lines from different timeframes on one chart. The timeframes can be higher than or equal to the timeframe of the chart, on which the indicator is used. The indicator considers breakthrough qualifiers (if the conditions are met, an additional symbol appears in the place of the breakthrough) and draws approximate targets (target line above/below the current prices) according to Demark algorithm. Recommended timeframes for t
Trend MagicX
Hafis Mohamed Yacine
A trending market is one in which price is generally moving in one direction. ... When trading a trend-based strategy, traders usually pick the major currencies as well as any other currency utilizing the dollar because these pairs tend to trend and be more liquid than other pairs.  Best Trend Indicator That Tells You the Direction of the Trend   Trend MagicX_v1.1 displays the trend direction, duration, intensity and the resulting trend rating for all time frames in real time. You'll see at a
Global Trend
Vitalii Zakharuk
Global Trend Indicator, shows the signals for entry. Displays both entry points and the trend itself. Shows statistically calculated moments for entering the market with arrows. When using the indicator, the risk factor can be optimally distributed. Settings: Uses all one parameter for settings. Choosing a parameter, it is necessary to visually resemble it so that the appropriate graph has a projection of extremes. Parameters: Length - the number of bars for calculating the indicator. Use
Bu işlem aracıyla aynı anda 15 piyasayı tarayabilirsiniz. Karşınızda yeni ticaret göstergesi 2024: ️ Kontrol Paneli Çoklu Para Birimi Çoklu Zaman Çerçevesi Stokastik. Bu ticaret aracını oluşturmamın en az iki nedeni var: Öncelikle tek piyasayı gözlemlemekten sıkıldım. İkincisi, başka bir pazara giriş anını kaybetmek istemiyorum. Bu yüzden aynı zamanda diğer piyasa koşullarını da bilmek istiyorum. Bu nedenle birden fazla piyasanın koşullarını aynı anda tarayabilecek bir tarayıcıya ihtiyac
DMI Smoothed CCI plus: Track Market Trends and Reversals Across Multiple Timeframes The DMI Smoothed CCI plus is a powerful tool for traders, designed to analyze market trends and potential reversals using the Commodity Channel Index (CCI) across multiple timeframes. Ideal for trend-following strategies, this indicator helps you spot overbought and oversold conditions, providing real-time insights that are crucial for optimizing your market entries and exits. Key Features: Multi-Timeframe Analy
Dynamic SR Trend Channel Dynamic SR Trend Channel is a simple indicator for trend detection as well as resistance/support levels on the current timeframe. It shows you areas where to expect possible change in trend direction and trend continuation. It works with any trading system (both price action and other trading system that use indicators) and is also very good for renko charting system as well. In an uptrend, the red line (main line) serves as the support and the blue line serves as the r
This indicator uses the Fibonacci p-numbers to smooth a price series. This allows combining the advantages of the simple and exponential moving averages. The smoothing coefficients depend on the level of the p-number, which is set in the indicator parameters. The higher the level, the greater the influence of the simple moving average and the less significant the exponential moving average. Parameters Fibonacci Numbers Order - order of the Fibonacci p-number, specified by trader. Valid values a
Simply drop the indicator to the graph and support and resistance levels will be shown automatically! The indicator for automatic drawing of support and resistance levels based on THREE points. Identified points are marked on the chart Indicator shows break through price for both bullish and bearish trends (if found) You can specify on how many bars the indicator shall look in order to identify supporting points. In addition, you can select on which time frame the indicator will work. That means
Moving Pivot Average    The pivot indicator compares the selected period with its counterpart from the previous period. The indicator uses very flexible algorithm for pivot value calculating. It allows you to allocate in days a certain time intervals (custom bars) and calculate the average pivot value based on High, Low and Close prices of these bars. How many custom bars will be taken into account is determined by the "Days" setting. The pivot line can be considered an average trend line and us
For this set of indicators 1. General information     - Calculates with high performance mathematical algorithms.     - Calculated from the price of candles     - The entry point of this order is filtered by the train EMA and the oscillator.     - Calculate the integrity of the candle 2. How does it work?     - You can see two types of order entry points: the notification on the monitor and the arrow.     - You can trust 75-95 percent of this entry point. 3. Settings     - A complete candle i
Stoch Color Indicator
Adrian Hernandez Castellanos
Stokastik Osilatör Renklendirme Bu gösterge, göstergenin trendine göre arka planı renklendirir. Gösterge, %K ve %D değerlerine göre arka planı renklendirir. Trend yukarı veya aşağı yönlü olsun, arka plan rengi stokastik osilatör parametreleri tarafından belirlenir. Ancak, yalnızca son 400 çubuk çizilir (notlara bakın). Değiştirilebilir parametreler: %K Period : %K dönemi %D Period: %D dönemi Slowing: Yavaşlama dönemi Price Field : Low/High, Close/Close MA Method: Simple, Exponential, Smoothed, L
For this set of indicators 1. General information     - Calculates with high performance mathematical algorithms.     - Calculated from the price of candles     - The entry point of this order is filtered by the train EMA and the oscillator.     - Calculate the integrity of the candle 2. How does it work?     - You can see two types of order entry points: the notification on the monitor and the arrow.     - You can trust 75-95 percent of this entry point. 3. Settings     - A complete candle i
Introduction In the fast-paced world of financial market trading, success often hinges on the ability to spot and leverage trends. Among the various strategies available, momentum trading stands out as a powerful tool for traders seeking to capitalize on market movements. In this article, we will delve into the concept of momentum, its significance in trading, and the numerous benefits it offers to traders. What is Momentum? Momentum in trading refers to the tendency of assets to continue moving
Fibo label
Damir Satridinov
5 (1)
Индикатор рисует уровни Фибоначчи с выделенными Ценовыми метками.При установке индикатора на график необходимо создать трендовую линию с именем указанным в поле" Unique name of trend line to place fib on ". По умолчанию имя=" Unique name of trend line to place fib on"  =     "+"    .В индикаторе можно заменить уровни фибоначчи по своему усмотрению.Также меняются цвет,стиль,толщина линий и т. д.
FREE
If you are unsure how to use this indicator, please feel free to reach out to me. I will explain it to you and provide reading materials to help you make the most of it. Here’s a brief description of how to use the indicator effectively. How to Use TD Sequential by Tom DeMark The TD Sequential is a technical analysis indicator developed by Tom DeMark, designed to identify potential turning points in market trends. It is widely used by traders to anticipate market reversals and manage trading ris
RSI Divergence Finder Indicator will help you to find Classic Divergences between your typical RSI values and the Chart Prices as potential points of actual Trend Reversion or Pull Backs to increase your positions as per the current Trend. In some computer/VPS with old microprocessors or low RAM size, when you launch this Indicator (attach it, change settings, reset or even timeframe change) as it analyze the Chart to avoid refreshing what is not changing, it is possible to experience a bit of l
Introducing the Trend Detection System: Your Key to Unveiling Market Trends with Precision. The Trend Detection System is a sophisticated MetaTrader 4 indicator meticulously engineered to equip traders with the tools needed to identify and ride market trends effectively. Built upon customized Moving Average principles, this innovative indicator offers unparalleled flexibility and accuracy in trend analysis. Key Features: 1. Customized Moving Average: The Trend Detection System allows users to
Three Line Strike Finder
Thomas Christopher Johnson
The three line strike pattern, which consists of three bullish or bearish candles, and a fourth candle that is larger than the previous three in the opposite direction, can be traded many ways.  This indicator simply highlights those previous trades, and then pushes out targets in the direction of the last candle. Advantages of three line strike The three line strike can be traded as part of a bullish and bearish engulfing pattern, 2 bar reversal set up and n-Bar rallies and declines. How it w
Bu ürünün alıcıları ayrıca şunları da satın alıyor
Gann Made Easy
Oleg Rodin
4.8 (117)
Gann Made Easy , bay teorisini kullanarak ticaretin en iyi ilkelerine dayanan, profesyonel ve kullanımı kolay bir Forex ticaret sistemidir. WD Gann. Gösterge, Zararı Durdur ve Kâr Al Seviyeleri dahil olmak üzere doğru SATIN AL ve SAT sinyalleri sağlar. PUSH bildirimlerini kullanarak hareket halindeyken bile işlem yapabilirsiniz. Lütfen satın aldıktan sonra benimle iletişime geçin! Alım satım ipuçlarımı ve harika bonus göstergelerini ücretsiz olarak sizinle paylaşacağım! Muhtemelen Gann ticaret y
Şu anda %20 İNDİRİMLİ! Herhangi bir Acemi veya Uzman Tüccar için En İyi Çözüm! Bu gösterge paneli yazılımı 28 döviz çifti üzerinde çalışıyor. Ana göstergelerimizden 2'sine (Gelişmiş Para Birimi Gücü 28 ve Gelişmiş Para Birimi Dürtüsü) dayanmaktadır. Tüm Forex piyasasına harika bir genel bakış sağlar. Gelişmiş Para Birimi Gücü değerlerini, para birimi hareket hızını ve tüm (9) zaman dilimlerinde 28 Forex çifti için sinyalleri gösterir. Trendleri ve / veya scalping fırsatlarını belirlemek için
Cycle Maestro
Stefano Frisetti
NOTE: CYCLEMAESTRO is distributed only on this website, there are no other distributors. Demo version is for reference only and is not supported. Full versione is perfectly functional and it is supported CYCLEMAESTRO , the first and only indicator of Cyclic Analysis, useful for giving signals of TRADING, BUY, SELL, STOP LOSS, ADDING. Created on the logic of Serghei Istrati and programmed by Stefano Frisetti ; CYCLEMAESTRO is not an indicator like the others, the challenge was to interpret only t
Scalper Inside PRO
Alexey Minkov
4.76 (63)
!SPECIAL SALE! An exclusive indicator that utilizes an innovative algorithm to swiftly and accurately determine the market trend. The indicator automatically calculates opening, closing, and profit levels, providing detailed trading statistics. With these features, you can choose the most appropriate trading instrument for the current market conditions. Additionally, you can easily integrate your own arrow indicators into Scalper Inside Pro to quickly evaluate their statistics and profitability
Golden Trend Indicator
Noha Mohamed Fathy Younes Badr
5 (10)
Golden Trend indicator  is The best indicator for predicting trend movement this indicator never lags and never repaints and never back paints    and give  arrow buy and sell    before the candle appear  and it will help you and  will make your trading decisions clearer its work on all currencies and  gold and crypto and all time frame This unique  indicator uses very secret algorithms to catch the  trends, so you can trade using this indicator and see the trend clear on charts  manual guide and
Algo Pumping MT4
Ihor Otkydach
5 (5)
PUMPING STATION – Kişisel “her şey dahil” stratejiniz Karşınızda PUMPING STATION — forex dünyasında işlem yapma şeklinizi heyecan verici ve etkili bir sürece dönüştürecek devrim niteliğinde bir gösterge. Bu sadece bir yardımcı değil, güçlü algoritmalarla donatılmış tam teşekküllü bir ticaret sistemidir ve daha istikrarlı işlem yapmanıza yardımcı olur. Bu ürünü satın aldığınızda ŞUNLARI ÜCRETSİZ olarak alırsınız: Özel ayar dosyaları: Otomatik kurulum ve maksimum performans için. Adım adım video e
GOLD Impulse with Alert
Bernhard Schweigert
4.6 (10)
Bu gösterge, 2 ürünümüz Advanced Currency IMPULSE with ALERT  +   Currency Strength Exotics  'in süper bir kombinasyonudur. Tüm zaman dilimleri için çalışır ve 8 ana para birimi artı bir Sembol için grafiksel olarak güç veya zayıflık dürtüsünü gösterir! Bu Gösterge, Altın, Egzotik Çiftler, Emtialar, Endeksler veya Vadeli İşlemler gibi herhangi bir sembol için para birimi gücü ivmesini göstermek için uzmanlaşmıştır. Türünün ilk örneğidir, Altın, Gümüş, Petrol, DAX, US30, MXN, TRY, CNH vb. içi
Easy Breakout
Mohamed Hassan
5 (11)
After your purchase, feel free to contact me for more details on how to receive a bonus indicator called VFI, which pairs perfectly with Easy Breakout for enhanced confluence!   Easy Breakout is a powerful price action trading system built on one of the most popular and widely trusted strategies among traders: the Breakout strategy ! This indicator delivers crystal-clear Buy and Sell signals based on breakouts from key support and resistance zones. Unlike typical breakout indicators, it levera
M1 Arrow
Oleg Rodin
5 (17)
Piyasanın iki temel ilkesine dayanan bir gün içi stratejisi. Algoritma, ek filtreler kullanarak hacimlerin ve fiyat dalgalarının analizine dayanmaktadır. Göstergenin akıllı algoritması, yalnızca iki piyasa faktörü bir araya geldiğinde bir sinyal verir. Gösterge, daha yüksek zaman çerçevesinin verilerini kullanarak M1 grafiğinde belirli bir aralıktaki dalgaları hesaplar. Ve dalgayı doğrulamak için gösterge, hacme göre analizi kullanır. Bu gösterge hazır bir ticaret sistemidir. Bir tüccarın ihtiya
Enigmera
Ivan Stefanov
5 (7)
ENIGMERA: Pazarın Kalbi Önemli: MQL5.com demosu Strategy Tester'da çalışır ve Enigmera'nın tüm işlevlerini tam olarak yansıtmayabilir. Daha fazla bilgi için açıklamayı, ekran görüntülerini ve videoyu kontrol edin. Herhangi bir sorunuz varsa, bana mesaj göndermekten çekinmeyin! Göstergenin kodu tamamen yeniden yazılmıştır. 3.0 sürümü, yeni işlevler ekler ve göstergenin başlangıcından bu yana biriken hataları giderir. Giriş Bu gösterge ve ticaret sistemi, finansal piyasalara dikkat çekici bir ya
PZ Harmonacci Patterns
PZ TRADING SLU
3.17 (6)
Trade smarter, not harder: Empower your trading with Harmonacci Patterns This is arguably the most complete harmonic price formation auto-recognition indicator you can find for the MetaTrader Platform. It detects 19 different patterns, takes fibonacci projections as seriously as you do, displays the Potential Reversal Zone (PRZ) and finds suitable stop-loss and take-profit levels. [ Installation Guide | Update Guide | Troubleshooting | FAQ | All Products ] It detects 19 different harmonic pric
TPSproTREND PrO
Roman Podpora
4.68 (25)
VERSION MT5        —        ИНСТРУКЦИЯ RUS           —        INSTRUCTIONS  ENG Ana işlevler: VERME OLMADAN doğru giriş sinyalleri! Bir sinyal belirirse, alakalı kalır! Bu, bir sinyal sağlayıp daha sonra onu değiştirebilen ve mevduatta fon kaybına yol açabilen yeniden çekme göstergelerinden önemli bir farktır. Artık pazara daha büyük bir olasılık ve doğrulukla girebilirsiniz. Ayrıca, ok göründükten sonra hedefe ulaşılıncaya kadar (kar al) veya bir geri dönüş sinyali görünene kadar mumları renkl
Dynamic Forex28 Navigator
Bernhard Schweigert
5 (5)
Dynamic Forex28 Navigator - Yeni Nesil Forex Ticaret Aracı. ŞU ANDA %49 İNDİRİM. Dynamic Forex28 Navigator, uzun zamandır popüler olan göstergelerimizin evrimidir ve üçünün gücünü tek bir göstergede birleştirir: Gelişmiş Döviz Gücü28 Göstergesi (695 inceleme) + Gelişmiş Döviz İMPULS ve UYARI (520 inceleme) + CS28 Kombo Sinyalleri (Bonus). Gösterge hakkında ayrıntılar https://www.mql5.com/en/blogs/post/758844 Yeni Nesil Güç Göstergesi Ne Sunuyor?  Orijinallerde sevdiğiniz her şey, şimdi yeni
FX Power MT4 NG
Daniel Stein
4.94 (18)
FX Power: Daha Akıllı Ticaret Kararları için Para Birimlerinin Gücünü Analiz Edin Genel Bakış FX Power , her piyasa koşulunda başlıca para birimlerinin ve altının gerçek gücünü anlamak için vazgeçilmez bir araçtır. Güçlü para birimlerini alıp zayıf olanları satarak, FX Power ticaret kararlarınızı basitleştirir ve yüksek olasılıklı fırsatları ortaya çıkarır. İster trendlere sadık kalın ister Delta'nın aşırı değerlerini kullanarak tersine dönüşleri öngörün, bu araç ticaret tarzınıza mükemmel bir
RelicusRoad Pro
Relicus LLC
4.63 (104)
Şimdi 147 $ (birkaç güncellemeden sonra 499 $ 'a yükseliyor) - Sınırsız Hesaplar (PC'ler veya Mac'ler) RelicusRoad Kullanım Kılavuzu + Eğitim Videoları + Özel Discord Grubuna Erişim + VIP Durumu PİYASAYA BAKMAK İÇİN YENİ BİR YOL RelicusRoad, forex, vadeli işlemler, kripto para birimleri, hisse senetleri ve endeksler için dünyanın en güçlü ticaret göstergesidir ve yatırımcılara kârlı kalmaları için ihtiyaç duydukları tüm bilgileri ve araçları sağlar. Başlangıç ​​seviyesinden ileri seviyeye ka
Advanced Supply Demand
Bernhard Schweigert
4.91 (294)
CURRENTLY 26% OFF !! Best Solution for any Newbie or Expert Trader! This indicator is a unique, high quality and affordable trading tool because we have incorporated a number of proprietary features and a new formula. With this update, you will be able to show double timeframe zones. You will not only be able to show a higher TF but to show both, the chart TF, PLUS the higher TF: SHOWING NESTED ZONES. All Supply Demand traders will love it. :) Important Information Revealed Maximize the potentia
Volatility Trend System - girişler için sinyaller veren bir ticaret sistemi. Oynaklık sistemi, trend yönünde doğrusal ve noktasal sinyaller ve ayrıca yeniden çizme ve gecikme olmaksızın trendden çıkmak için sinyaller verir. Trend göstergesi, orta vadeli trendin yönünü izler, yönünü ve değişimini gösterir. Sinyal göstergesi volatilitedeki değişikliklere dayalıdır ve piyasa girişlerini gösterir. Gösterge, çeşitli uyarı türleri ile donatılmıştır. Çeşitli alım satım araçlarına ve zaman dilimlerine
Scalper Vault
Oleg Rodin
5 (29)
Scalper Vault , başarılı bir scalping için ihtiyacınız olan her şeyi size sağlayan profesyonel bir scalping sistemidir. Bu gösterge, forex ve ikili opsiyon tüccarları tarafından kullanılabilecek eksiksiz bir ticaret sistemidir. Önerilen zaman çerçevesi M5'tir. Sistem size trend yönünde doğru ok sinyalleri sağlar. Ayrıca size üst ve alt sinyaller ve Gann piyasa seviyeleri sağlar. Göstergeler, PUSH bildirimleri dahil her türlü uyarıyı sağlar. Göstergeyi satın aldıktan sonra lütfen benimle iletişim
KT Renko Patterns MT4
KEENBASE SOFTWARE SOLUTIONS
2.33 (3)
KT Renko Patterns, Renko grafiğini tuğla tuğla tarayarak, farklı finansal piyasalarda yatırımcılar tarafından sıkça kullanılan popüler grafik formasyonlarını tespit eder. Zaman tabanlı grafiklerle karşılaştırıldığında, Renko grafiklerinde işlem yapmak daha kolay ve belirgindir çünkü grafik sade ve temiz bir yapıya sahiptir. KT Renko Patterns birçok Renko formasyonunu içerir ve bunların çoğu Prashant Shah'ın “Renko Grafikleriyle Karlı Ticaret” adlı kitabında ayrıntılı olarak açıklanmıştır. Bu g
"Chart Patterns All in One" ürününü demo modunda deneyin ve bonus kazanın. Demo modunda denedikten sonra bana mesaj göndererek bonusunuzu alın. Satın aldıktan sonra yorum bırakın, bonus olarak 8 yüksek kaliteli gösterge alın. Chart Patterns All-in-One göstergesi, traderların teknik analizde yaygın olarak kullanılan çeşitli grafik desenlerini görselleştirmelerine yardımcı olur. Bu gösterge, potansiyel piyasa hareketlerini belirlemeye yardımcı olur ancak kârlılığı garanti etmez. Satın almadan önc
Quantum Breakout Indicator PRO
Bogdan Ion Puscasu
4.96 (26)
Tanıtım       Quantum Breakout PRO   , Breakout Bölgeleri ile ticaret yapma şeklinizi değiştiren çığır açan MQL5 Göstergesi! 13 yılı aşkın ticaret deneyimine sahip deneyimli tüccarlardan oluşan bir ekip tarafından geliştirilen   Quantum Breakout PRO   , yenilikçi ve dinamik koparma bölgesi stratejisiyle ticaret yolculuğunuzu yeni zirvelere taşımak için tasarlanmıştır. Kuantum Breakout Göstergesi, size 5 kar hedefi bölgesi ile kırılma bölgelerinde sinyal okları ve kırılma kutusuna dayalı olara
MTF Supply Demand Zones
Georgios Kalomoiropoulos
4.82 (22)
Yeni Nesil Otomatik Arz ve Talep Bölgeleri. Her Grafikte Çalışan Yeni ve Yenilikçi Algoritma. Tüm Bölgeler Piyasanın Fiyat Hareketine Göre Dinamik Olarak Oluşturulmaktadır. İKİ TÜR UYARI --> 1) FİYAT BİR BÖLGEYE ÇIKTIĞINDA 2) YENİ BİR BÖLGE OLUŞTURDUĞUNDA Bir tane daha işe yaramaz gösterge almazsın. Kanıtlanmış Sonuçlarla eksiksiz bir Ticaret Stratejisi elde edersiniz.     Yeni özellikler:     Fiyat Arz/Talep Bölgesine ulaştığında uyarılar     Yeni bir Arz/Talep Bölgesi oluşturulduğunda
Bu, bir mumun kapanış fiyatını tahmin eden bir göstergedir. Gösterge öncelikle D1 çizelgelerinde kullanılmak üzere tasarlanmıştır. Bu gösterge hem geleneksel forex ticareti hem de ikili opsiyon ticareti için uygundur. Gösterge, bağımsız bir ticaret sistemi olarak kullanılabilir veya mevcut ticaret sisteminize ek olarak hareket edebilir. Bu gösterge, mevcut mumu analiz ederek mumun gövdesi içindeki belirli güç faktörlerini ve önceki mumun parametrelerini hesaplar. Böylece gösterge, piyasa hareket
FX Volume
Daniel Stein
4.6 (35)
FX Volume: Bir Broker’ın Perspektifinden Gerçek Piyasa Duyarlılığını Deneyimleyin Kısa Özet Trading yaklaşımınızı bir adım öteye taşımak ister misiniz? FX Volume , perakende traderlar ile brokerların nasıl konumlandığını gerçek zamanlı olarak sunar—COT gibi gecikmeli raporlardan çok daha önce. İster istikrarlı kazançları hedefliyor olun, ister piyasada daha güçlü bir avantaj arayın, FX Volume önemli dengesizlikleri belirlemenize, kırılmaları (breakout) doğrulamanıza ve risk yönetiminizi iyileş
Currency Strength Exotics
Bernhard Schweigert
4.88 (32)
ŞU ANDA %20 INDIRIMLI! Herhangi bir Acemi veya Uzman Tüccar için En İyi Çözüm! Bu Gösterge, Egzotik Çiftler Emtialar, Endeksler veya Vadeli İşlemler gibi herhangi bir sembol için para birimi gücünü göstermek için uzmanlaşmıştır. Türünün ilk örneğidir, Altın, Gümüş, Petrol, DAX, US30, MXN, TRY, CNH vb. gerçek para birimi gücünü göstermek için 9. satıra herhangi bir sembol eklenebilir. Bu benzersiz, yüksek kaliteli ve uygun fiyatlı bir ticaret aracıdır çünkü bir dizi tescilli özelliği ve yeni b
Matrix Arrow Indicator MT4
Juvenille Emperor Limited
5 (3)
Matrix Arrow Indicator MT4 , forex, emtialar, kripto para birimleri, endeksler, hisse senetlerigibi tüm sembollerde/araçlarda kullanılabilen %100 yeniden boyamayan çoklu zaman çerçevesi göstergesini izleyen benzersiz bir 10'u 1 arada trenddir.  Matrix Arrow Indicator MT4 , mevcut eğilimi erken aşamalarında belirleyecek ve aşağıdakiler gibi 10'a kadar standart göstergeden bilgi ve veri toplayacaktır: Ortalama Yönlü Hareket Endeksi (ADX) Emtia Kanal Endeksi (CCI) Klasik Heiken Ashi mumları Hareke
Blahtech Supply Demand
Blahtech Limited
4.58 (36)
Was: $299  Now: $149   Supply Demand uses previous price action to identify potential imbalances between buyers and sellers. The key is to identify the better odds zones, not just the untouched ones. Blahtech Supply Demand indicator delivers functionality previously unavailable on any trading platform. This 4-in-1 indicator not only highlights the higher probability zones using a multi-criteria strength engine, but also combines it with multi-timeframe trend analysis, previously confirmed swings
Hydra Trend Rider is a non-repainting, multi-timeframe trend indicator that delivers precise buy/sell signals and real-time alerts for high-probability trade setups. With its color-coded trend line, customizable dashboard, and mobile notifications, it's perfect for traders seeking clarity, confidence, and consistency in trend trading. Download the Metatrader 5 Version Message us here after purchase to get the Indicator Manual. Download Now! Offer valid only for next 10 Buyers. Price will increas
Smart Set up Levels
Mohit Dhariwal
5 (1)
Smart Set up leve l is a very powerful indicator based on the concept of order blocks and set up entries with proper fvg and breakouts to make a very nice level to enter like a pro trader. Very easy to use interface and friendly to enter on buy and sell signals. Works Best on M15 Time frame on Gold, Bitcoin and Fx pairs. Daily 4-5 trades on each pair  Works great on gold like a pro on M15 It is non repainting nor lagging It is very powerful indicator giving precise entries and prop acts can be c
Automated Trendlines
Georgios Kalomoiropoulos
5 (16)
Trend çizgileri, forex ticaretinde en önemli teknik analiz aracıdır. Ne yazık ki, çoğu tüccar onları doğru şekilde çizmez. Otomatik Trend Çizgileri göstergesi, piyasaların trend hareketini görselleştirmenize yardımcı olan ciddi tüccarlar için profesyonel bir araçtır. İki tür Trend Çizgisi, Boğa Trend Çizgisi ve Ayı Trend Çizgisi vardır. Yükseliş trendinde, Forex trend çizgisi, fiyat hareketinin en düşük salınım noktalarından geçer. En az iki "en düşük düşük"ü birleştirmek, bir trend çizgisi o
Yazarın diğer ürünleri
Limit Levels AM
Andriy Matviyevs'kyy
The presented indicator sets dynamic support/resistance levels on the price chart. The support/resistance levels set by the indicator are reasonable levels for setting pending orders. The middle line of the indicator (Central level) helps to identify the current trend: If the closing price is above the central line - the trend is ascending. If the closing price is below the central line - the trend is descending. The indicator is easy to use and can be useful for both beginners and professional
FREE
Fractal Levels AM
Andriy Matviyevs'kyy
The presented indicator is an original development based on the idea embedded in the classic technical analysis indicator - Fractals. The Fractals indicator allows you to determine a significant trough or peak for analysis on the price chart of the financial instrument in question. The fractal itself on the price chart consists of candles, the middle of which is either the highest (up fractal) or the lowest (down fractal) of all the candles taken for analysis. The original indicator uses five ca
FREE
ADX Line AM
Andriy Matviyevs'kyy
4.75 (4)
This indicator, interpreting ADX and ATR data, clearly and accurately identifies the current trend, allowing the trader to get the most out of strong price movements. The indicator is intuitive to use: a change in line direction means a change in trend direction; a change in line color warns of an imminent change in direction. The indicator does not repaint and allows you to send notifications about its signals to a mobile terminal and email. Configurable parameters: ADX_Medium_Coefficient - the
FREE
MFI Signal AM
Andriy Matviyevs'kyy
5 (1)
This indicator displays signals on the price chart based on the data of the classic indicator - the Money Flow Index (MFI). The volume is taken into account when calculating the MFI values. MFI can be used to determine overbought or oversold zones in the market. This indicator allows you to display three types of signals on the price chart: MFI exit from the overbought or oversold zone; MFI entry into the overbought or oversold zone; MFI crossing the middle between the overbought and oversold zo
FREE
ADX Signal AM
Andriy Matviyevs'kyy
4.67 (3)
This indicator is an interpretation of the Average Directional Movement Index (ADX), which helps to determine the presence of a price trend. It was developed and described in detail in the book "New Concepts in Technical Trading Systems" by Welles Wilder. The presented indicator displays signals on the price chart when +DI and -DI cross and signals when the ADX value falls or rises in relation to the mutual arrangement of +DI and -DI. The indicator's buy signals also work as a support level, whi
FREE
SuperTrend AM
Andriy Matviyevs'kyy
5 (1)
The presented product is a trend indicator of technical analysis that builds dynamic support/resistance levels based on the volatility of a financial instrument. The indicator allows you to determine the entry points into the market at the moment the price overcomes dynamic support/resistance level and to set a reasonable level for fixing a loss/profit. The indicator is a simple and effective tool that (depending on the parameter settings) can be used in almost any market and for any trading st
FREE
EasyTrend AM
Andriy Matviyevs'kyy
5 (1)
The presented product is a trend indicator of technical analysis that allows you to open a position at the very beginning of a significant price movement. The most important qualities of the presented indicator are: The ability to follow the trend for as long as possible to get all the potential profit; Minimization of potential losses in case of a trend reversal or significant correction. The indicator has a wide range of customizable parameters allowing it to be used effectively in any market
FREE
Deep River AM
Andriy Matviyevs'kyy
The presented indicator is the author's implementation of the classic trading idea: Moving averages of different periods diverge over time on a strengthening trend and converge on a weakening trend. The proposed product allows you to clearly demonstrate: The direction of price movement; Temporary price rollbacks; Zones of multidirectional price movement. Namely: The indicator lines go up and diverge from each other - a strong bullish trend; The indicator lines go down and diverge from each othe
FREE
Fine Trade AM
Andriy Matviyevs'kyy
Sunulan gösterge, bir finansal enstrümanın oynaklığını değerlendirir ve yüksek verimlilikle fiyat hareketinin yönünde önemli değişiklik anları hakkında sinyaller verir. Gösterge sezgiseldir ve kullanımı kolaydır. Gösterge sinyali, göstergenin sıfıra göre konumunu değiştirdiği çubuğun oluşumunun tamamlanmasından sonra üretilir. Gösterge hiçbir zaman sinyali yeniden çizmez. Gösterge sinyalleri, göstergenin sıfıra göre konumunu değiştirdiği çubuğun maksimum/minimum değerini aşan fiyatla doğrulanmal
TTF Line AM
Andriy Matviyevs'kyy
The presented indicator draws a trend line and points of change in its direction on the price chart based on the TTF (Trend Trigger Factors) and ATR indicators. The indicator advantageously combines ease of use, speed of reaction to a change in trend direction and reliability of signals. The indicator is intuitive to use: Change in line direction - change in trend direction; Change in line color warns of an imminent change in direction. The indicator does not repaint and allows you to send notif
Bulls or Bears AM
Andriy Matviyevs'kyy
5 (1)
The presented indicator implements the idea embedded in the classic technical analysis indicators - "Bulls" / "Bears" at a new level. The "Bulls or Bears AM" indicator displays the difference between the maximum and minimum prices for the current period of time and the values ​​of the channel built on the maximum and minimum prices for a longer period. The growth of the indicator values ​​above zero indicates that the maximum price for the current period is greater than the average value of maxi
Market Pulse AM
Andriy Matviyevs'kyy
5 (1)
The presented indicator analyzes the direction of the short-term and long-term trend for specified periods, taking into account the volatility of the market. This approach allows combining high sensitivity of the indicator with a high probability of execution of its signals. The principle of use is extremely simple: the indicator histogram is greater than 0 - a buy signal / the indicator histogram is less than 0 - a sell signal. The indicator allows you to configure two types of parameters: fast
AlphaTrend AM
Andriy Matviyevs'kyy
The presented indicator, based on the volatility readings of a financial instrument and average price values ​​for a period selected by the user, plots dynamic S/R levels on the price chart. The indicator determines the trend and points to possible entry points formed by local highs/lows. The indicator allows you to notify the user of its signals by sending messages to the terminal and e-mail. The indicator does not repaint or recalculate. Signals when working with the indicator: The appearance
Digital Arrows AM
Andriy Matviyevs'kyy
The presented technical analysis indicator marks the points on the price chart of a financial instrument at which the short-term/long-term trend has changed its direction. The indicator identifies the trend direction by analyzing the divergence of the price series with the data of the digital filter selected by the user. The ability of the applied digital filters to adapt to sharp price fluctuations allows achieving high efficiency of the indicator signals in most markets. The indicator signals
Strong Line
Andriy Matviyevs'kyy
The presented product is a dynamic support/resistance line based on standard moving averages. The simplest and most effective trend indicator, useful for both a beginner in trading and a professional trader. Allows you to get the maximum result in trending areas of the market and minimize losses in areas of lateral price movement. Thanks to a wide range of customizable parameters, it allows you to get results in any market and TF. After the bar is formed, the indicator does not repaint. Princip
RSI Cross Signal AM
Andriy Matviyevs'kyy
The indicator gives signals to open/close a position and marks them on the price chart of the financial instrument. The signals differ in their potential, which allows you to decide on the amount of risk in each transaction. The principle of operation is to compare the current RSI value with the RSI value whose period is multiplied by the Cross_Factor value. The signal is confirmed when the price overcomes the maximum/minimum of the bar on which the indicator gave the signal. The open position i
DSS Oscillator AM
Andriy Matviyevs'kyy
The presented indicator is the author's implementation of the Double Smoothed Stochastic oscillator developed by William Blau and Walter Bressert. The calculation of values ​​is in many ways similar to the calculation of the classic stochastic oscillator. The indicator takes into account the location of the current price relative to local highs/lows. The indicator gives signals about changing its direction and/or about entering/exiting the overbought/oversold zone. The signal is given after the
Filtrele:
Mujeeb Abdul
2272
Mujeeb Abdul 2025.02.22 06:53 
 

Kullanıcı incelemeye herhangi bir yorum bırakmadı

İncelemeye yanıt
Sürüm 30.0 2025.03.19
Updated to version 30+.
Sürüm 28.0 2024.10.29
Updated to version 28+.
Sürüm 27.0 2024.09.15
Updated to version 27+.
Sürüm 26.10 2024.04.30
Updated to version 26.1