Scalping Scanner Dashboard
- Göstergeler
- Wartono
- Sürüm: 2.2
- Güncellendi: 16 Kasım 2023
- Etkinleştirmeler: 10
Scanning Multi Symbols Scalping Signals based on 3 kinds of Market Analysis methods. Trend, Signal, and Reversator. And each method consists of its own multi timeframes algorithm functions. Summarized to become clear signals direction BUY/SELL, including the signals strength scoring and sending message to all available alert tools. Displayed on a User Friendly and customizable Dashboard. Size, colors, coordinates, highlight, hidden/show and more.
Base Timeframe: M15. And M5 to Daily to confirm the signal.
Signal Type: Trend Following.
Features:
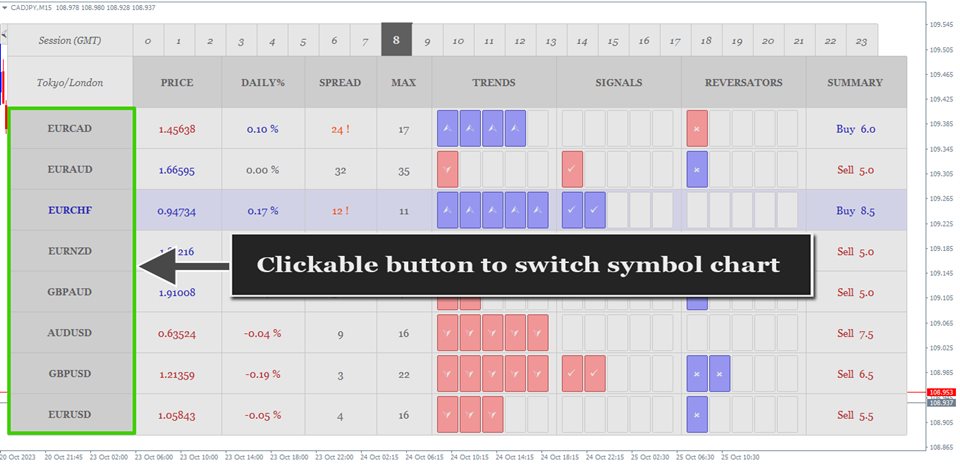
- Clickable Symbol Box to switch charts more quickly.
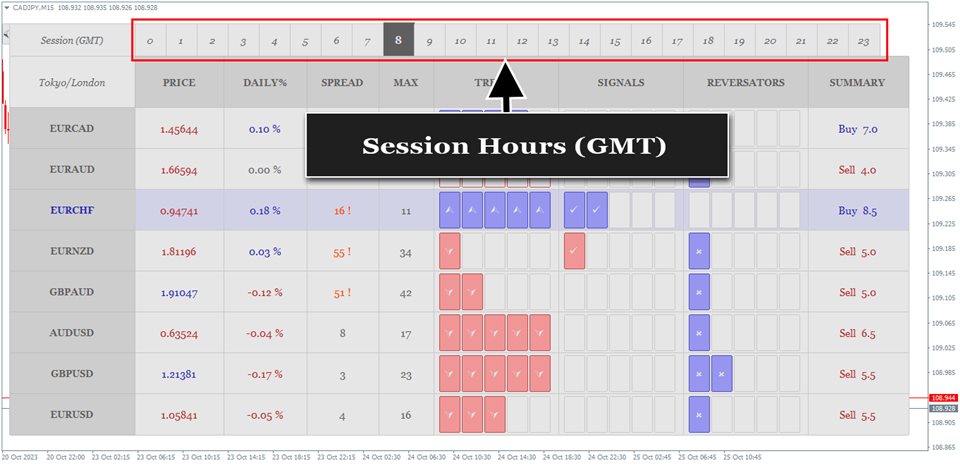
- Market hour Session
- Hidden/Show Dashboard
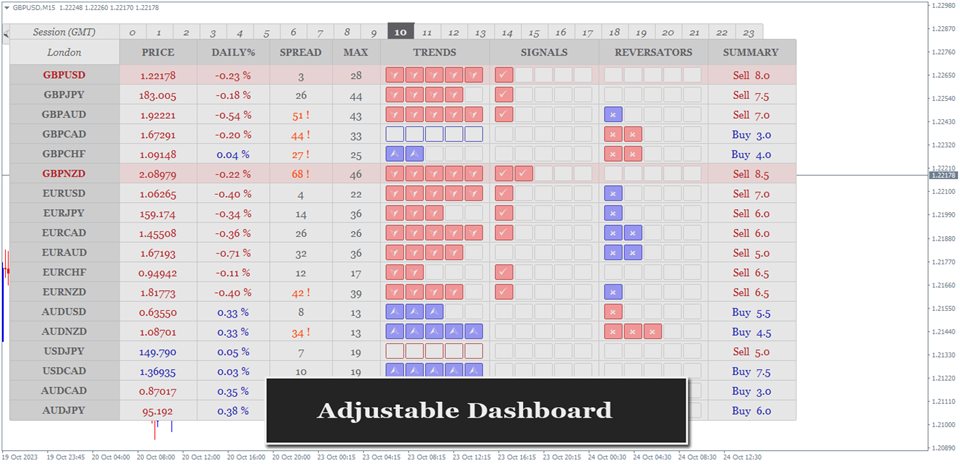
- Adjustable dashboard, including font colors, font size, border colors, background colors, column and line scaling, hidden/show dashboard.
- Auto checking symbol input, auto checking and download multi symbol and timeframe historical data.
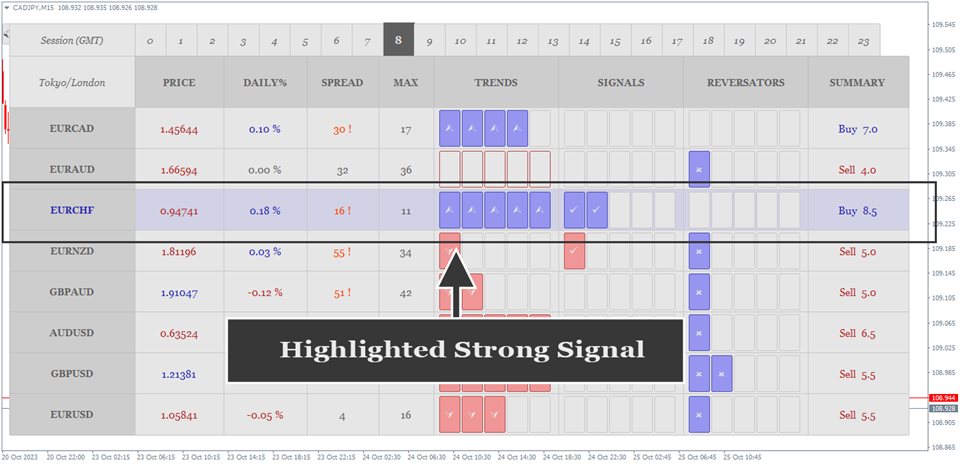
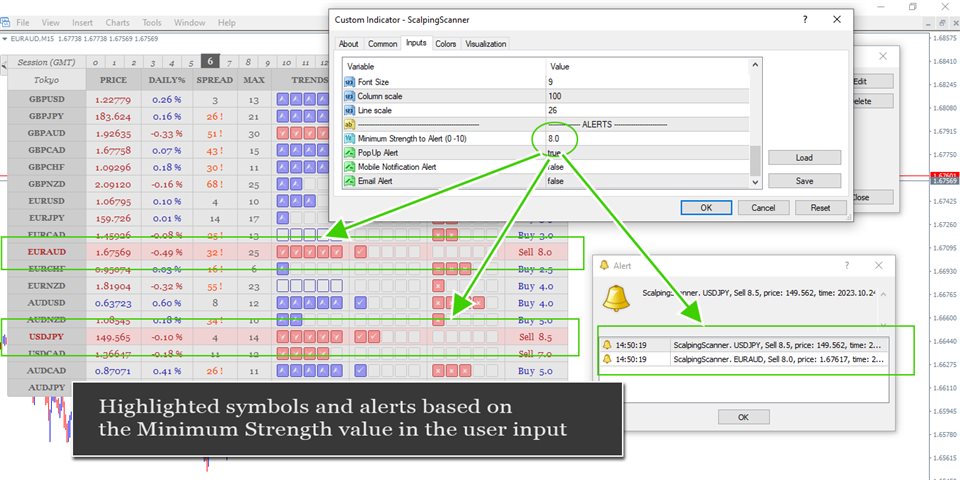
- Highlight existing strong signals.
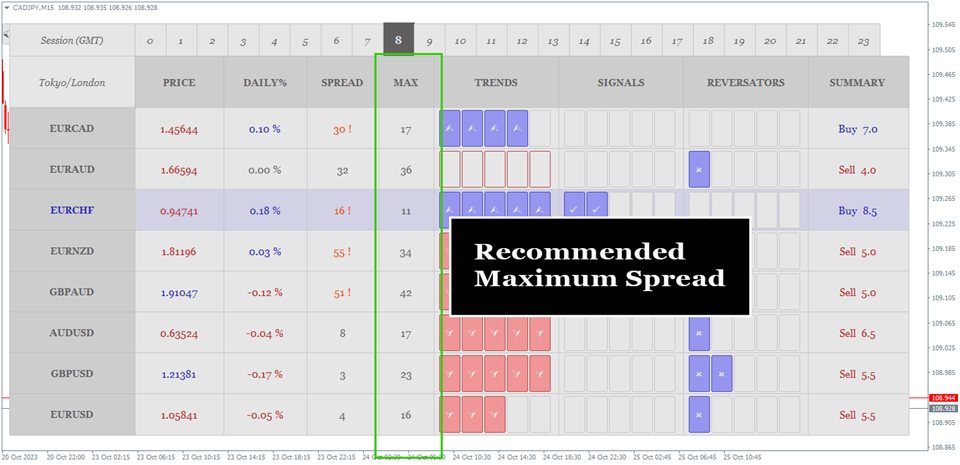
- Daily % change, Spread, Recommended Maximum Spread
- Multiple symbols
- Alerts
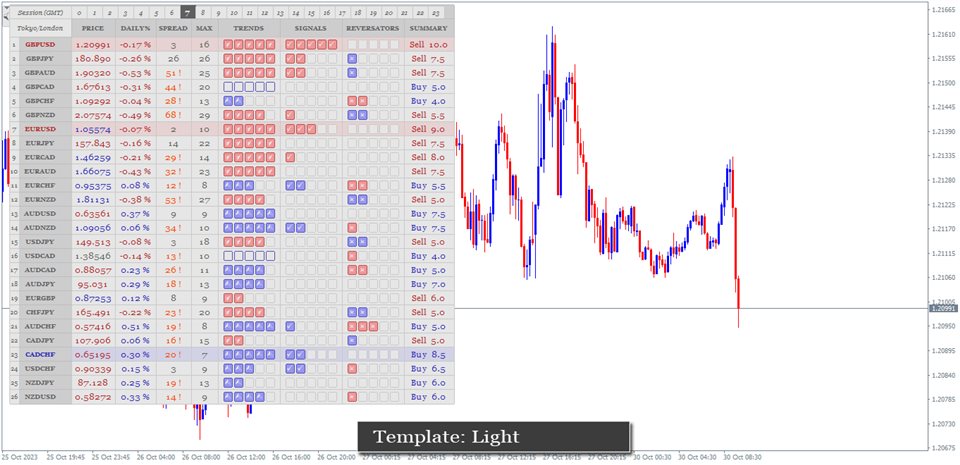
- Ready to use Templates: click here to download.
Dashboard Description:
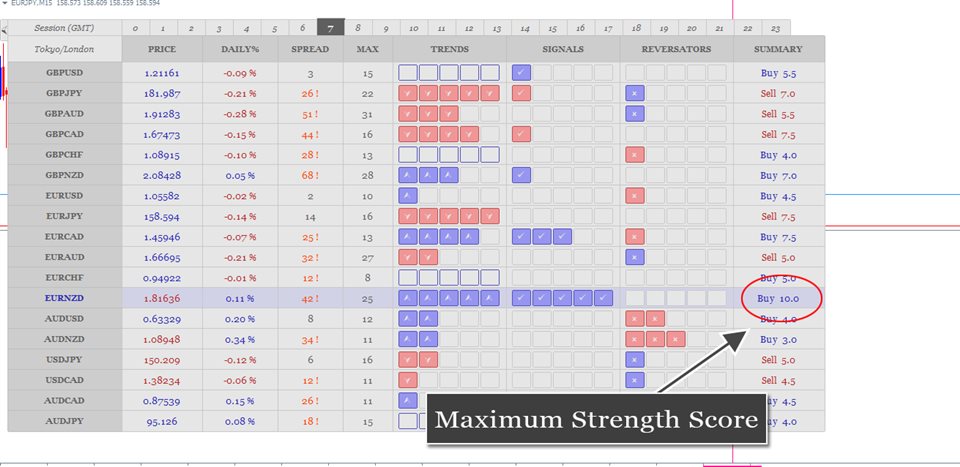
MARKET SESSION. There are several numbers on the top of dashboard. They are the GMT hours related to the Hour Market Session. The current hour is highlighted. And you can see the current Market Session on second top left column. Tokyo, Sidney, London and New York. Knowing the market sessions is important for trading decisions due to differences in market volatility. Such as, Stop Loss and Take Profit.
PRICE. The current market price of the symbols. By default, blue color means that price bullish in the last 15 minutes and red means that the price bearish in the last 15 minutes. Their colors are adjustable thru the user input.
DAILY%. This is today's percentage change to know the direction of the market today and how far the price has moved. The positive values (blue) mean that market bullish today and negative (red) values mean that price bearish today. Counted starting from yesterday price close.
SPREAD. The current spread values of the symbols. The orange ones with an exclamation mark means the spread is too high based on a comparison with the max values in the next column. You may need to consider these values for scalping. However, this is very flexible depending on market conditions such as volatility, trading instruments, and so on. Ignore these if you understand what you are doing, otherwise, be wary of these values.
MAX. The recommended maximum spread values. They are the current ATR M15 of the symbols divided by 4. We considered the results of the calculation are the proper values for scalping in this strategy.
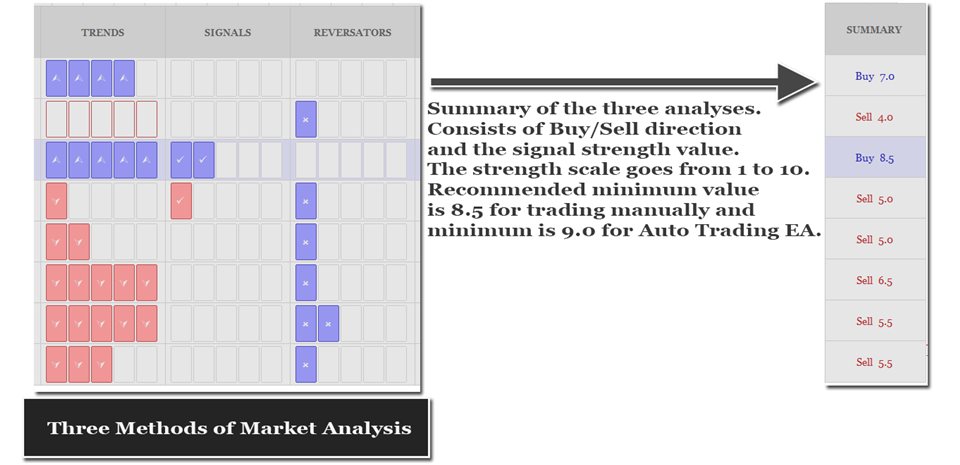
The Scalping Scanner has 3 main Market Analysis Methods: Trends, Signals and Reversators. Each Methods has the minimum Score Value: 0 and maximum: 5. The values represent the strength of them. Below the details description.
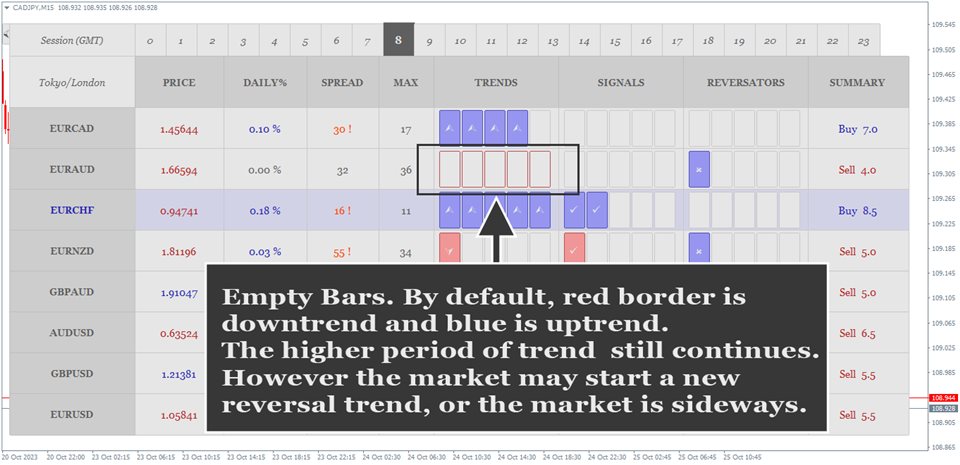
TRENDS. There are several trend indicator algorithms inside the Trends Strength, they are the trend of Oscillators such as MACD, RVI, Stoch, and CCI to identify the trend early and custom trend algorithms including custom MA, Slope Trend and SAR. Scalping Scanner collects the trend data from those Indicators across the timeframes. From M15 to H1 and summarizing them to calculate the Trend Strength and displayed as a number of bars. It is not only about getting the trend direction, but Scalping Scanner also combine and process those trends data to be a proper trend indicator, as best as possible to become no repaint and no lagging.
SIGNALS. Trading following the trend is the right way. But blindly following the trend may provide unexpected results. Here, the signal is also the important part to make entry in the right moment and maximizing the result. Scalping Scanner uses several methods to provide signal strength, including price crossovers, signals at saturation price e.g.: oversold while uptrend or overbought while downtrend, price patterns and more. Collecting their data from various timeframes, M15 to H4 and displayed as a number of bars on the table.
REVERSATORS. The strength of reversal signal that might cause the market to reverse against the current trend. So, higher strength score (more number of bars/boxes) will decrease the accuracy and vice versa. It can be the price starts to reverse against the trend on oversold/overbought area, reversal price crosses over, reversal patterns and more. In this case, Scalping Scanner also uses the combination of the reversal Direction of Trend and Signal method above. Collecting their data from various timeframes, M15 to H4 and summarizing to calculate the Reversators Strength Score. The other words, this is the Reversal Strength, the seller strength on the market uptrend and the buyer strength on the market downtrend. In certain market condition, it can be used to exit the market.
SUMMARY. This is a summary of the three analysis methods above, TRENDS, SIGNALS and REVERSATORS. The final result that consist of signal direction and signal strength. Higher score is better and stronger signal. Minimum value 1 and maximum 10. Recommended minimum is 8.5 for trading manually. And minimum 9 if you want to use it for the Auto Trading EA.
Parameters Setting:
- Trading Symbols (separated by comma). It can be any symbol, Forex, Gold, Future, Indices, etc.
- Symbol Prefix. It is the character before symbol if available.
- Symbol Suffix. It is the character after symbol if available, e.g. EURUSD.s then .s is a suffix.
- Fibonacci Retracement Filter (true/false). If true, the current signal will be filtered by Fibonacci Retracement. Retracement levels 0.382 to 0.618. Example: The current signal is a buy signal, and the price is on the retracement sell on level range 0.382 to 0.618 then the Reversators strength will be increased. It causes the summary strength to be decreased. Also, if the current signal is a buy signal and the price is on the retracement buy on level range 0.382 to 0.618 then the signal strength will be increased. It causes the summary strength to be increased. Vise versa for sell.
- X Distance
- Y Distance
- Buy Background Color
- Sell Background Color
- Buy Border Color
- Sell Border Color
- Buy Font Color
- Sell Font Color
- Buy Highlight Background Color
- Sell Highlight Background Color
- Header Background Color
- Header Border Color
- Header Font Color
- Header Font Size
- Background Color
- Border Color
- Font Color
- Font Size
- Column scale
- Line scale
- Minimum Strength to Alert (0 -10). The default value: 8.5. Scalping Scanner will send alert and highlight the symbol on the dashboard only if the current summary signal strength is equal or more than this minimum value. Value 0 means that the indicator will send alert every 15 minutes, in case alert is activated and all symbols will be highlighted.
- PopUp Alert
- Mobile Notification Alert
- Email Alert
How to Trade
- Waiting for alert in case alert is activated or see the highlight on the dashboard to get the strong signal symbol.
- Follow the signal direction. Recommended maximum duration to expire after alert is about 45 minutes. And current price is still around the price provided on the alert message.
- BUY signal EURNZD.s on 1.81780, strength: 9.0, time: 2023.10.31 05:45 --> This signal is valid if current time is not more than 2023.10.31 06:30 and price is currently below/equal 1.81780.
- SELL signal AUDCHF.s on 0.57383, strength: 9.0, time: 2023.10.31 04:00 --> This signal is valid if current time is not more than 2023.10.31 04:45 and price is currently above/equal 0.57383.
- Consider the market session for price volatility, spread value and daily % in your trading decisions if necessary.
- Stop Loss can be the last highest high for Sell or the last lowest low for Buy, or simply use Parabolic SAR indicator to define Stop Loss price. If SAR trend follow the signal direction, then place the Stop Loss slightly below/above SAR value. Recommended minimum Stop Loss: 2.5 x ATR M15 Period 14 and maximum 5.0 x ATR M15 Period 14. Take Profit can be the multiply of the Stop Loss.
- Lot size depending on the equity capability.
- As an Indicator that works based on technical analysis, the accuracy could be decreased on the high news event. So recommended to double checking for the market condition to trade at this moment.
- Consider avoiding trading around 3 hours before market close. Your position may face significant spread increases, extreme gaps in market opening, swaps, and changes in trend direction. However, conditions can vary depending on broker policies and the market itself.
Example:
Strategy Tester
The Scalping Scanner indicator is a multi-timeframe and multi-symbol indicator. It will automatically scan only the current symbol when run in the Tester and the results may differ significantly to the results in the live market possibly due to imprecise multi time period historical data available on local disk.
If you have any questions related to Scalping Scanner Indicator, please don't hesitate to contact me.

