• Genel bakış
  • İncelemeler
  • Yorumlar

Obie Sniper

Obie Sniper'a Giriş

Obie Sniper göstergesi en iyi Giriş ve Çıkış noktalarını sağlar.

Obie Sniper MT4 göstergesinin basitliği, forex sinyallerinin başarıyla uygulanmasını ve ticaretini kolaylaştırır.
Bu gösterge, M5 ve M15 çizelgelerini kullanan kazıyıcılar için iyi çalışır. Aynı zamanda swing yatırımcıları trendi belirlemek ve başarılı bir şekilde işlem yapmak için H1 ve H4 grafiklerini kullanabilirler.
Bu gösterge yeni forex yatırımcıları için en uygunudur. Çünkü trendleri belirlemeye ve görsel olarak minimum sürede işlem yapmaya başlamaya yardımcı olur. Bununla birlikte, gelişmiş forex yatırımcıları, göstergeyi herhangi bir trend ticaret ortamındaki diğer ticaret göstergeleri ve araçlarıyla birleştirebilir.
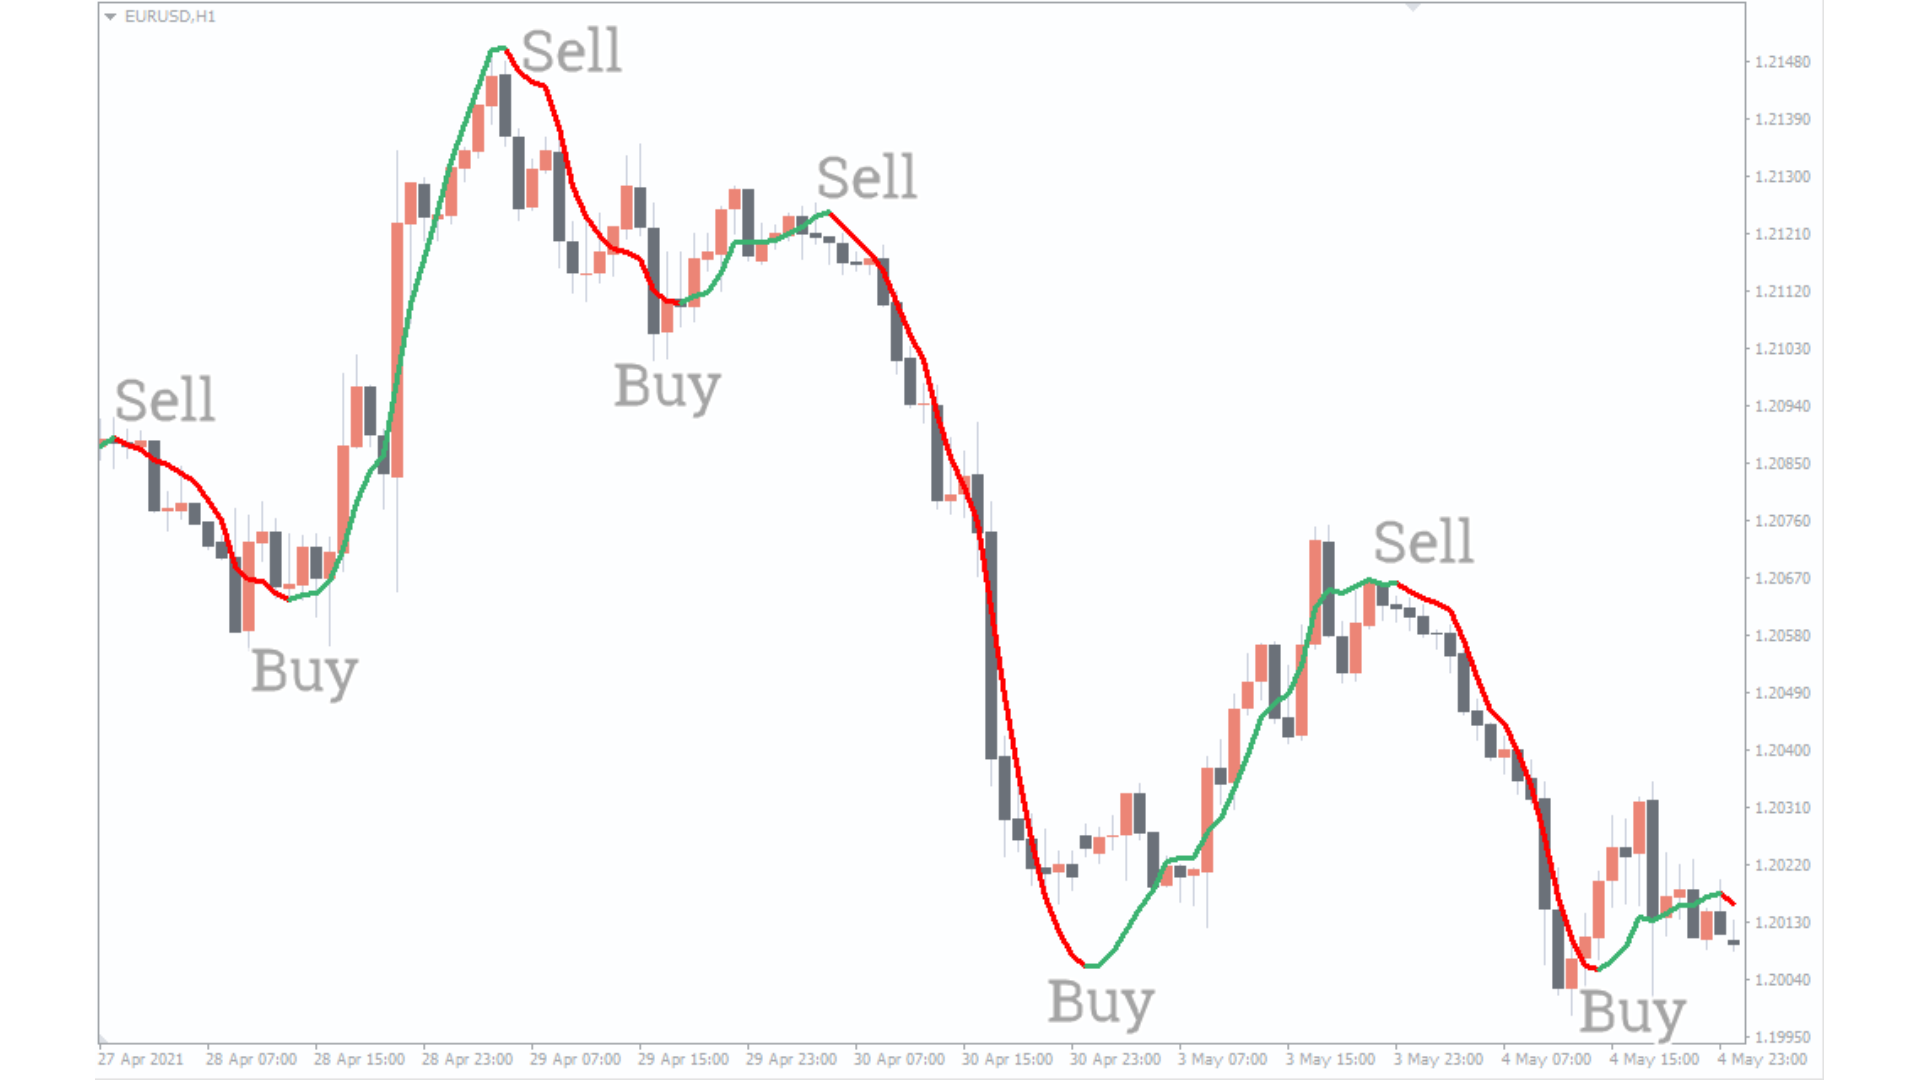
YEŞİL renkte bir BOĞA trendi görüntülenirken, AYI trendi KIRMIZI renkli gösterge çizgisinde gösterilir.
Sonuç olarak, trend BOĞA'dan AYI'ya değiştiğinde gösterge çizgisinin rengi YEŞİL'den KIRMIZI'ya değişir.

Giriş noktası

Bir giriş noktasının tanımlanması oldukça basit ve anlaşılırdır. Yatırımcılar, YEŞİL renk çizgisi oluştuğunda, bir önceki düşük seviyenin altında bir stop kaybıyla piyasalara SATIN AL pozisyonuyla girebilirler.

Forex yatırımcıları pozisyonlarını korumaya, trend dalgasını sürmeye ve ters sinyalde çıkmaya devam edebilir. Bunun tersine, yatırımcılar önceki yüksek seviyenin üzerinde bir durak ile KIRMIZI renkli gösterge çizgisini oluşturduktan sonra bir SAT işlemi başlatabilirler.

Çıkış Noktası

SATIŞ pozisyonundan en iyi çıkış ters sinyal ile olacaktır. Bununla birlikte, Risk/ödül oranına dayalı Zararı Durdur ve Kar Al da mükemmel bir ticaret planının bir parçasıdır. Bir SATIN AL pozisyonu için forex yatırımcıları, Zararı Durdur'u önceki en düşük seviyeye kadar ölçebilir. Ve Kârı Al'ı belirlemek için 1:2 veya daha yüksek bir risk-ödül oranı kullanın.
Önerilen ürünler
UPD1 Fibo Levels
Vitaliy Kuznetsov
5 (1)
Gösterge, belirtilen mum sayısını analiz eder ve maksimum-minimuma dayalı Fibonacci seviyeleri oluşturur. Seviyeler yeniden inşa edildiğinden, aralığın sağ tarafıyla ilgileniyoruz. Fiyat seviyelere manyetiktir ve bir dokunuşa tepki verir. Bir düzeltmeden sonra bir trend giriş noktası bulmak için bu aracı kullanın. Sol tarafta seviyelerin mükemmel bir şekilde yükseldiğini görürsek, hareketin sonunu en uç noktada bulduğumuzu varsayabiliriz. Tüm çizgiler tamponlar veya nesneler (seçiminiz) aracılığ
FREE
This indicators automatically draws the   support and resistances   levels (key levels) for you once you've dropped it on a chart. It reduces the hustle of drawing and redrawing these levels every time you analyse prices on a chart. With it, all you have to do is drop it on a chart, adjust the settings to your liking and let the indicator do the rest. But wait, it gets better; the indicator is absolutely free! For more information:  https://youtu.be/rTxbPOBu3nY For more free stuff visit:  https
FREE
Description: This indicator draw ZigZag Line in multiple time frame also search for Harmonic patterns before completion of the pattern. Features: Five instances of ZigZag indicators can be configured to any desired timeframe and inputs. Draw Harmonic pattern before pattern completion. Display Fibonacci retracement ratios. Configurable Fibonacci retracement ratios. Draw AB=CD based on Fibonacci retracement you define. You can define margin of error allowed in Harmonic or Fibonacci calculatio
FREE
The Icarus Reversals(TM) FREE Indicator is a powerful tool to identify high-probability reversal points, across all instruments.  The Reversals Indicator provides traders and investors with a simple-to-use and highly dynamic insight into points of likely price-action reversals.  Generated by a unique proprietary code-set, the Reversals Indicator (FREE version) generates long and short trade signals, which can be customised for key inputs and colourisation. Settings of the Icarus Reversals FREE h
FREE
This indicator filters the Zigzag indicator to calculate the main support and resistance levels. Variables minimum gap between peaks : is the distance (GAP) between the peaks of the Zigzag peaks sensitivity : Minimum number of nearby peaks look back: it means that it has to test the last 50 peaks in the Zigzag object name perfix: a prefix for level’s line name on chart
FREE
Fibonacci Retracement object is an object that has been provided by metatrader 4 platform. But  Fibonacci Retracement  object doesn't automated adjust the chart. You have to put and manage it manually to the chart. Because of that, this indicator was created. If you like using filbonacci retracement indicator, highly recommended to use Automated Fibonacci Retracement Indicator if you want to get better result in here: https://www.mql5.com/en/market/product/95515 LT Automated Fibonacci Retrace
FREE
Period Breakout Indicator
Komang Putra Riswanjaya
5 (1)
The Period Breakout Indicator is a versatile tool designed for traders seeking to identify breakout opportunities based on customizable time periods. This indicator automatically determines the highest and lowest prices within a user-defined period, allowing you to tailor it precisely to your trading strategy. Key Features: Customizable Time Periods: Define the start and end times based on your preferred trading hours or any specific period. The indicator will then calculate the highest and low
FREE
FxSProMT
Sergiy Podolyak
5 (1)
The FxSProMT indicator shows the current market trend and trend change. Indicator Parameters Ind_Period - the number of previous bars used to calculate actual values. Number_Bars - the number of bars to display the indicator.. Too many bars may significantly slow down the operation of the trading terminal. Signal_Sound - sound alert to notify of trend change. The sound can be played multiple times until the signal is confirmed (the bar closes). Default is disabled. Signal_Alert - an alert to n
FREE
Trend Yakalayıcı: Alarm İndikatörü ile Trend Yakalayıcı Stratejisi, piyasa trendlerini ve potansiyel giriş ve çıkış noktalarını belirlemede yardımcı olan çok yönlü bir teknik analiz aracıdır. Piyasa koşullarına uyum sağlayarak trend yönünün net görsel temsili için dinamik bir Trend Yakalayıcı Stratejisi sunar. Tüccarlar tercihlerine ve risk toleranslarına göre parametreleri özelleştirebilirler. Gösterge, trendleri tanımlamaya yardımcı olur, potansiyel ters dönüşleri sinyaller, trailing stop m
FREE
Free automatic Fibonacci is an indicator that automatically plots a Fibonacci retracement based on the number of bars you select on the BarsToScan setting in the indicator. The Fibonacci is automatically updated in real time as new highest and lowest values appears amongst the selected bars. You can select which level values to be displayed in the indicator settings. You can also select the color of the levels thus enabling the trader to be able to attach the indicator several times with differe
FREE
Basic Fibonacci Calculation Indicator  shows Trend, Stoploss, Profit 1,2,3, will show you your daily Highs and your Daily Lows , it will also show you where it expects the price to move to.  best time frame is H1 or higher .  For  a better system that also includes my Non-repaint Indicator please check out my paid Fibo Indicator  https://www.mql5.com/en/market/product/82323
FREE
Ratio market
Aleksandr Krokhalev
4.29 (14)
Volatility under control. The indicator shows the optimal depth for setting goals within the day and on the average trend. It also builds pivot zones for the estimated correction depth. As an accompaniment, the key levels of the structure are displayed for several timeframes. Classical volatility indicators ATR & ADX on fixed timeframes are used for calculation. The calculation takes into account the spread, and if the market is slightly volatile, you will see a warning about the risk. You can c
FREE
BeST_ Classic Pivot Points is an MT4 Indicator that is based on the widely known and definitely classic Pivot Point of a market prices activity. A pivot point is calculated as an average of significant prices (high,low,close) from the performance of a market in the prior trading period. If the market in the following period trades above the pivot point it is usually evaluated as a bullish sentiment, whereas trading below the pivot point is seen as bearish. A pivot point and the associated suppo
FREE
Bu gösterge size aşağıdaki seviyeleri çizecektir: Günlük açık hat: aşağıda ayı piyasası var, yukarıda ise yükseliş var. Ortalama günlük aralık yüksek ve düşük Asya piyasası yüksek ve düşük Dünün en yüksek ve en düşük seviyeleri Bu seviyeler herkesin dikkat etmesi gereken güçlü destek ve direnç seviyeleridir. Başlamak için zamanını kullanmadıysanız! Fiyat bu seviyelere yaklaşırken dikkat etmeniz gerekiyor! Kolaylaşan ticaretin tadını çıkarın!
FREE
Gold Renko EA is an Expert Advisor for trading Gold (XAUUSD). Recommendations: Only use the EA on Renko Flip Chart. 5 Type of Strategy: Intraday and Medium Term. Risk Management: Auto Lot Size based on the % risk. Be patient, try the EA for at least 1 month. It is a trend EA so we need some trend. All trades have a Stop Loss No grid, No martingale Must work 24/7. Using VPS is recommended. MQL5 Channel Group:    To download all the files needed for create Renko Chart, backtesting and presets
Super trend is one of the best trend indicators in metatrader 4 (MT4). Triple SuperTrend indicator is an indicator that consist of three super trend indicator that can be aranged. This indicator is built by mql4 language and doesn't provided by MT4 platform. Highly recommended using EMA SuperTrend Strategy Indicator if you want to get better result in here: https://www.mql5.com/en/market/product/91664 This indicator is easy to use, power full and has many benefits, there are: Using three ind
FREE
It is FREE on EURUSD chart. All Symbols version! Contact me for any questions Introduction The breakout and retest strategy is traded support and resistance levels. it involves price breaking through a previous level.  The   break and retest   strategy is designed to help traders do two main things, the first is to avoid false breakouts. Many false breakouts start with a candlestick that breaks out of a level but ends with an immediate candlestick that brings the price back into the level. The
FREE
I will support only my client. สำหรับลูกค้า Parameters General Trade Settings Money Management  Lot : Fixed (can change) Strategies  - H4 Strategies it is fixed with MA, Bollinger band, Candlestick Levels Close Functions  - H4 Strategies MagicNumber  - individual magic number. The EA will only manage position of the chart symbol with this magic number. NextOpenTradeAfterMinutes  - 15 minutes is default, can change it MaxSpread  - upto currency pairs, MaxSlippage  - upto currency pairs, Push
Download the free version   here. Divergence Divergence refers to when the price of a currency pair moves in one direction while the trend indicator is moving in the opposite direction. With divergence, there can be positive and negative signals. Divergences in Forex trading are quite common signals of technical analysis. These are basic early Forex signals indicating the trend reversal and filter false signals. Application of this indicator It is usually not easy to detect divergences by the t
FREE
SR indicator
Alexander Chertnik
SR is a support and resistance indicator, it shows major highs and lows by different colors. The color of a level is changing if the last high or low are touching it. After the closing of a bar above or below level, it will delete it. extern inputs: loop for candles / colors / drawing time *This indicator signal is not perfect and have to be used with other market analysis and confirmations.
FREE
Destek ve Direnç Seviyeleri Bulucu: Destek ve Direnç Seviyeleri Bulucu, ticarette teknik analizi geliştirmek için tasarlanmış gelişmiş bir araçtır. Dinamik destek ve direnç seviyeleriyle donatılmış olup, yeni anahtar noktalar grafikte ortaya çıktıkça gerçek zamanlı olarak adapte olur ve böylece dinamik ve tepkisel bir analiz sunar. Benzersiz çoklu zaman dilimi yeteneği, kullanıcıların istedikleri zaman diliminde farklı zaman dilimlerinden destek ve direnç seviyelerini göstermelerine olanak ta
FREE
Introducing the Super Pivot and Fibo Indicator: Your Ultimate Trading Companion Are you ready to take your trading to the next level? The Super Pivot and Fibo Indicator is here to revolutionize your trading strategy. This powerful tool combines key elements such as pivot points, Fibonacci retracement and extension levels, high-low values, and Camarilla points to provide you with a comprehensive and accurate analysis of the market. Key Features: Pivot Points: Our indicator calculates daily, weekl
FREE
Fibonacci SR Indicator This indicator creates support and resistance lines. This indicator is based on Fibonacci Retracement and Extension levels. It will consider many combinations of the Fibonacci levels and draw support/resistance lines based on these. This indicator uses tops and bottoms drawn by the ZigZag indicator in its calculations. The ZigZag can also be drawn on the chart, if necessary. The indicator considers many combinations of past reversal points and Fibonacci ratio levels, and
FREE
Trend Line Channel
David Muriithi
4.14 (14)
This indicators automatically draws the Trend Channels for you once you've dropped it on a chart.  It reduces the hustle of drawing and redrawing these levels every time you analysis prices on a chart. With it, all you have to do is dropped it on a chart, adjust the settings to your liking and let the indicator do the rest.  Get an alternative version of this indicator here:   https://youtu.be/lt7Wn_bfjPE For more free stuff visit:  https://abctrading.xyz Parameters 1) Which trend do you want
FREE
This is a Multi-Time-Frame Zigzag indicator You can change parameters of Zigzag, include Zigzag Depth, Zigzag Deviation, Zigzag Backstep. You can choose which Time Frame to display Zigzag by turn ShowXXX to true or false (ShowXXX = ShowM1, ShowM5, ShowM15...). Noted: Lower Time Frame Zigzag will not display on Higher Time Frame. Example: Your current Time Frame is H1, you can not see Zigzag of M1 to M30 even you turn them on.
About: A Fibonacci indicator is best used with other indicators like Pivots, Support/Resistance etc. Price tends to use Fibo levels as Support or Resistance lines. So, this indicator is very useful to know when price might reverse or if a level is crossed, price might continue the trend. Also, to find the best Take Profit and StopLoss lines. Don't use Fibo Indicator alone for trading as it might not always be accurate. Use it to make your strategies better as a supporting indicator. Settings:
FREE
Indicator support for only: Entry Point to Trend Pro Link indicator  support   :   https://www.mql5.com/en/market/product/70867 Supports all currency pairs declared in the definition. Help investors do not need to open many charts. Notice the DEAL:  multiple time frames confluence   M15, H1, H4. Entry Point to Trend Pro The indicator helps investors to identify the earliest and perfect reversal point. Easy to make decision to trade with the trend   Price action trading. support resistance
FREE
The   Pivot Point indicator   automatically calculates and displays the pivot point line and support and resistance levels. Pivot can be calculated according to the Classic, Floor, Fibonacci, Woodie, Camarilla or DeMark formula. It is also possible to select the period for calculating the indicator. A trader can choose from daily, weekly, monthly, or user-defined periods. Types of pivots Classic Floor Fibonacci Woodie Camarilla DeMark Main features The indicator shows the current and histor
FREE
The Mono Waves indicator is designed to display the wave behavior of the market on a chart. Its appearance is presented on slide 1.   This indicator uses the PPPC (Point-Percent Price Channel) indicator, which can be downloaded for free from the Market .             When the market moves up, the upper border of the price channel is built on High candlestick prices (for more details, see the description of the PPPC indicator at the link given above). The higher the High prices rise, t
FREE
NIGHTCrusher Lite FREE
Christian Opperskalski
4.5 (2)
NIGHTCRUSHER is a fully automated expert advisor, designed for scalping on quite market situation. The Lite - Version is limited to minimal Lot per Pair and dont has lot mulitplier and dynamic function you can also run different strategies like swing trading or grid different Trade Entry Signals different Exit Strategies included (MA Cut / Signal Change / Trailing TP) clever Risk & Money management - Balance based - Longrun trades tracking You can also use a Grid function or Lot multipier, if n
FREE
Bu ürünün alıcıları ayrıca şunları da satın alıyor
Gann Made Easy
Oleg Rodin
4.85 (82)
Gann Made Easy , bay teorisini kullanarak ticaretin en iyi ilkelerine dayanan, profesyonel ve kullanımı kolay bir Forex ticaret sistemidir. WD Gann. Gösterge, Zararı Durdur ve Kâr Al Seviyeleri dahil olmak üzere doğru SATIN AL ve SAT sinyalleri sağlar. PUSH bildirimlerini kullanarak hareket halindeyken bile işlem yapabilirsiniz. Lütfen satın aldıktan sonra benimle iletişime geçin! Alım satım ipuçlarımı ve harika bonus göstergelerini ücretsiz olarak sizinle paylaşacağım! Muhtemelen Gann ticaret y
- Real price is 80$ - 40% Discount ( It is 49$ now ) Contact me for instruction, add group and any questions! Related Product:  Bitcoin Expert , Gold Expert Introduction The breakout and retest strategy is traded support and resistance levels. it involves price breaking through a previous level.  The break and retest strategy is designed to help traders do two main things, the first is to avoid false breakouts. Many false breakouts start with a candlestick that breaks out of a level but ends wi
Atomic Analyst
Issam Kassas
5 (2)
Öncelikle belirtmek gerekir ki bu Ticaret Göstergesi Yeniden Çizim Yapmaz, Gecikmez ve Gecikme Göstermez, bu da hem manuel hem de robot ticareti için ideal hale getirir. Kullanıcı kılavuzu: ayarlar, girişler ve strateji. Atom Analisti, Piyasada Daha İyi Bir Avantaj Bulmak İçin Fiyatın Gücünü ve Momentumunu Kullanan PA Fiyat Hareketi Göstergesidir. Gürültüleri ve Yanlış Sinyalleri Kaldırmaya ve Ticaret Potansiyelini Artırmaya Yardımcı Olan Gelişmiş Filtrelerle Donatılmıştır. Birden fazla katma
Scalper Inside PRO
Alexey Minkov
4.73 (56)
An exclusive indicator that utilizes an innovative algorithm to swiftly and accurately determine the market trend. The indicator automatically calculates opening, closing, and profit levels, providing detailed trading statistics. With these features, you can choose the most appropriate trading instrument for the current market conditions. Additionally, you can easily integrate your own arrow indicators into Scalper Inside Pro to quickly evaluate their statistics and profitability. Scalper Inside
Gold Stuff
Vasiliy Strukov
4.89 (239)
Gold Stuff, özellikle altın için tasarlanmış bir trend göstergesidir ve herhangi bir finansal enstrümanda da kullanılabilir. Gösterge yeniden çizilmez ve gecikmez. Önerilen zaman dilimi H1. Bu göstergede tam otomatik Uzman Danışman EA Gold Stuff çalışır. Profilimde bulabilirsiniz. Ayarları ve kişisel bir bonusu almak için satın alma işleminden hemen sonra benimle iletişime geçin!  Güçlü Destek ve Trend Tarayıcı göstergemizin ücretsiz bir kopyasını pm'den alabilirsiniz. Ben! AYARLAR Ok Ç
Şu anda %20 İNDİRİMLİ! Herhangi bir Acemi veya Uzman Tüccar için En İyi Çözüm! Bu gösterge paneli yazılımı 28 döviz çifti üzerinde çalışıyor. Ana göstergelerimizden 2'sine (Gelişmiş Para Birimi Gücü 28 ve Gelişmiş Para Birimi Dürtüsü) dayanmaktadır. Tüm Forex piyasasına harika bir genel bakış sağlar. Gelişmiş Para Birimi Gücü değerlerini, para birimi hareket hızını ve tüm (9) zaman dilimlerinde 28 Forex çifti için sinyalleri gösterir. Trendleri ve / veya scalping fırsatlarını belirlemek içi
Enigmera
Ivan Stefanov
5 (3)
ENIGMERA: Pazarın çekirdeği https://www.enigmera.com Giriş Bu gösterge ve ticaret sistemi, finansal piyasalar için dikkate değer bir yaklaşımdır. ENIGMERA, destek ve direnç seviyelerini doğru bir şekilde hesaplamak için fraktal döngüleri kullanır. Gerçek birikim aşamasını gösterir ve yön ve hedefler verir.  İster bir trendde ister bir düzeltmede olalım çalışan bir sistem.  Nasıl çalışır? ENIGMERA üç çizgiden oluşur: destek/direnç çizgisi, hedef çizgisi ve sapma çizgisi. Sistem, geçmiş veril
TPSproTREND PrO
Roman Podpora
4.79 (19)
TPSpro TREND PRO,   piyasayı otomatik olarak analiz eden, trend ve değişimlerinin her biri hakkında bilgi sağlayan, ayrıca yeniden çizmeden işlemlere girme sinyalleri veren bir trend göstergesidir! Gösterge her mumu ayrı ayrı analiz ederek kullanır. farklı dürtülere atıfta bulunur - yukarı veya aşağı dürtü. Para birimleri, kripto paralar, metaller, hisse senetleri ve endeksler için işlemlere tam giriş noktaları! Sürüm MT5                   GÖSTERGENİN TAM AÇIKLAMASI       Bunu -   RFI SEVİYELER
Dynamic Forex28 Navigator - Yeni Nesil Forex Ticaret Aracı. ŞU ANDA %49 İNDİRİM. Dynamic Forex28 Navigator, uzun zamandır popüler olan göstergelerimizin evrimidir ve üçünün gücünü tek bir göstergede birleştirir: Gelişmiş Döviz Gücü28 Göstergesi (695 inceleme) + Gelişmiş Döviz İMPULS ve UYARI (520 inceleme) + CS28 Kombo Sinyalleri (Bonus). Gösterge hakkında ayrıntılar https://www.mql5.com/en/blogs/post/758844 Yeni Nesil Güç Göstergesi Ne Sunuyor?  Orijinallerde sevdiğiniz her şey, şimdi ye
Trend Punch
Mohamed Hassan
4.95 (19)
This indicator is unstoppable when combined with our other indicator called  Support & Resistance . After purchase, send us a message and you will get it   for  FREE as a BONUS! Introducing Trend Punch , the revolutionary forex trend indicator that will transform the way you trade! Trend Punch is uniquely designed to provide precise buy and sell arrows during strong market trends, making your trading decisions clearer and more confident. Whether you're trading major currency pairs or exotic sym
Trend Screener
STE S.S.COMPANY
4.8 (87)
Trend Göstergesi, Trend Alım Satım ve Filtreleme için Çığır Açan Benzersiz Çözüm, Tüm Önemli Trend Özellikleriyle Tek Bir Araç İçinde Yerleştirildi! Forex, emtialar, kripto para birimleri, endeksler ve hisse senetleri gibi tüm sembollerde/araçlarda kullanılabilen %100 yeniden boyamayan çoklu zaman çerçevesi ve Çoklu para birimi göstergesidir. SINIRLI SÜRELİ TEKLİF: Destek ve Direnç Tarama Göstergesi sadece 50$ ve ömür boyu mevcuttur. (Orijinal fiyat 250$) (teklif uzatıldı) Trend Screener, grafik
FX Volume
Daniel Stein
4.58 (33)
Sabah Brifingimiz aracılığıyla ayrıntılar ve ekran görüntüleri ile günlük piyasa güncellemenizi alın burada mql5 ve on Telegram ! FX Volume, bir brokerin bakış açısından piyasa duyarlılığı hakkında GERÇEK bir fikir veren İLK ve TEK hacim göstergesidir. COT raporlarından çok daha hızlı bir şekilde, brokerlar gibi kurumsal piyasa katılımcılarının Forex piyasasında nasıl konumlandıklarına dair harika bilgiler sağlar. Bu bilgileri doğrudan grafiğinizde görmek, ticaretiniz için gerçek oyun değiştir
TPSpro RFI Levels
Roman Podpora
4.82 (22)
TALİMATLAR         RUS   -        ENG       Bir gösterge ile kullanılması   önerilir       -       TPSpro   TREND PRO -   Sürüm MT4         Ticarette önemli bir unsur, bir ticaret aracını satın alma veya satma kararlarının alındığı bölgeler veya seviyelerdir. Büyük oyuncuların piyasadaki varlıklarını gizleme girişimlerine rağmen, kaçınılmaz olarak izler bırakırlar. Bizim görevimiz bu izleri nasıl tanımlayacağımızı ve doğru şekilde nasıl yorumlayacağımızı öğrenmekti. Ana işlevler:: Satıcılar ve
FX Power MT4 NG
Daniel Stein
5 (13)
Sabah Brifingimiz burada mql5 ve on Telegram! FX Power MT4 NG , uzun zamandır çok popüler olan döviz gücü ölçerimiz FX Power'ın yeni neslidir. Peki bu yeni nesil güç ölçer ne sunuyor? Orijinal FX Power hakkında sevdiğiniz her şey PLUS GOLD/XAU güç analizi Daha da hassas hesaplama sonuçları Ayrı ayrı yapılandırılabilir analiz dönemleri Daha da iyi performans için özelleştirilebilir hesaplama limiti Özel çokluDaha fazlasını görmek isteyenler için örnek ayarlar Her grafikte en sevdiğiniz renkler i
Öncelikle, bu Ticaret Aracının Non-Repainting, Non-Redrawing ve Non-Lagging Gösterge olduğunu vurgulamakta fayda var, bu da onu profesyonel ticaret için ideal hale getiriyor. Çevrimiçi kurs, kullanıcı kılavuzu ve demo. Akıllı Fiyat Hareketi Kavramları Göstergesi, hem yeni hem de deneyimli tüccarlar için çok güçlü bir araçtır. İleri ticaret fikirlerini, Inner Circle Trader Analizi ve Smart Money Concepts Ticaret Stratejileri gibi 20'den fazla kullanışlı göstergeyi bir araya getirerek bir araya g
MetaTrader 4 için Ultimate Gold Advisor Ultimate Gold Advisor, MetaTrader 4 üzerindeki ticaret deneyimini optimize etmek için tasarlanmış ileri teknolojik bir araçtır. Deneyimli yatırımcıların ihtiyaçlarını karşılamak amacıyla geliştirilen bu gösterge, doğruluk, sofistike analiz ve çok yönlü işlevselliği bir araya getirerek bilgiye dayalı ticaret kararlarını destekler. Altın ticareti için ideal olmakla birlikte, geniş bir varlık yelpazesinde de uygulanabilir olan Ultimate Gold Advisor, piyasa st
Stratos Pali
Michela Russo
5 (1)
Stratos Pali Indicator   is a revolutionary tool designed to enhance your trading strategy by accurately identifying market trends. This sophisticated indicator uses a unique algorithm to generate a complete histogram, which records when the trend is Long or Short. When a trend reversal occurs, an arrow appears, indicating the new direction of the trend. Important Information Revealed Leave a review and contact me via mql5 message to receive My Top 5 set files for Stratos Pali at no cost! D
Legacy of Gann
Pavel Zamoshnikov
4.83 (12)
The indicator very accurately determines the levels of the possible end of the trend and profit fixing. The method of determining levels is based on the ideas of W.D.Gann, using an algorithm developed by his follower Kirill Borovsky. Extremely high reliability of reaching levels (according to K. Borovsky  - 80-90%) Indispensable for any trading strategy – every trader needs to determine the exit point from the market! Precisely determines targets on any timeframes and any instruments (forex, met
Gold Channel is a volatility-based indicator, developed with a specific timing algorithm for the XAUUSD pair, which consists of finding possible corrections in the market. This indicator shows two outer lines, an inner line (retracement line) and an arrow sign, where the theory of the channel is to help identify overbought and oversold conditions in the market. The market price will generally fall between the boundaries of the channel. If prices touch or move outside the channel it is a tra
Currency Strength Wizard , başarılı ticaret için size hepsi bir arada çözüm sağlayan çok güçlü bir göstergedir. Gösterge, birden çok zaman dilimindeki tüm para birimlerinin verilerini kullanarak şu veya bu forex çiftinin gücünü hesaplar. Bu veriler, şu veya bu para biriminin gücünü görmek için kullanabileceğiniz, kullanımı kolay para birimi endeksi ve para birimi güç hatları biçiminde temsil edilir. İhtiyacınız olan tek şey, işlem yapmak istediğiniz tabloya göstergeyi eklemektir ve gösterge size
GOLD Impulse with Alert
Bernhard Schweigert
4.56 (9)
Bu gösterge, 2 ürünümüz Advanced Currency IMPULSE with ALERT  +   Currency Strength Exotics  'in süper bir kombinasyonudur. Tüm zaman dilimleri için çalışır ve 8 ana para birimi artı bir Sembol için grafiksel olarak güç veya zayıflık dürtüsünü gösterir! Bu Gösterge, Altın, Egzotik Çiftler, Emtialar, Endeksler veya Vadeli İşlemler gibi herhangi bir sembol için para birimi gücü ivmesini göstermek için uzmanlaşmıştır. Türünün ilk örneğidir, Altın, Gümüş, Petrol, DAX, US30, MXN, TRY, CNH vb.
Scalper Vault
Oleg Rodin
5 (27)
Scalper Vault , başarılı bir scalping için ihtiyacınız olan her şeyi size sağlayan profesyonel bir scalping sistemidir. Bu gösterge, forex ve ikili opsiyon tüccarları tarafından kullanılabilecek eksiksiz bir ticaret sistemidir. Önerilen zaman çerçevesi M5'tir. Sistem size trend yönünde doğru ok sinyalleri sağlar. Ayrıca size üst ve alt sinyaller ve Gann piyasa seviyeleri sağlar. Göstergeler, PUSH bildirimleri dahil her türlü uyarıyı sağlar. Göstergeyi satın aldıktan sonra lütfen benimle iletişim
Market Structure
Reza Aghajanpour
4.85 (26)
** All Symbols x All Timeframes scan just by pressing scanner button ** *** Contact me  to send you instruction and add you in "Market Structure group" for sharing or seeing experiences with other users. Introduction: Market structure is important for both new and professional traders since it can influence the liquidity and price action of a market (Breakout and Retest). It’s also one of the most commonly used techniques to understand trends, identify potential reversal points, and get a feel f
Matrix Arrow Indicator MT4
Juvenille Emperor Limited
5 (3)
Matrix Arrow Indicator MT4 , forex, emtialar, kripto para birimleri, endeksler, hisse senetlerigibi tüm sembollerde/araçlarda kullanılabilen %100 yeniden boyamayan çoklu zaman çerçevesi göstergesini izleyen benzersiz bir 10'u 1 arada trenddir.  Matrix Arrow Indicator MT4 , mevcut eğilimi erken aşamalarında belirleyecek ve aşağıdakiler gibi 10'a kadar standart göstergeden bilgi ve veri toplayacaktır: Ortalama Yönlü Hareket Endeksi (ADX) Emtia Kanal Endeksi (CCI) Klasik Heiken Ashi mumları Hareke
IX Power MT4
Daniel Stein
5 (5)
IX Power nihayet FX Power'ın rakipsiz hassasiyetini Forex dışı sembollere getiriyor. En sevdiğiniz endeksler, hisse senetleri, emtialar, ETF'ler ve hatta kripto para birimlerindeki kısa, orta ve uzun vadeli eğilimlerin yoğunluğunu doğru bir şekilde belirler. Terminalinizin sunduğu her şeyi analiz edebilirsiniz. Deneyin ve işlem yaparken zamanlamanızın nasıl önemli ölçüde iyileştiğini deneyimleyin. IX Power Temel Özellikler 100 hassas, yeniden boyanmayan hesaplama sonuçları - terminalini
ŞU ANDA %31 INDIRIMLI !!! Yeni Başlayanlar veya Uzman Tüccarlar için En İyi Çözüm! Bu gösterge benzersiz, yüksek kaliteli ve uygun fiyatlı bir ticaret aracıdır çünkü bir dizi tescilli özellik ve gizli bir formül ekledik. Yalnızca BİR grafikle 28 döviz çiftinin tümü için Uyarılar verir. Yeni bir trendin veya scalping fırsatının tam tetik noktasını belirleyebildiğiniz için ticaretinizin nasıl gelişeceğini hayal edin! Yeni temel algoritmalar üzerine inşa edilen bu sistem, potansiyel işlemler
Satın aldıktan sonra yorum bırakın, bonus olarak 4 yüksek kaliteli gösterge alın. Chart Patterns All-in-One göstergesi, traderların teknik analizde yaygın olarak kullanılan çeşitli grafik desenlerini görselleştirmelerine yardımcı olur. Bu gösterge, potansiyel piyasa hareketlerini belirlemeye yardımcı olur ancak kârlılığı garanti etmez. Satın almadan önce göstergeyi demo modunda test etmeniz önerilir. Mevcut Teklif : "Chart Patterns All in One" göstergesinde %50 indirim. Dahil Edilen Desenler : 1
Fiyat tersine döndükçe ve geri çekildikçe piyasa yapısından elde edilen kâr değişir. Piyasa yapısını tersine çevirme uyarısı göstergesi, bir trendin veya fiyat hareketinin ne zaman tükenmeye yaklaştığını ve tersine dönmeye hazır olduğunu tanımlar. Genellikle bir geri dönüş veya büyük bir geri çekilme meydana gelmek üzereyken meydana gelen piyasa yapısındaki değişiklikler konusunda sizi uyarır. Gösterge, olası bir tükenme noktasının yakınında her yeni yüksek veya düşük oluştuğunda, başlangıçta
Blahtech Supply Demand
Blahtech Limited
4.61 (33)
Was: $299  Now: $99   Supply Demand uses previous price action to identify potential imbalances between buyers and sellers. The key is to identify the better odds zones, not just the untouched ones. Blahtech Supply Demand indicator delivers functionality previously unavailable on any trading platform. This 4-in-1 indicator not only highlights the higher probability zones using a multi-criteria strength engine, but also combines it with multi-timeframe trend analysis, previously confirmed swings
Yazarın diğer ürünleri
What is the Overlay Chart Indicator? The Overlay Chart indicator is exactly as its name suggests. It is a custom technical indicator which overlays another price chart over the current price chart window. It allows traders to overlay another currency pair over one pair which allows them to compare price movements and the characteristics of price action. It then plots a grid to indicate the price of the overlaid currency pair for better reference. It also plots the open, high, low, and close pric
Obie 1M Scalper Metatrader 4 Forex Robotu, 13 hareketli ortalamadan yararlanan otomatik bir forex ticaret yazılımıdır. Esasen, piyasayı alım/satım ticaret sinyalleri için tarayan bir mantığın formüle edilmesinde çoklu hareketli ortalamaların kullanılması, bu tür uyarıların giderek daha doğru olmasını sağlar. Adından da anlaşılacağı gibi, GBP/USD, EUR/USD, USD/CHF, USD/CAD gibi büyük forex çiftlerinin yanı sıra listelenen hisse senetlerinde 1 dakikalık zaman diliminde en iyi şekilde çalışan
green up = buy red down = sell with alerts! that's how easy it is. --this indicator follows trend --based on moving averages and rsi and macd and pivot points --good for scalping and intraday trading and daytrading --works for swing --recommended time frame is 15m or 5m  contact me after purchase to receive a trading strategy with the indicator with another bonus indicator!
Obie Osilatör göstergesi sıfır seviyesinin üstünde ve altında dalgalanıyor. Sıfır seviyesinin üzerinde fiyatların yükseliş eğiliminde olduğu söyleniyor ve tüccarlar alım satım fırsatlarını arıyor. Sıfır seviyesinin altında fiyatların düşüş eğiliminde olduğu söyleniyor ve tüccarlar satış fırsatları arıyor. Bu göstergenin trend takip eden bir göstergeyle birlikte kullanılması tavsiye edilir. Bu gösterge ölçeklendirme, günlük ticaret, swing ticareti ve pozisyon ticareti için çalışır. Obie
MT5 için Obie Scalper Alerts göstergesi, hem scalpers hem de günlük tüccarlar için mükemmel bir hızlı alım/satım sinyali aracıdır. Sinyallerin anlaşılması çok kolaydır ve ana grafik penceresinde mavi ve kırmızı renkli noktalar olarak görünürler. Al & sat sinyali: Mavi nokta bir satın alma sinyalidir. Kırmızı nokta satış sinyalidir. Göstergenin farklı ayarları ve giriş değerleri ile deneme yapmaktan çekinmeyin. Gösterge, tüm döviz çiftlerinde (majör, minör ve egzotik) eşit derecede iyi çal
Trendi takip eden ve yeniden boyamayan forex ticaret göstergesi. Sinyalleri tamamen otomatik bir şekilde hesaplanır ve sağlanır ve hareketli ortalama kavşaklara dayanır. Bu sinyaller basit al/sat okları şeklinde sunulduğu için acemi dostu bir araçtır. Bununla birlikte, sinyal güvenilirliği gerçekten sağlamdır. Herhangi bir forex ticaret stratejisi ile birlikte kullanabilirsiniz. Trend Sinyalleri Uyarı Göstergesi, her tür zaman dilimine ve döviz çiftine uyar. Doğrudan ana ticaret tablosund
Mavi ve kırmızı destek ve direnç seviyeleri doğrudan grafikte görüntülenir. Direnç üstü kapanış ve desteğin altındaki kapanış için uyarılar. Varsayılanlar: EnableNativeAlerts = false; EnableEmailAlerts = yanlış; EnablePushAlerts = false; Ticaret yapmak gerçekten çok kolay. SR ticareti gibisi yok! Yasal Uyarı: Destek, talebin yoğunlaşması nedeniyle düşüş eğiliminin duraklaması beklendiğinde ortaya çıkar. Arz yoğunlaşması nedeniyle yükseliş eğiliminin geçici olarak duraklaması bekle
Trend değişikliği > Oklar ('Yukarı' ve 'Aşağı') Gösterge arabelleğinde simge göründüğünde ('Yukarı' veya 'Aşağı'), Uyarılar tetiklenir. Yanlış sinyalleri azaltmak için 200 EMA kullanabilirsiniz. Ok göründüğünde ticarete girin ancak mum kapanana kadar bekleyin Çizginin rengi değiştiğinde ticareti kapatın veya kendi kapanış stratejinizi kullanın. Tüm zaman dilimlerinde çalışır Tüm para birimlerinde çalışır Not diğer göstergelerle veya mevcut bir stratejiyle daha iyi çalışır
ObieTrader kısa vadeli bir sinyal göstergesidir. Gün içi ticarette kullanılır. ObieTrader, Williams yüzde R göstergesini ve ortalama gerçek aralığı kullanarak kısa vadeli eğilimi belirler. Gösterge kısa vadeli bir trendi doğruladığında, trendi göstermek için çubuk üzerinde semaforlar çizer. Kırmızı noktalı çubuklar düşüş trendini, mavi noktalı çubuklar ise yükseliş trendini gösterir. Bir trend belirlendiğinde trend yönünde pozisyonlar açın. Kırmızı daireler göründüğünde kısa pozisyon açın. Ma
Filtrele:
İnceleme yok
İncelemeye yanıt