Range Detector Multi TimeFrame
- Göstergeler
- Adil Mohsine
- Sürüm: 1.0
- Etkinleştirmeler: 5
The Range Detector indicator calculates the price range between the highest and lowest prices over a specified period and visually represents this range on the price chart. It provides valuable insights into market volatility, helping traders identify potential breakout or reversal points.
How it Works:
Calculation of Range:
1. The indicator first calculates the price range by finding the highest high and lowest low prices over a user-defined period, often using a specific number of candles or a time frame.
2. Drawing High and Low Lines:
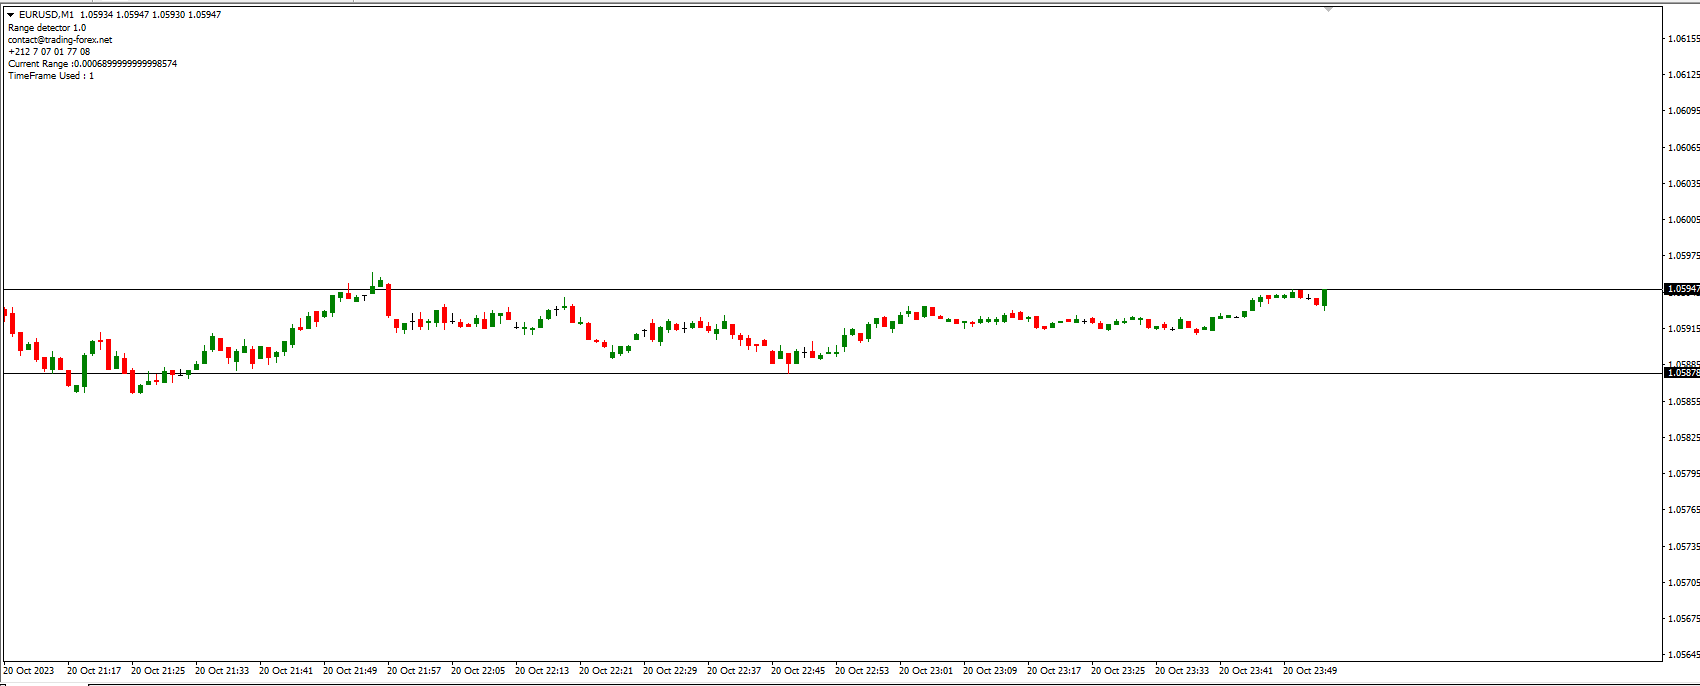
High Price Line: A horizontal line is drawn at the level of the highest high price within the specified period. This line serves as a visual reference for the upper boundary of the price range.
Low Price Line: Another horizontal line is drawn at the level of the lowest low price within the same period. This line serves as a visual reference for the lower boundary of the price range.
By displaying these lines on the chart, traders can quickly assess the current price position relative to recent market volatility. If the current price approaches or breaks above the high price line, it may indicate bullish momentum. Conversely, approaching or breaking below the low-price line might suggest bearish pressure.
Key Features:
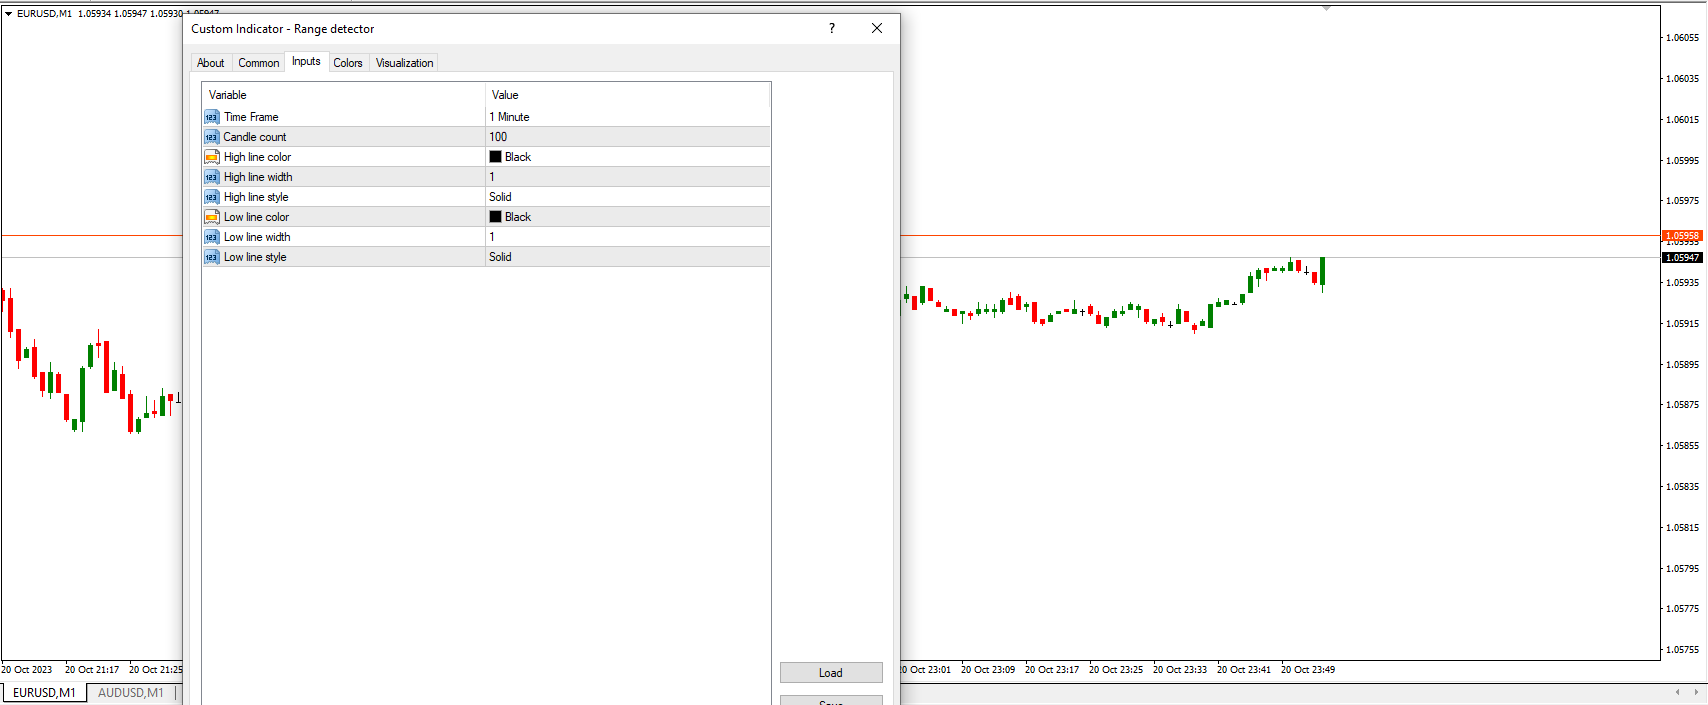
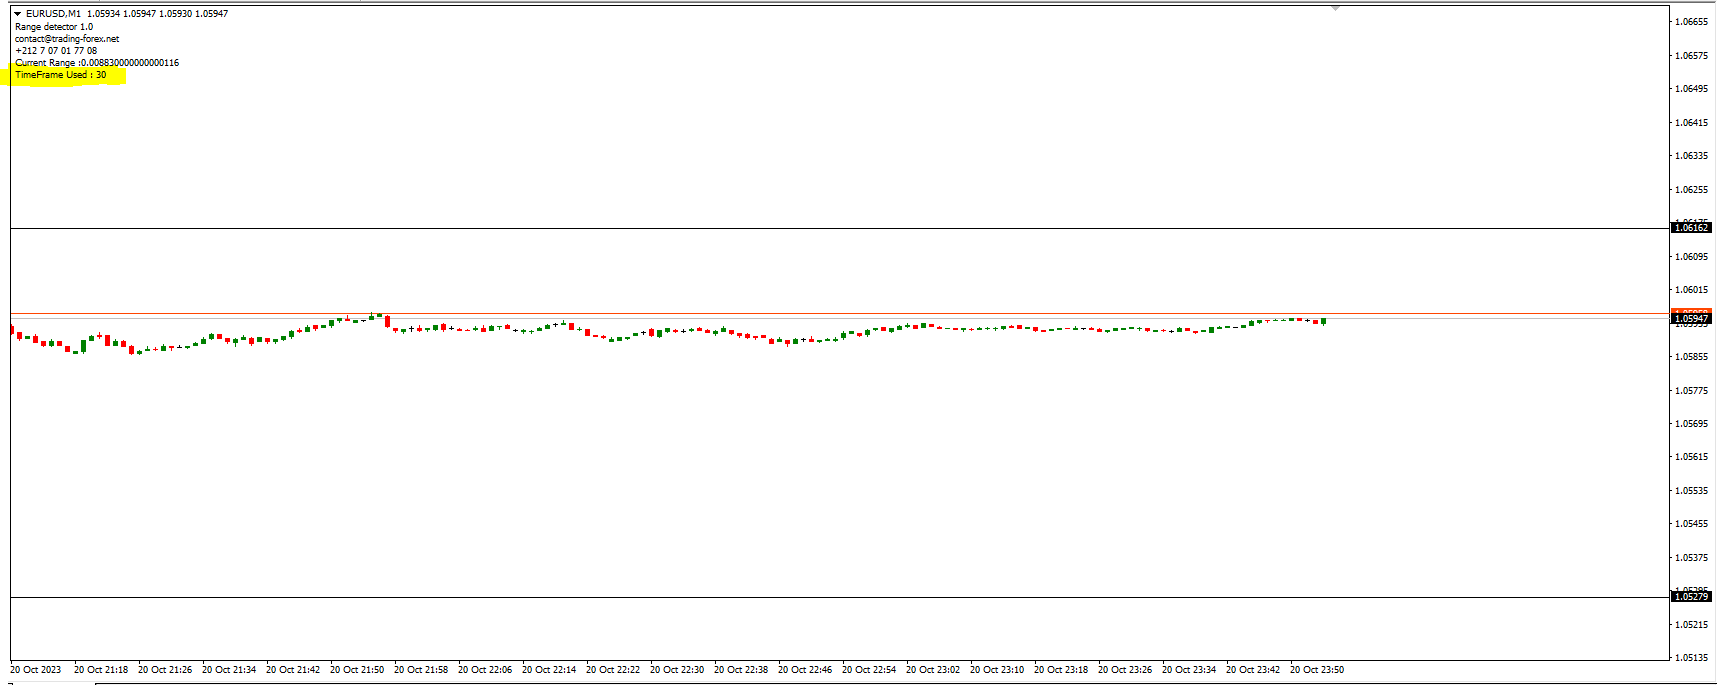
· Customizable Period: Traders can adjust the indicator's period to analyse shorter or longer-term price ranges based on their trading strategy and preferences.
· Visual Clarity: The indicator's graphical representation makes it easy for traders to identify significant price levels briefly, aiding decision-making processes.
· Volatility Insights: By observing how price behaves around the high and low lines, traders gain insights into market volatility, helping them make informed trading choices.
Usage Tips:
· Confirmation Tool: Traders often use the high and low lines in conjunction with other technical indicators or chart patterns to confirm potential entry or exit points.
· Trend Assessment: When combined with trend analysis, these lines can help traders assess the strength of an ongoing trend. A strong trend typically sees prices staying closer to the high price line in an uptrend and the low-price line in a downtrend.
· Support and Resistance: The low-price line can act as a support level, and the high price line can act as a resistance level. Price interactions around these lines may signal potential reversals or breakouts.