• Genel bakış
  • İncelemeler
  • Yorumlar

Cobra Levels

Kobra Seviyeleri

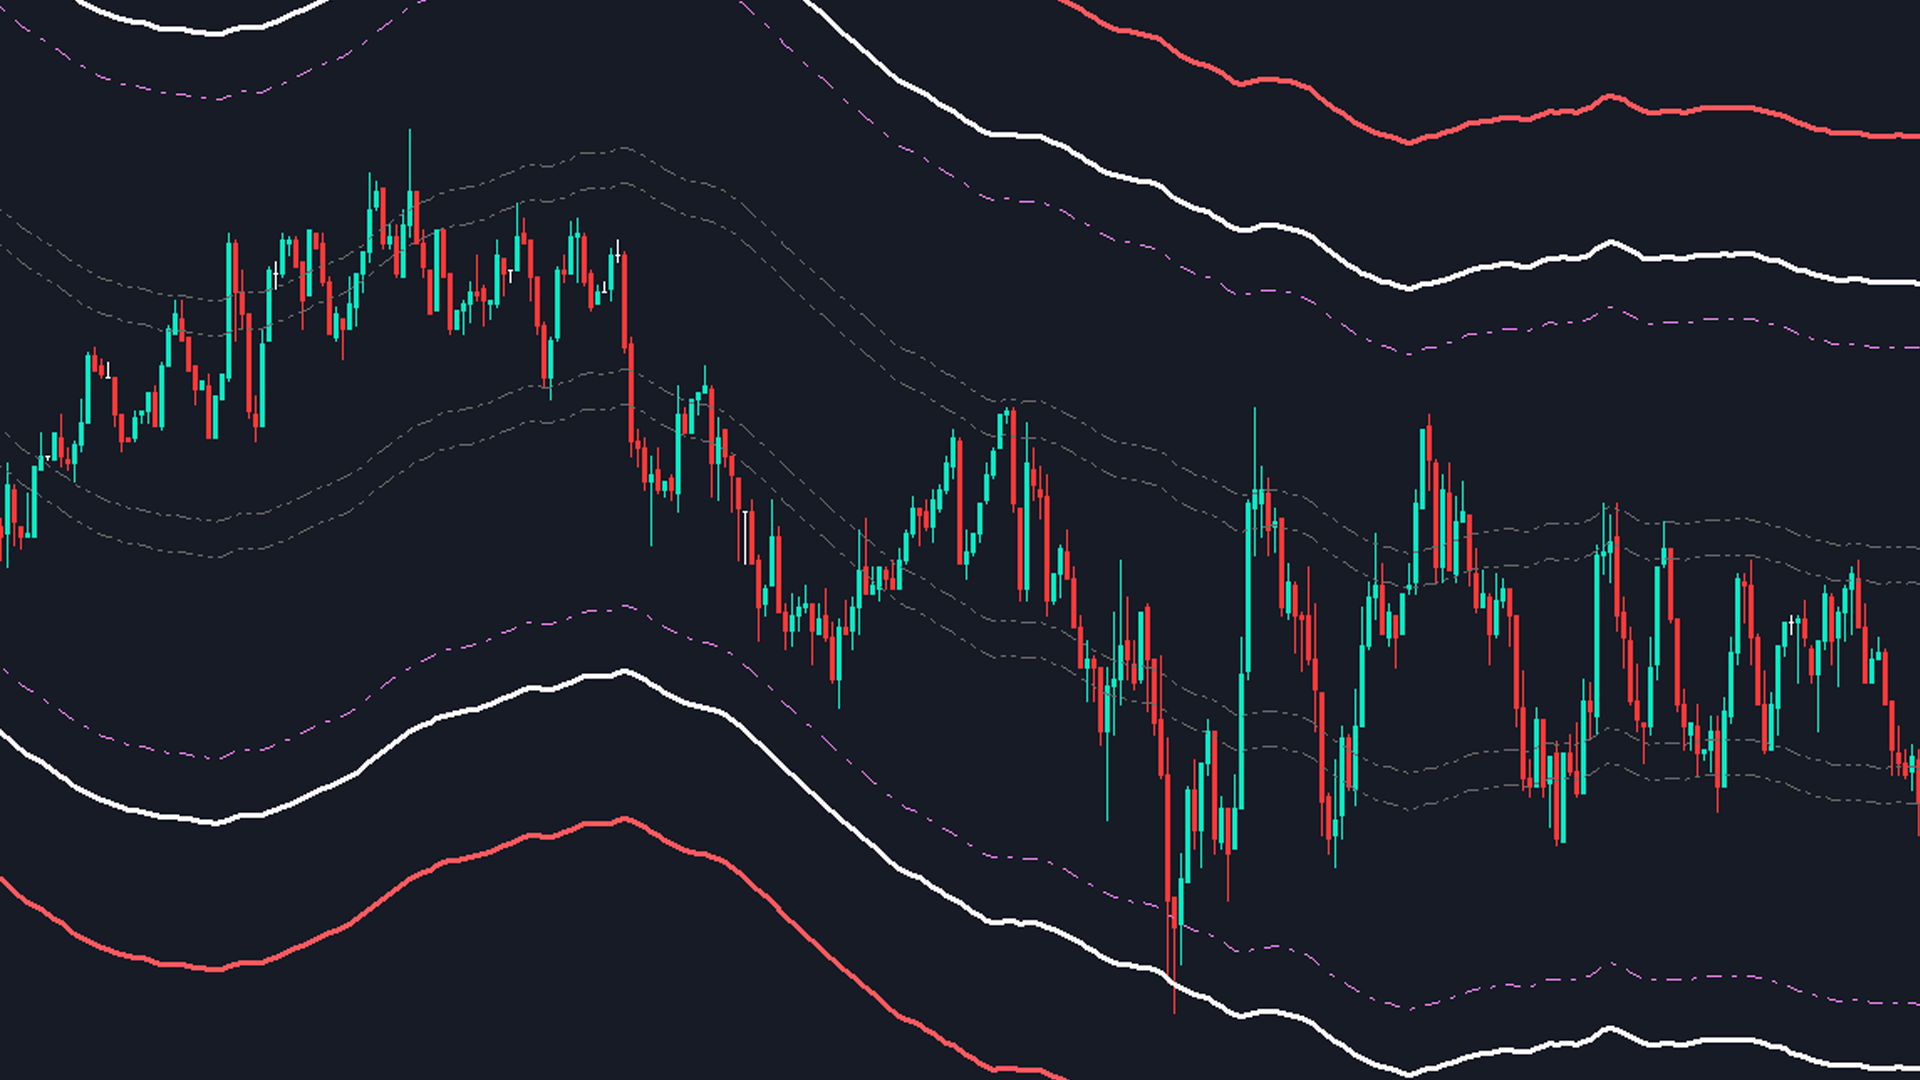
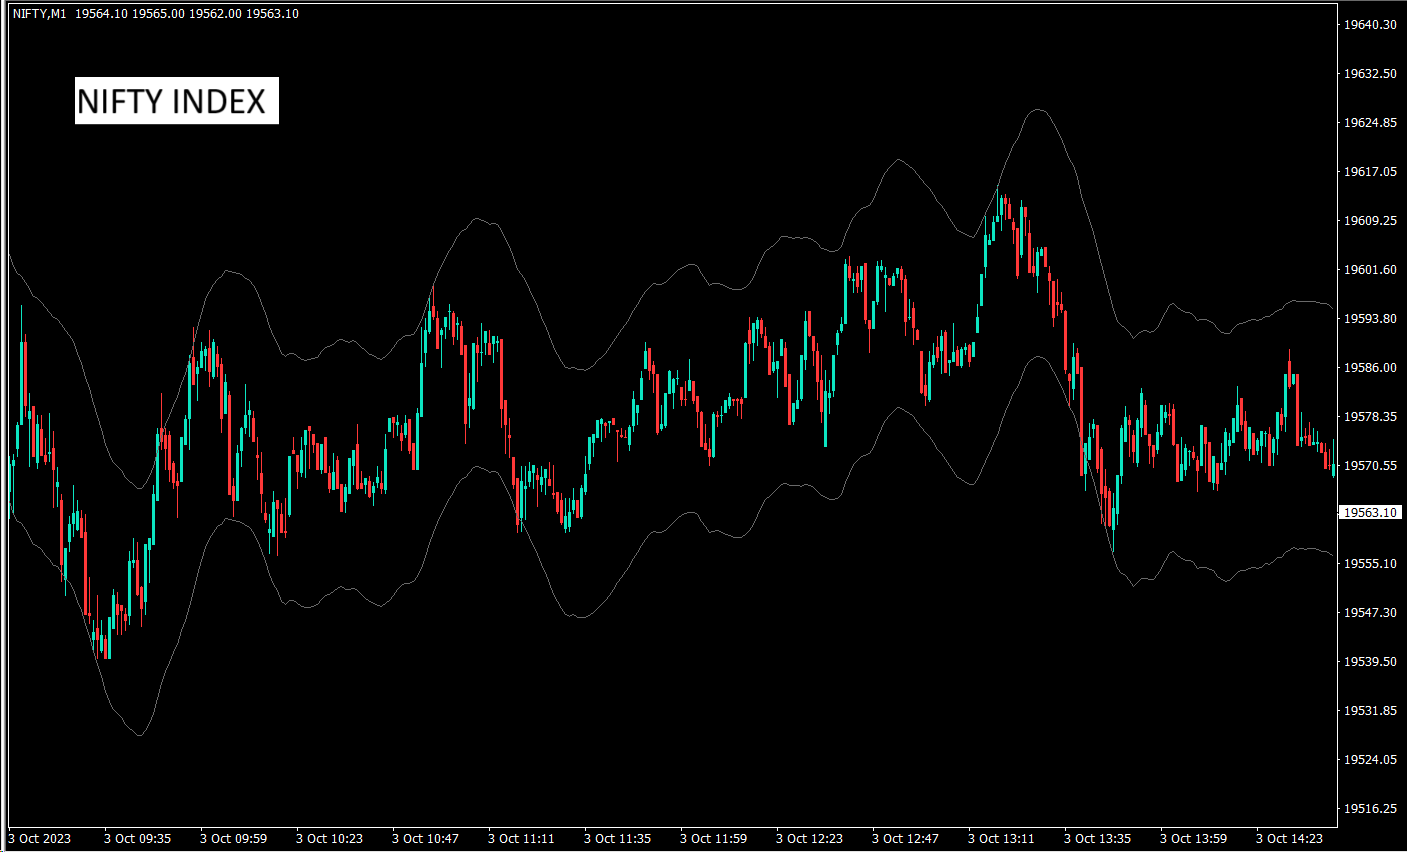
Bunlar, forex, kripto, emtia, şık ve banknifty dahil olmak üzere evrensel piyasada çalışan iki frekans moduna sahip 6 seviye setidir. Finansal araçlara ilişkin en iyi araştırmalardan sonra yayınlanırlar.

Üst seviyeler U1 ila U5, alt seviyeler ise D1 ila D5 olarak adlandırılır.
Piyasa, normal durumda U3 veya D3'e kadar iç kanallardan veya değişken durumda U4'ten U5'e veya D4'ten D5'e kadar dış kanallardan hareket edebilir. Fiyat U3 U4 U5 veya D3 D4 D5'e ulaştığında, geri dönüş şansı çok yüksektir ve tüccar girişi onaylamak için mum çubuğunun kapanmasını beklemeli ve geçerli risk yönetimi ile ticaret yapmalıdır.


Bu gösterge, gösterge ayarlarındaki özelleştirme seçenekleriyle seviyeleri değiştirmenizi sağlar. Kullanıcı + veya - noktaları ekleyerek seviyeleri özelleştirebilir

1. Zaman Çerçevesi üzerinde çalışıyorlar: Yalnızca M1, M3, M5, M15, H1 ve H4.
2. Gün içi, swing ve pozisyonel ticaret yöntemlerine uygundur
3. Diğer göstergelerle karşılaştırıldığında araştırmaya dayalı en iyi aşırı alım ve aşırı satım dönüm noktalarını bulmaya yardımcı olun
4. Dinamik Seviyeler : Seviye değeri zamana göre her dakika değişir ancak fiyat her koşulda bu seviyelere ulaşacak kriterleri aştığında bir döngü takip edilir ve geri dönüş görülebilir.
5. Uyarıları ve Anlık Bildirimi Dahil Edin


Ticaret stratejisi hakkında daha fazla bilgi için DM'den bana ulaşabilirsiniz.
Önerilen ürünler
Free automatic Fibonacci is an indicator that automatically plots a Fibonacci retracement based on the number of bars you select on the BarsToScan setting in the indicator. The Fibonacci is automatically updated in real time as new highest and lowest values appears amongst the selected bars. You can select which level values to be displayed in the indicator settings. You can also select the color of the levels thus enabling the trader to be able to attach the indicator several times with differe
FREE
Follow The Line MT5
Oliver Gideon Amofa Appiah
4.42 (31)
This indicator obeys the popular maxim that: "THE TREND IS YOUR FRIEND" It paints a GREEN line for BUY and also paints a RED line for SELL. (you can change the colors). It gives alarms and alerts of all kinds. IT DOES NOT REPAINT and can be used for all currency pairs and timeframes. Yes, as easy and simple as that. Even a newbie can use it to make great and reliable trades. NB: For best results, get my other premium indicators for more powerful and reliable signals. Get them here: https://www.m
FREE
The idea of the system is to indentify the reversal patterns using the calculation of the composite candle. The reversal patterns is similar to the "Hammer" and "Hanging Man" patterns in Japanese candlestick analysis. But it uses the composite candle instead the single candle and doesn't need the small body of the composite candle to confirm the reversal. Input parameters: Range - maximal number of bars, used in the calculation of the composite candle. Minimum - minimal size of the composite can
FREE
Trend Yakalayıcı: Alarm İndikatörü ile Trend Yakalayıcı Stratejisi, piyasa trendlerini ve potansiyel giriş ve çıkış noktalarını belirlemede yardımcı olan çok yönlü bir teknik analiz aracıdır. Piyasa koşullarına uyum sağlayarak trend yönünün net görsel temsili için dinamik bir Trend Yakalayıcı Stratejisi sunar. Tüccarlar tercihlerine ve risk toleranslarına göre parametreleri özelleştirebilirler. Gösterge, trendleri tanımlamaya yardımcı olur, potansiyel ters dönüşleri sinyaller, trailing stop m
FREE
Mitimom
Danil Poletavkin
The indicator is based on Robert Miner's methodology described in his book "High probability trading strategies" and displays signals along with momentum of 2 timeframes. A Stochastic oscillator is used as a momentum indicator. The settings speak for themselves period_1 is the current timeframe, 'current' period_2 is indicated - the senior timeframe is 4 or 5 times larger than the current one. For example, if the current one is 5 minutes, then the older one will be 20 minutes The rest of the
FREE
Spike Catch Pro 22:03 release updates Advanced engine for searching trade entries in all Boom and Crash pairs (300,500 and 1000) Programmed strategies improvements Mx_Spikes (to combine Mxd,Mxc and Mxe), Tx_Spikes,   RegularSpikes,   Litho_System,   Dx_System,   Md_System,   MaCross,   Omx_Entry(OP),  Atx1_Spikes(OP),   Oxc_Retracement (AT),M_PullBack(AT) we have added an arrow on strategy identification, this will help also in the visual manual backtesting of the included strategies and see h
FREE
Are you tired of drawing trendlines every time you're analyzing charts? Or perhaps you would like more consistency in your technical analysis. Then this is for you. This indicator will draw trend lines automatically when dropped on a chart. How it works Works similar to standard deviation channel found on mt4 and mt5. It has 2 parameters: 1. Starting Bar 2. Number of bars for calculation The   starting bar   is the bar which drawing of the trend lines will begin, while the   number of bars for c
FREE
Super Trend eu
Emin Ulucanli
4.75 (4)
SUPER TREND; Olivier Seban tarafından oluşturulan Supertrend ATR ‘ye dayanan ve trendi takip eden bir göstergedir. Trend yönündeki değişiklikleri tespit etmek ve durakları konumlandırmak için kullanılabilir. Fiyat gösterge eğrisinin altına düştüğünde kırmızıya döner ve bir düşüş trendine işaret eder. Tersine, fiyat eğrinin üzerine çıktığında, gösterge yeşile döner ve bir yükseliş trendine işaret eder. Diğer göstergeler gibi, Supertrend ’de, MACD, parabolik SAR, Bollinger Band veya RSI gibi diğer
FREE
Bollinger Bands B
Flavio Javier Jarabeck
5 (3)
John Bollinger created this indicator in 2010 as a way to read the original indicator (Bollinger Bands) in a more "technical" way, shown as an oscillator. The typical range of the Bollinger Bands %B is 0 - 0.5 - 1.0, where "0" represents the lower band, the "0.5" the middle band, and "1" the upper band. The line on the indicator represents the Closing prices. As simple as that. SETTINGS Bollinger Bands period of analysis Standard Deviation multiplier Shift Price type to be analyzed If you
FREE
Donchian Pro
Paulo Henrique Faquineli Garcia
5 (2)
The Donchian Channel Channels are among the most popular tools of technical analysis, as they visually convey to the analyst the limits within which most price movement tends to occur. Channel users know that valuable information can be obtained at any time, whether prices are in the central region of a band or close to one of the border lines. One of the best known techniques to explore these concepts is Bollinger Bands. However, John Bollinger was not the only one to research the applicatio
FREE
KT Renko Patterns MT5
KEENBASE SOFTWARE SOLUTIONS
KT Renko Patterns scans the Renko chart brick by brick to find some famous chart patterns that are frequently used by traders across the various financial markets. Compared to the time-based charts, patterns based trading is easier and more evident on Renko charts due to their uncluttered appearance. KT Renko Patterns features multiple Renko patterns, and many of these patterns are extensively explained in the book titled Profitable Trading with Renko Charts by Prashant Shah. A 100% automate
WAPV Weis Wave Chart Forex
Eduardo Da Costa Custodio Santos
MT5 için Weis Wave Chart Forex bir Fiyat ve Hacim göstergesidir. Fiyat ve Hacim okuması, Richard Demille Wyckoff tarafından oluşturulan üç yasaya dayalı olarak geniş çapta dağıtıldı: Arz ve Talep, Neden ve Etki ve Çabaya Karşı Sonuç. 1900'de R.Wyckoff, analizlerinde dalga grafiğini zaten kullanmıştı. Yıllar sonra, 1990 civarında, David Weis Otomatikleştirilmiş R. Wyckoff'un dalga grafiği ve bugün size David Weis'in dalga grafiğinin evrimini sunuyoruz. Varlıkta üretilen dalga ile ilgili Hacim mik
LT Donchian Channel
Thiago Duarte
4.75 (4)
Donchian Channel is an indicator created by Richard Donchian. It is formed by taking the highest high and the lowest low of the last specified period in candles. The area between high and low is the channel for the chosen period. Its configuration is simple. It is possible to have the average between the upper and lower lines, plus you have alerts when price hits one side. If you have any questions or find any bugs, please contact me. Enjoy!
FREE
Prototype Swinger use swing method (with long Takeprofit) for  Nasdaq/ US100/ USTEC/ NAS100/ NDX/ NQ index.  This EA is designed with candle breakout, Force index divergence, MFI, Moving Average and other secret indicator/ method for entry position. This EA is a single entry method use stop loss and take profit with ATR. This EA use swing method (with long takeprofit), maybe make boring for waiting SL & TP. If you need more aggressive EA, you can try Master Nasdaq (daytrading with different me
ADX consolidado
OTAVIO AGUIAR CAMPOS Aguiar
4.8 (5)
Mostra a média móvel quando ADX > 20 e pinta de verde ou vermelho quando os valores de ADX estão subindo indicando tendência. Quando o ADX é menor que 20 indica movimento lateral consolidado. O indicador não define pontos de entrada, somente mostra a média colorida quando a tendência está se fortalecendo. Faz parte do grupo de indicadores do Indicador Tavim.
FREE
QuantumAlert RSI Navigator is a free indicator available for MT4/MT5 platforms, its work is to provide "alerts" when the market is inside "overbought and oversold" regions in the form of "buy or sell" signals. This indicator comes with many customization options mentioned in the parameter section below, user can customise these parameters as needful. Join our MQL5 group , where we share important news and updates. You are also welcome to join our private channel as well, contact me for the priva
FREE
Tabajara V5
Flavio Javier Jarabeck
4.88 (42)
Metatrader 5 version of the famous Andre Machado's Tabajara indicator. If you don't know Andre Machado's Technical Analysis work you don't need this indicator... For those who need it and for those several friend traders who asked this porting from other platforms, here it is... FEATURES 8-period Moving Average 20-period Moving Average 50-period Moving Average 200-period Moving Average Colored candles according to the inflexion of the 20-period MA SETTINGS You can change the Period of all M
FREE
Limitless MT5
Dmitriy Kashevich
Limitless MT5 is a universal indicator suitable for every beginner and experienced trader. works on all currency pairs, cryptocurrencies, raw stocks Limitless MT5 - already configured and does not require additional configuration And now the main thing Why Limitless MT5? 1 complete lack of redrawing 2 two years of testing by the best specialists in trading 3 the accuracy of correct signals exceeds 80% 4 performed well in trading during news releases Trading rules 1 buy signa
QuantumAlert Stoch Navigator is a free indicator available for MT4/MT5 platforms, its work is to provide "alerts" when the market is inside "overbought and oversold" regions in the form of "buy or sell" signals. This indicator comes with many customization options mentioned in the parameter section below, user can customise these parameters as needful. Join our   MQL5 group , where we share important news and updates. You are also welcome to join our private channel as well, contact me for the p
FREE
- This is the exact conversion from TradingView: "Support/Resistance" By "BarsStallone". - This indicator lets you read the buffers for R/S values. - This is a non-repaint and light processing load indicator. - This is not a multi time frame indicator If you want the multi time frame version you should create a personal order and I deliver two files that you need them both to have the multi time frame indicator running on your system. - The MT4 version of the indicator is not light load from pr
Bar Color Trend
Germano Chagas
4.5 (10)
Combining the best of Price Action , Directional Movement , and Divergence/Convergence analysis, Candle Color Trend is a easy and reliable way to identify trend direction. The indicator automatically paints the candles according to the assumption that an uptrend is defined by prices that form a series of higher highs and higher lows. In contrast, a downtrend is defined by prices that form a series of lower highs and lower lows. Additionally, ADX Wilder indicator is used to measure trend weakness
FREE
Easy GOLD MT5
Franck Martin
4.1 (30)
Easy Gold is the latest addition to the BotGPT family. It is surprising and very powerful. It is ideal for beginners due to its simplicity.  There is absolutely nothing to do, it's 100% automated, simply indicate the percentage of risk you want to take per trade and the EA is ready. Whatever your capital, the EA takes care of everything. Optimized on (XAUUSD).  Unleash all the power with the professional version (AGI Gold) and its connection to the neural network, available in my store. My othe
FREE
Introducing the Ultimate Custom Time Range Indicator: Unlock Precision in Your Trading Strategies! Versatile Applications: Ideal for kill zones, trading sessions, and time macro analysis, silver bullet timings. You can have as many time ranges as you need to help identify the highest to lowest range within the specified start to end broker time. Note: most brokers operate in GMT +3 - so please convert and use your own broker time. 
MIDAS Super VWAP
Flavio Javier Jarabeck
4.29 (14)
Imagine VWAP, MVWAP and MIDAS in one place... Well, you found it! Now you can track the movement of Big Players in various ways, as they in general pursue the benchmarks related to this measuring, gauging if they had good execution or poor execution on their orders. Traders and analysts use the VWAP to eliminate the noise that occurs throughout the day, so they can measure what prices buyers and sellers are really trading. VWAP gives traders insight into how a stock trades for that day and deter
FREE
The new update makes this indicator a complete tool for studying, analyzing and operating probabilistic patterns. It includes: On-chart Multi-asset percentage monitor. Configurable martingales. Twenty-one pre-configured patterns, including Mhi patterns and C3. An advanced pattern editor to store up to 5 custom patterns. Backtest mode to test results with loss reports. Trend filter. Hit operational filter. Martingale Cycles option. Various types of strategies and alerts. Confluence between patter
Cybertrade Keltner Channels - MT5 Created by Chester Keltner, this is a volatility indicator used by technical analysis. It is possible to follow the trend of financial asset prices and generate support and resistance patterns. In addition, envelopes are a way of tracking volatility in order to identify opportunities to buy and sell these assets. It works on periods longer than the period visible on the chart. All values ​​are available in the form of buffers to simplify possible automations.
FREE
Time Spaced Moving Averages
Flavio Javier Jarabeck
4.67 (6)
The concept is simple: Plotting Price behavior within several periods of time. Some Symbols behave very well during the trading day - with this I mean Intraday trading - and this behavior ends up plotting effectively well with the proposed Exponential Moving Averages in this indicator... Obviously that this behavior could not be seen in all Symbols, but you can give it a try... Just drop this indicator in a chart and you will see for yourself... This indicator is intended for "Feeling the Trend
FREE
Supports And Resistances Lines
Francisco Gomes Da Silva
4.76 (41)
Destek ve Direnç bölgeleri Göstergesi MT5 bu gösterge, tepeleri ve dipleri otomatik olarak nasıl belirleyeceğini bilir. Bu destek ve direnç göstergesi, üst ve alt noktalara göre destek çizgileri ve direnç çizgileri oluşturur. destek ve direnç çizgileri nasıl yapılır? Bu, otomatik destek ve direnç çizgileri oluşturmanın bir göstergesidir. gösterge ile destek seviyesi nasıl bulunur? bu gösterge, tepeleri ve dipleri otomatik olarak bulur. Gösterge, "ZigZag" otomatik olarak bir dip oluşturduğunda ve
FREE
Quarter EMA
Jithin Sajan Sajan
5 (1)
Kindly rate and comment about the product for upgradation & Support The 5 EMA is plotted in green color ( Lime ). The 14 EMA is plotted in red color ( Red ). The 20 EMA is plotted in blue color ( Blue ). The 200 EMA is plotted in yellow color ( Yellow ). The Quarter EMA that provided calculates and plots four Exponential Moving Averages (EMAs) on the chart using different periods: 5, 14, 20, and 200. Each EMA is represented by a different color on the chart. Here's a description of each
FREE
Bu ürünün alıcıları ayrıca şunları da satın alıyor
Atomic Analyst MT5
Issam Kassas
4.79 (19)
Öncelikle belirtmek gerekir ki bu Ticaret Göstergesi Yeniden Çizim Yapmaz, Gecikmez ve Gecikme Göstermez, bu da hem manuel hem de robot ticareti için ideal hale getirir. Kullanıcı kılavuzu: ayarlar, girişler ve strateji. Atom Analisti, Piyasada Daha İyi Bir Avantaj Bulmak İçin Fiyatın Gücünü ve Momentumunu Kullanan PA Fiyat Hareketi Göstergesidir. Gürültüleri ve Yanlış Sinyalleri Kaldırmaya ve Ticaret Potansiyelini Artırmaya Yardımcı Olan Gelişmiş Filtrelerle Donatılmıştır. Birden fazla katmanl
Atbot
Zaha Feiz
4.96 (28)
AtBot: Come funziona e come usarlo ### Come funziona L'indicatore "AtBot" per la piattaforma MT5 genera segnali di acquisto e vendita utilizzando una combinazione di strumenti di analisi tecnica. Integra la Media Mobile Semplice (SMA), la Media Mobile Esponenziale (EMA) e l'indice di Gamma Vero Medio (ATR) per identificare opportunità di trading. Inoltre, può utilizzare le candele Heikin Ashi per migliorare la precisione dei segnali. Lascia una recensione dopo l'acquisto e ricevi un regalo bonu
Öncelikle, bu Ticaret Sistemi'nin Non-Repainting, Non-Redrawing ve Non-Lagging Göstergesi olduğunu vurgulamak önemlidir, bu da hem manuel hem de robot ticareti için ideal hale getirir. Online kurs, kılavuz ve ön ayarları indir. "Smart Trend Trading System MT5", yeni ve deneyimli tüccarlar için özelleştirilmiş kapsamlı bir ticaret çözümüdür. 10'dan fazla premium göstergeyi birleştiriyor ve 7'den fazla sağlam ticaret stratejisi sunuyor, bu da çeşitli piyasa koşulları için esnek bir seçim yapar. Tr
Gold Stuff mt5
Vasiliy Strukov
4.9 (185)
Gold Stuff mt5, özellikle altın için tasarlanmış bir trend göstergesidir ve herhangi bir finansal enstrümanda da kullanılabilir. Gösterge yeniden çizilmez ve gecikmez. Önerilen zaman dilimi H1. Ayarları ve kişisel bir bonusu almak için satın alma işleminden hemen sonra benimle iletişime geçin!  Güçlü Destek ve Trend Tarayıcı göstergemizin ücretsiz bir kopyasını pm'den alabilirsiniz. Ben!   AYARLAR Ok Çiz - açık kapalı. grafik üzerinde oklar çizmek. Uyarılar - sesli uyarılar kapalı. E-post
TPSproTREND PrO MT5
Roman Podpora
4.89 (9)
TPSpro TREND PRO  - is a trend indicator that automatically analyzes the market and provides information about the trend and each of its changes, as well as giving signals for entering trades without redrawing! The indicator uses each candle, analyzing them separately. referring to different impulses - up or down impulse. Exact entry points into transactions for currencies, crypto, metals, stocks, indices!  Version MT4               DETAILED DESCRIPTION               R ecommended to use with an
TPSpro RFI Levels MT5
Roman Podpora
4.67 (9)
Reversal First Impulse levels (RFI)      INSTRUCTIONS        RUS       -       ENG              R ecommended to use with an indicator   -   TPSpro  TREND PRO -  Version MT4                 A key element in trading is zones or levels from which decisions to buy or sell a trading instrument are made. Despite attempts by major players to conceal their presence in the market, they inevitably leave traces. Our task was to learn how to identify these traces and interpret them correctly. Main functi
Top indicator for MT5   providing accurate signals to enter a trade without repainting! It can be applied to any financial assets:   forex, cryptocurrencies, metals, stocks, indices .  Watch  the video  (6:22) with an example of processing only one signal that paid off the indicator! MT4 version is here It will provide pretty accurate trading signals and tell you when it's best to open a trade and close it. Most traders improve their trading results during the first trading week with the help of
Öncelikle, bu Ticaret Aracının Non-Repainting, Non-Redrawing ve Non-Lagging Gösterge olduğunu vurgulamakta fayda var, bu da onu profesyonel ticaret için ideal hale getiriyor. Çevrimiçi kurs, kullanıcı kılavuzu ve demo. Akıllı Fiyat Hareketi Kavramları Göstergesi, hem yeni hem de deneyimli tüccarlar için çok güçlü bir araçtır. İleri ticaret fikirlerini, Inner Circle Trader Analizi ve Smart Money Concepts Ticaret Stratejileri gibi 20'den fazla kullanışlı göstergeyi bir araya getirerek bir aray
Quantum Trend Sniper
Bogdan Ion Puscasu
4.92 (48)
Tanıtım       Kuantum Trend Keskin Nişancı Göstergesi   , trend tersine dönmeleri belirleme ve ticaret yapma şeklinizi değiştiren çığır açan MQL5 Göstergesi! 13 yılı aşkın ticaret tecrübesine sahip deneyimli tüccarlardan oluşan bir ekip tarafından geliştirilmiştir.       Kuantum Trend Keskin Nişancı Göstergesi       trend dönüşlerini son derece yüksek doğrulukla belirlemenin yenilikçi yolu ile ticaret yolculuğunuzu yeni zirvelere taşımak için tasarlanmıştır. ***Kuantum Trend Keskin Nişancı Gö
Trend Screener Pro MT5
STE S.S.COMPANY
4.88 (67)
Trend Göstergesi, Trend Alım Satım ve Filtreleme için Çığır Açan Benzersiz Çözüm, Tüm Önemli Trend Özellikleriyle Tek Bir Araç İçinde Yerleştirildi! Forex, emtialar, kripto para birimleri, endeksler ve hisse senetleri gibi tüm sembollerde/araçlarda kullanılabilen %100 yeniden boyamayan çoklu zaman çerçevesi ve Çoklu para birimi göstergesidir. Trend Screener, grafikte noktalarla ok trend sinyalleri sağlayan etkili bir trend trend göstergesidir. Trend analizörü göstergesinde bulunan özellikler: 1.
FX Power MT5 NG
Daniel Stein
5 (6)
Sabah Brifingimiz burada mql5 ve on Telegram! FX Power MT5 NG , uzun zamandır çok popüler olan döviz gücü ölçerimiz FX Power'ın yeni neslidir. Peki bu yeni nesil güç ölçer ne sunuyor? Orijinal FX Power hakkında sevdiğiniz her şey PLUS GOLD/XAU güç analizi Daha da hassas hesaplama sonuçları Ayrı ayrı yapılandırılabilir analiz dönemleri Daha da iyi performans için özelleştirilebilir hesaplama limiti Özel çokluDaha fazlasını görmek isteyenler için örnek ayarlar Her grafikte en sevdiğiniz renkler i
FX Volume MT5
Daniel Stein
4.94 (17)
Sabah Brifingimiz aracılığıyla ayrıntılar ve ekran görüntüleri ile günlük piyasa güncellemenizi alın burada mql5 ve on Telegram ! FX Volume, bir brokerin bakış açısından piyasa duyarlılığı hakkında GERÇEK bir fikir veren İLK ve TEK hacim göstergesidir. COT raporlarından çok daha hızlı bir şekilde, brokerlar gibi kurumsal piyasa katılımcılarının Forex piyasasında nasıl konumlandıklarına dair harika bilgiler sağlar. Bu bilgileri doğrudan grafiğinizde görmek, ticaretiniz için gerçek oyun değiştir
IX Power MT5
Daniel Stein
4.17 (6)
IX Power   nihayet FX Power'ın rakipsiz hassasiyetini Forex dışı sembollere getiriyor. En sevdiğiniz endeksler, hisse senetleri, emtialar, ETF'ler ve hatta kripto para birimlerindeki kısa, orta ve uzun vadeli eğilimlerin yoğunluğunu doğru bir şekilde belirler. Terminalinizin sunduğu   her şeyi analiz   edebilirsiniz. Deneyin ve işlem yaparken   zamanlamanızın   nasıl   önemli ölçüde iyileştiğini   deneyimleyin. IX Power Temel Özellikler 100 hassas, yeniden boyanmayan hesaplama sonuçları -
XQ Indicator MetaTrader 5
Marzena Maria Szmit
3.5 (2)
Step into the realm of Forex trading with confidence and precision using XQ, a cutting-edge Forex indicator designed to elevate your trading game to unprecedented heights. Whether you're a seasoned trader or just stepping into the world of currency exchange, XQ Forex Indicator empowers you with the insights and signals needed to make informed trading decisions. The signal conditions are a combination of three indicators, and XQ Forex Indicator only display  medium and long-term trends . The ind
Easy By Sell is a market indicator for opening and closing positions. It becomes easy to track market entries with alerts. It indicates trend reversal points when a price reaches extreme values ​​and the most favorable time to enter the market. it is as effective as a Fibonacci to find a level but it uses different tools such as an algorithm based on ATR indicators and Stochastic Oscillator. You can modify these two parameters as you wish to adapt the settings to the desired period. My othe
Bu gösterge paneli, seçilen semboller için mevcut en son   harmonik kalıpları   gösterir, böylece zamandan tasarruf edersiniz ve daha verimli olursunuz /   MT4 sürümü . Ücretsiz Gösterge:   Basic Harmonic Pattern Gösterge sütunları Symbol :   seçilen semboller görünecektir Trend:   yükseliş veya düşüş Pattern :   desen türü (gartley, kelebek, yarasa, yengeç, köpekbalığı, cypher veya ABCD) Entry :   giriş fiyatı SL:   zararı durdur fiyatı TP1:   1. kar alma fiyatı TP2:   2. kar alma fiyatı
TrendMaestro5
Stefano Frisetti
note: this indicator is for METATRADER4, if you want the version for METATRADER5 this is the link:  https://www.mql5.com/it/market/product/108106 TRENDMAESTRO ver 2.4 TRENDMAESTRO recognizes a new TREND in the bud, he never makes mistakes. The certainty of identifying a new TREND is priceless. DESCRIPTION TRENDMAESTRO identifies a new TREND in the bud, this indicator examines the volatility, volumes and momentum to identify the moment in which there is an explosion of one or more of these data a
Golden Spikes Detector Overview: The Golden Spikes Premium is a groundbreaking trading indicator meticulously crafted for the Boom and Crash indices on the Deriv market. Tailored to meet the needs of discerning traders, this powerful tool operates exclusively on the one-minute timeframe, providing timely and precise signals to maximize your trading potential. The Golden Spikes Detector stands out in its ability to deliver accurate signals, ensuring that you capitalize on market opportunities wit
Gartley Hunter Multi
Siarhei Vashchylka
5 (8)
Gartley Hunter Multi - An indicator for searching for harmonic patterns simultaneously on dozens of trading instruments and on all possible timeframes. Manual (Be sure to read before purchasing) | Version for MT4 Advantages 1. Patterns: Gartley, Butterfly, Shark, Crab. Bat, Alternate Bat, Deep Crab, Cypher 2. Simultaneous search for patterns on dozens of trading instruments and on all possible timeframes 3. Search for patterns of all possible sizes. From the smallest to the largest 4. A
Unlock key market insights with automated support and resistance lines Special Offer: Purchase now to receive free bonuses worth $89! (Read more for details) Tired of plotting support and resistance lines? This is a multi-timeframe indicator that detects and plots supports and resistance lines in the chart with the same precision as a human eye would. As price levels are tested over time and its importance increases, the lines become thicker and darker, making price leves easy to glance and ev
Matrix Arrow Indicator MT5
Juvenille Emperor Limited
5 (14)
Matrix Arrow Indicator MT5 ,   forex ,   emtialar ,   kripto   para birimleri ,   endeksler ,   hisse senetleri   gibi tüm sembollerde/araçlarda kullanılabilen   %100 yeniden boyamayan   çoklu zaman çerçevesi göstergesini izleyen benzersiz bir 10'u 1 arada trenddir.  Matrix Arrow Indicator MT5 , mevcut eğilimi erken aşamalarında belirleyecek ve aşağıdakiler gibi 10'a kadar standart göstergeden bilgi ve veri toplayacaktır: Ortalama Yönlü Hareket Endeksi (ADX) Emtia Kanal Endeksi (CCI) Klasik Hei
Volume by Price MT5
Brian Collard
3.6 (5)
The Volumebyprice.com Indicator for MetaTrader 5 features Volume Profile and Market Profile TPO (Time Price Opportunity). Volume and TPO histogram bar and line charts. Volume Footprint charts. TPO letter and block marker collapsed and split structure charts. Static, dynamic and flexible range segmentation and compositing methods with relative and absolute visualizations. Session hours filtering and segment concatenation with Market Watch and custom user specifications. Graphical layering, posit
ICT, SMC, SMART MONEY CONCEPTS, SMART MONEY, Smart Money Concept, Support and Resistance, Trend Analysis, Price Action, Market Structure, Order Blocks, BOS/CHoCH,   Breaker Blocks ,  Momentum Shift,   Supply&Demand Zone/Order Blocks , Strong Imbalance,   HH/LL/HL/LH,    Fair Value Gap, FVG,  Premium  &   Discount   Zones, Fibonacci Retracement, OTE, Buy Side Liquidity, Sell Side Liquidity, BSL/SSL Taken, Equal Highs & Lows, MTF Dashboard, Multiple Time Frame, BigBar, HTF OB, HTF Market Structure
Volatility Trend System , girişler için sinyaller sağlayan bir ticaret sistemidir. Volatilite sistemi, trend yönünde doğrusal ve nokta sinyallerinin yanı sıra, yeniden çizme veya gecikme olmadan trendden çıkış sinyallerini de verir. Trend göstergesi orta vadeli trendin yönünü izler, yönünü ve değişimini gösterir. Sinyal göstergesi oynaklıktaki değişikliklere dayanır ve piyasaya girişleri gösterir. Gösterge çeşitli uyarı türleri ile donatılmıştır. Çeşitli ticaret araçlarına ve zaman diliml
Blahtech Supply Demand MT5
Blahtech Limited
4.54 (13)
Was: $299  Now: $99   Supply Demand uses previous price action to identify potential imbalances between buyers and sellers. The key is to identify the better odds zones, not just the untouched ones. Blahtech Supply Demand indicator delivers functionality previously unavailable on any trading platform. This 4-in-1 indicator not only highlights the higher probability zones using a multi-criteria strength engine, but also combines it with multi-timeframe trend analysis, previously confirmed swings
Gold TMAF MTF - bu en iyi hisse senedi teknik göstergesidir. Gösterge algoritması, bir varlığın fiyat hareketini analiz eder ve oynaklığı ve potansiyel giriş bölgelerini yansıtır. En iyi gösterge sinyalleri: - SAT için = TMA2'nin kırmızı üst sınırı TMA1'in kırmızı üst sınırının üzerinde + yukarıdaki kırmızı fraktal gösterge + aynı yönde sarı SR sinyal oku. - AL için = TMA2'nin mavi alt sınırı TMA1'in mavi alt sınırının altında + aşağıdan mavi fraktal gösterge + aynı yönde aqua SR sinyal
Automated Trendlines MT5
Georgios Kalomoiropoulos
Trend çizgileri, forex ticaretinde en önemli teknik analiz aracıdır. Ne yazık ki, çoğu tüccar onları doğru şekilde çizmez. Otomatik Trend Çizgileri göstergesi, piyasaların trend hareketini görselleştirmenize yardımcı olan ciddi tüccarlar için profesyonel bir araçtır. İki tür Trend Çizgisi, Boğa Trend Çizgisi ve Ayı Trend Çizgisi vardır. Yükseliş trendinde, Forex trend çizgisi, fiyat hareketinin en düşük salınım noktalarından geçer. En az iki "en düşük düşük"ü birleştirmek, bir trend çiz
TPA True Price Action indicator reveals the true price action of the market makers through 100% non-repainting signals strictly at the close of a candle! TPA shows entries and re-entries, every time the bulls are definitely stronger than the bears and vice versa. Not to confuse with red/green candles. The shift of power gets confirmed at the earliest stage and is ONE exit strategy of several. There are available now two free parts of the TPA User Guide for our customers. The first "The Basics"
** All Symbols x All Timeframes scan just by pressing scanner button ** ***Contact me after purchase to send you instructions and add you in "123 scanner group" for sharing or seeing experiences with other users. After 17 years of experience in the markets and programming, Winner indicator is ready. I would like to share with you! Introduction The 123 Pattern Scanner indicator with a special enhanced algorithm is a very repetitive common pattern finder with a high success rate . Interestingly,
Auto Order Block with break of structure based on ICT and Smart Money Concepts (SMC) Futures Break of Structure ( BoS )             Order block ( OB )            Higher time frame Order block / Point of Interest ( POI )    shown on current chart           Fair value Gap ( FVG ) / Imbalance   -  MTF      ( Multi Time Frame )    HH/LL/HL/LH  -  MTF      ( Multi Time Frame )  Choch  MTF      ( Multi Time Frame )  Volume Imbalance     ,  MTF          vIMB Gap’s Power of 3 Equal High
Yazarın diğer ürünleri
Bu gösterge, tüccarın ihtiyacına göre grafiği daha temiz hale getirmek için etkinleştirilebilen / devre dışı bırakılabilen 6 seviyeye kadar çizer Bu 6 seviye 2 set halindedir: Yüksek ve Düşük Her set için farklı zaman aralığı seçilebilir Fiyatın Günlük, Haftalık veya Aylık En Düşük seviyeye ulaştığında genellikle 5dk gibi daha küçük bir zaman diliminde reddedildiği düşünüldüğünden, Önceki Yüksek Düşük tersine çevirme stratejisine dayanır. Özellikler : - Tek bir grafikte 6 Zaman Çerçev
EA için Kripto Para Birimi Canlı Tick Verileri Teklif ve Talep ve Rezervasyon Derinliği Mevcut Değişim: 1. Binance Spot (Aktif grafik penceresinde Emir Defteri Derinliğini destekler) ve Vadeli İşlemler (Birden fazla Emir Defteri Derinliğini destekler) 2. Kucoin Spot ve Vadeli İşlemler, Aktif grafik penceresinde Sipariş Defteri derinliğini destekler 3. Bybit Vadeli İşlemler ve Ters Vadeli İşlemler Verileri İşaretle Teklif Al Son Yaklaşan Borsa: OKX, MEXC ve daha fazlası.. Özelli
This indicator finds Double Top and Double bottom Example : What is Double Top When price establishes a new high and then falls, then reverse to the same candle area of High then its considered a valid double top and vice versa for double bottom. 1. It plots and high and low on visible chart if ChartChange is set to true else it searches on new bar opening 2. If there is double top and double bottom found in visible chart window then it plots a line 3. It has options to customize text color, te
FREE
Higher Time Frame Bars
Rajesh Kumar Nait
5 (1)
Bu gösterge, aynı grafikte izlemek istediğiniz diğer zaman dilimi mum çubuklarını verimli bir şekilde izler 1. Aynı grafikteki çubukları yüklemek için daha yüksek bir zaman dilimini seçin 2. Şamdanların renklerini ve stilini özelleştirin 3. Şamdanları çizmek için çubuk sayısını seçin 4. Daha yüksek zaman dilimindeki komple mumları fitil ve gövdeyle birlikte takip edin 5. Grafiği değiştirmek istemeyenler için kolay ve kullanışlı.
Perfect Seconds grafik göstergesi, dakika mumlarını saniyelere dönüştürmenize olanak tanır 1. Bir çubuğu doğru zamanla %100 kapatmak için istediğiniz sayıda saniyeyi seçin. 2. Bu oranlara dayalı bir veridir, işaretler mevcut olmasa bile çalışır. 3. Harici DLL gerekmez, VPS'de sorunsuz çalışır 4. Hızlı ve optimize edilmiş kod 5. BInance, Kucoin gibi Kripto Çiftlerini ve Vadeli İşlem grafiğinin kolayca saniyelere dönüştürülebildiği diğer tüm borsaları destekler. 6. Altın ve Forex
Bu kütüphane, herhangi bir EA'nızı kullanarak işlemleri yönetmenize izin verecektir ve açıklamalarda belirtilen komut dosyası koduyla ve ayrıca tüm süreci gösteren videodaki demo örnekleriyle kendi başınıza yapabileceğiniz herhangi bir EA'ya entegrasyonu çok kolaydır. - Limit Ver, SL Limit Ver ve Kar Al Limit Emirleri - Market, SL-Market, TP-Market siparişlerini verin - Limit emrini değiştirin - Siparişi iptal et - Siparişleri Sorgula - Kaldıraç, marjı değiştir - Pozisyon bi
MT5 için Binance Ticaret Aracı 1. Bu ürün websocket'ten canlı grafik, tarihsel grafik, Binance'te sorunsuz bir şekilde işlem yapmanızı sağlayan sıfır manuel müdahale ile sorunsuz çalışmasını sağlamak için mt5 terminali yeniden başlatıldığında otomatik güncellemeler. Spot ve Vadeli İşlemler için Ticaret, Canlı Grafik ve Geçmiş Veriler Mevcuttur Nasıl kullanılır : 1. API anahtarınızı ve sırrınızı bu yardımcı programın Giriş alanına eklemeniz gerekir. API'nizi oluşturduğunuzda Vadeli İ
Bu kütüphane, herhangi bir EA'nızı kullanarak işlemleri yönetmenize olanak tanır ve açıklamada belirtilen komut dosyası koduyla ve ayrıca tüm süreci gösteren videodaki demo örnekleriyle kendi başınıza yapabileceğiniz herhangi bir EA'ya entegrasyonu çok kolaydır. Bu ürün, API aracılığıyla alım satım işlemlerine izin verir ve grafikler içermez. Kullanıcılar, Crypto grafikleri sağlayan ve Binance'e emir gönderen brokerlerin grafiklerini kullanabilir - Tek Yönlü ve Hedge Modunu destekler - Lim
MT5 için Kripto Para Tabloları. Özellikler : 1. Websocket (wss) aracılığıyla canlı OHLC Grafiği 2. API'den Barların Geçmişini Güncelleyin 3. Çubuklarda eksik veri olmadığından ve yerel grafik gibi her zaman güncel tutulduğundan emin olmak için MT5 yeniden başlatıldığında grafiklerde Otomatik Güncelleme geçmişi 4. API'den Zamanlanmış Geçmiş Güncellemesi : Bir milisaniye süreyle internet bağlantısının kesilmesi durumunda, websocket akış protokolü olduğundan bar ohlc değeri hatalı ol
Gerçek Dönen Top Göstergesi Dönen topaçın gerçek anlamı olan dengeli gövde ve fitil yükseklik oranı ile grafik üzerinde doğru topacı algılar ve onu Hammers and Doji veya Null Candlestick'ten ayırır. Bu gösterge, grafikte bulunan topaç sayısına bir kanat simgesi çizer. Ayarlar şunları içerir: Çubuk Sayısı : Aramayı çubuk sayısına göre ayarlamak için Simgenin Rengi: simgenin rengini değiştir Simge kodu: simge için kanatların kodunu değiştirin
FREE
Piyasa yapıları, daha yüksek bir zaman diliminde kırıldığında, bir tüccar için bir eğilimi temizlemeye yardımcı olabilecek yapılardır. 1. Bu gösterge ZigZag'ı yalnızca son 2 yapıya çekecektir (önceki ZigZag'ın en yüksek ve en düşük seviyesi) ve yeni bir ZigZag çubuğu yalnızca yapı kırılması gerçekleştiğinde oluşacaktır 2. Yapının bozulması durumunda Terminal ve Push bildirimi verir. 3. Salınımı ayarlamak için [ ve ] tuşlarından ZigZag Derinliğini Artırın ve Azaltın 4. Line AB BC ve C
Bu gösterge fibonacci düzeyleri etiketlerini büyük yazı tipi boyutunda göstermenize olanak tanır . 25'ye kadar fibonacci seviyesini destekler - Fibonacci'yi çizdiğiniz anda giriş parametresi olarak eklediğiniz seviyeleri seçtiğiniz renk ve yazı tipiyle büyük yazı boyutunda gösterir. Özelleştirilebilir seçenekler: 1. Fibo Metin Yazı Tipi 2. Fibo Metin Boyutu 3. Fibo Metin Rengi 3. Her seviyeye açıklama ekleyin 4. Çapalar ve Dereceler gibi diğer seçenekler
Çoklu Sembol Fiyat uyarısı ayarlamak ve Terminal Uyarısı veya Push Bildiriminden bildirim almak için grafikte herhangi bir yere Çift Tıklayın 1. EA Yardımcı Programını tabloya ekleyin 2. <- sol veya -> sağ ok tuşlarıyla çizelgeye göz atın 3. Grafikte herhangi bir yere çift tıklayın ve bir satır ekleyecektir, istediğiniz fiyatı ayarlamak için bu satırı sürükleyin ve işte, uyarı ayarlandı! Fiyat hatta ulaştığında, yardımcı programın ayarlarına göre terminal veya push bildirimi ile sizi bi
Bu gösterge, tüccarın ihtiyacına göre grafiği daha temiz hale getirmek için etkinleştirilebilen / devre dışı bırakılabilen 6 seviyeye kadar çizer Bu 6 seviye 2 set halindedir: Yüksek ve Düşük Her set için farklı zaman aralığı seçilebilir Fiyatın Günlük, Haftalık veya Aylık En Düşük seviyeye ulaştığında genellikle 5dk gibi daha küçük bir zaman diliminde reddedildiği düşünüldüğünden, Önceki Yüksek Düşük tersine çevirme stratejisine dayanır. Özellikler : - Tek bir grafikte 6 Zaman Çerçev
Cobra Pivot Noktaları, DEMO'yu indirerek kendinizi test edebileceğiniz en iyi optimize edilmiş pivot noktalarını çizmeye yönelik bir göstergedir. 1. En İyi İki Pivot Modunu Seçin: Cobra Pivots veya Camrilla Pivots 2. D1 ile sınırlı olmamak üzere istediğiniz zaman dilimini kullanabilirsiniz. 3. Shift parametresi ile Önceki gün Yüksek Düşük Kapanış değeri ile oynayabilirsiniz. 1 = Önceki Çubuk, 2 = Önceki çubuktan önceki Çubuk vb.. Bu parametreler pivotlar üzerinde araştırma ve geliştirme
Çoklu Para Birimi Önceki Mum veya Önceki Çubuk Tarayıcı, gösterge ayarlarından seçtiğiniz herhangi bir özel zaman diliminde çoklu sembol grafiklerini taramanıza yardımcı olur. Ürün bazında: https://www.mql5.com/en/market/product/110229 Önceki Günün en yüksek en düşük, Önceki haftanın en yüksek en düşük, Önceki ayın En yüksek en düşük veya herhangi bir özel zaman dilimi için çoklu sembolleri taramak için kullanılabilir; Önceki 4 saatlik grafik yüksek düşük Gürültüyü filtreler ve fiyat Y
Pivot Noktaları Çoklu Sembol Tarayıcısı, Marketwatch'ta bulunan tüm sembolleri Floor, Woodie, Camarilla, Demark veya Fibonacci Pivot Noktaları için tarar. Pivot noktalarını hesaplamak için herhangi bir zaman dilimini seçebilir ve fiyat bu destek ve direnç seviyelerine dokunduğunda uyarı alabilirsiniz. Görsel Pivot Noktaları için Bu ürün ilginizi çekebilir: https://www.mql5.com/en/market/product/110231 Çeşitli uyarı türlerini seçme seçenekleri vardır Tarama sıklığını milisaniye cinsi
Bu göstergeyi grafiğe ekleyin ve ZigZag'ın ExtDepth Ayarını ayarlayın Fiyat trend çizgisi Üst, Alt veya Orta kanala dokunduğunda anında uyarı verir Özellikler : -Üst, alt veya orta satırda uyarıları etkinleştirin / devre dışı bırakın - Saniyeler içinde bir uyarıdan sonra duraklama ekleyin - Grafikteki düğme ile Trend kanalını Duraklat veya Duraklattan Kaldır - Giriş alanına puan ekleyerek erken uyarılar ekleyin, örneğin ETH fiyatı 2900.25 burada 25 rakamı "nokta", yani giriş alanına puan
Crypto.com'dan MT5'e Crypto.com websocket'ten Metatrader 5'e Canlı Şamdan Akışı OHCLV (Açık Yüksek Düşük Yakın Gerçek Hacim) Canlı Oran Verisi  tüccarlar, eğer bir dakikalık grafikte OHLC verileri doğru değilse, teknik tablo çalışmasında yanlış analiz verebilir, Bu ürün, manuel analizde yardımcı olabilecek gerçek zamanlı olarak doğru veriler verdiğini garanti eder diğer kripto ürünüme profilimden bakabilirsin https://www.mql5.com/en/users/rajeshnait/seller 1. OHLCV Verileri 2. Çoklu
Simetrik üçgen, asimetrik üçgen veya dik açılı üçgen gibi Üçgen modeli için Model Gezgini, Yükselen kama veya Düşen kama gibi Kama modeli, Genişleme modeli ve Trend Kanalı Bu gösterge, mevcut kalıpların yanı sıra geçmiş kalıpları da araştırır, Trend çizgisini veya üçgeni manuel olarak çizerek zamandan tasarruf etmeye çalışanlar ve bunu grafikte en iyi kalıpları çizmenin otomatik analizi için kullanmak isteyenler için en iyi göstergedir. Özellikler : - En iyi deseni ayarlamak ve bulmak içi
Kraken Crypto Exchange Vadeli İşlemler Geçmişi Güncelleme Paneli Özellikler : 1. Sembol için Kraken API'sinden temin edilebilen ayar ve güncelleme geçmişine dayalı olarak sembol oluşturacaktır. Bu panel Kraken Vadeli İşlem sembollerindeki geçmişi Açık Yüksek Düşük Kapat verileriyle günceller, Ayrıca Geçmiş Güncellemesi tamamlandığında mesajı yazdırır. Lütfen bunun CANLI Veri olmadığını unutmayın.   3. Araçlar > Seçenekler > URL'den Webrequest'e İzin Ver sekmesinde belirtildiği gibi Krak
5 EMA Scalping Strategy Multi Symbol Scanner This EA utility will scan all symbols which are selected in marketwatch and alert when such condition is formed in chart when Candle low is above EMA 5 for Sell alert and Candle high is lower from EMA5 so you can be ready before selling or buying for scalping purpose on 5min chart For more details watch attached video Logic : When a candle closes above 5 EMA in 5 mins chart, Wait for its low to break and Sell when low is broken by wick, Your SL sh
Çoklu Sembol ZigZag Breakout Tarayıcı, marketwatch'da seçilen tüm sembolleri tarar. Fiyat bu seviyelere ulaşmak üzereyken çift tepe, çift dip veya herhangi bir fibonacci uzantı seviyesini kolayca bulmanıza yardımcı olacaktır. Zaman Çerçevesini ve Zigzag'ın birden fazla Genişletme Derinliğini (3'e kadar) seçebilirsiniz. Önerilen ZigZag, her türlü Zigzag ve filtre gürültüsünü kapsayan 21,34 ve 55'tir. Terminal uyarısı veya push bildirimi veya her ikisini birden alacak şekilde ayarlayabili
Fibo Musang FMBCR CB1 koparma tarayıcı MT5 Fibo Musang CB1 veya Candle Break 1, Gold XAUUSD ve diğer forex sembollerinde çok iyi çalışan bir stratejidir. Bu tarayıcı, çoklu sembol para birimlerini çok hızlı bir şekilde taramanıza ve FMCBR CB1 çıkışı hakkında uyarılar almanıza yardımcı olacaktır. Lütfen tüccarın tercihine göre tamamen özelleştirilebilen daha fazla ayrıntı için videoyu izleyin: 1. Zaman dilimini ve Bar Geçmişini seçebilirsiniz. 2. Tercih ettiğiniz ZigZag ayarını deği
Çoklu Sembol Fiyat uyarısı ayarlamak ve Terminal Uyarısı veya Push Bildiriminden bildirim almak için grafikte herhangi bir yere Çift Tıklayın 1. EA Yardımcı Programını tabloya ekleyin 2. <- sol veya -> sağ ok tuşlarıyla çizelgeye göz atın 3. Grafikte herhangi bir yere çift tıklayın ve bir satır ekleyecektir, istediğiniz fiyatı ayarlamak için bu satırı sürükleyin ve işte, uyarı ayarlandı! Fiyat hatta ulaştığında, yardımcı programın ayarlarına göre terminal veya push bildirimi ile sizi bi
Control Candle is the candlestick which holds multiple inside bars and are in control until its high low range is broken by close of any candlestick. When control candle is broken, price may act on these control candle as support and resistance. This indicator create rectangles on chart which will help you find control candles fast. Control candle indicator box is customizable by color, style, width and other options in indicator settings.
Cobra Pivot Noktaları, DEMO'yu indirerek kendinizi test edebileceğiniz en iyi optimize edilmiş pivot noktalarını çizmeye yönelik bir göstergedir. 1. En İyi İki Pivot Modunu Seçin: Cobra Pivots veya Camrilla Pivots 2. D1 ile sınırlı olmamak üzere istediğiniz zaman dilimini kullanabilirsiniz. 3. Shift parametresi ile Önceki gün Yüksek Düşük Kapanış değeri ile oynayabilirsiniz. 1 = Önceki Çubuk, 2 = Önceki çubuktan önceki Çubuk vb.. Bu parametreler pivotlar üzerinde araştırma ve geliştirme
Çoklu Para Birimi Önceki Mum veya Önceki Çubuk Tarayıcı, gösterge ayarlarından seçtiğiniz herhangi bir özel zaman diliminde çoklu sembol grafiklerini taramanıza yardımcı olur. Ürün bazında: https://www.mql5.com/en/market/product/78657 Önceki Günün en yüksek en düşük, Önceki haftanın en yüksek en düşük, Önceki ayın En yüksek en düşük veya herhangi bir özel zaman dilimi için çoklu sembolleri taramak için kullanılabilir; Önceki 4 saatlik grafik yüksek düşük Gürültüyü filtreler ve fiyat Yü
Pivot Noktaları Çoklu Sembol Tarayıcısı, Marketwatch'ta bulunan tüm sembolleri Floor, Woodie, Camarilla, Demark veya Fibonacci Pivot Noktaları için tarar. Pivot noktalarını hesaplamak için herhangi bir zaman dilimini seçebilir ve fiyat bu destek ve direnç seviyelerine dokunduğunda uyarı alabilirsiniz. Görsel Pivot Noktaları için Bu ürün ilginizi çekebilir: https://www.mql5.com/en/market/product/110072 Çeşitli uyarı türlerini seçme seçenekleri vardır Tarama sıklığını milisaniye cinsi
Easy Fibonacci
Rajesh Kumar Nait
Easy Fibonacci, Fibonacci düzeltmelerini kolayca çizmenizi sağlayan MT5 için bir göstergedir. Özellikler Gösterge ayarlarından 10'a kadar fibo seviyesi ayarlanabilir. Her seviye, farklı çizgi stili, çizgi rengi, çizgi genişliği ve diğer özelleştirilebilir ayarlara sahip olabilir. Ekstra düğmeli bir fare kullanarak V ve B tuşlarını eşleyebilir ve Fibonacci'yi kolayca çizebilirsiniz. Düğme İşlevleri: B ve V: Grafiğin görünen alanında üst/alt Fibonacci'yi çiz. N ve M: Sonraki ve önceki Mumların uza
Filtrele:
İnceleme yok
İncelemeye yanıt