KT Knoxville Divergence MT4
- Göstergeler
- KEENBASE SOFTWARE SOLUTIONS
- Sürüm: 1.0
- Etkinleştirmeler: 5
The KT Knoxville Divergence is a powerful tool that reveals unique price divergences in a financial instrument by employing a carefully crafted combination of the Relative Strength Index (RSI) and a momentum oscillator. This indicator effectively captures subtle variations in market dynamics and assists traders in identifying potentially profitable trading opportunities with greater precision.
Knoxville Divergences is a type of divergence in trading developed by Rob Booker. Divergence in trading occurs when the price of an asset is moving in the opposite direction of a technical indicator (oscillator). This discrepancy can be a trading signal that the current price trend is weakening and possibly about to reverse.
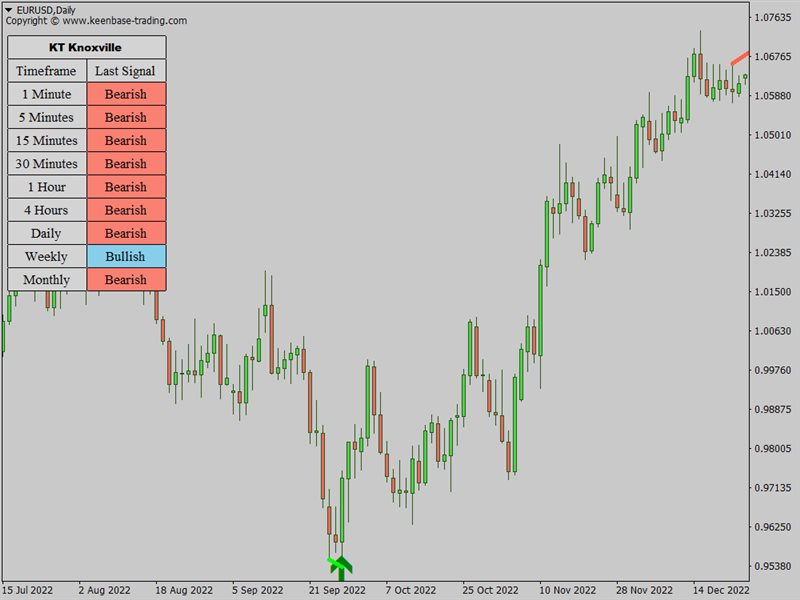
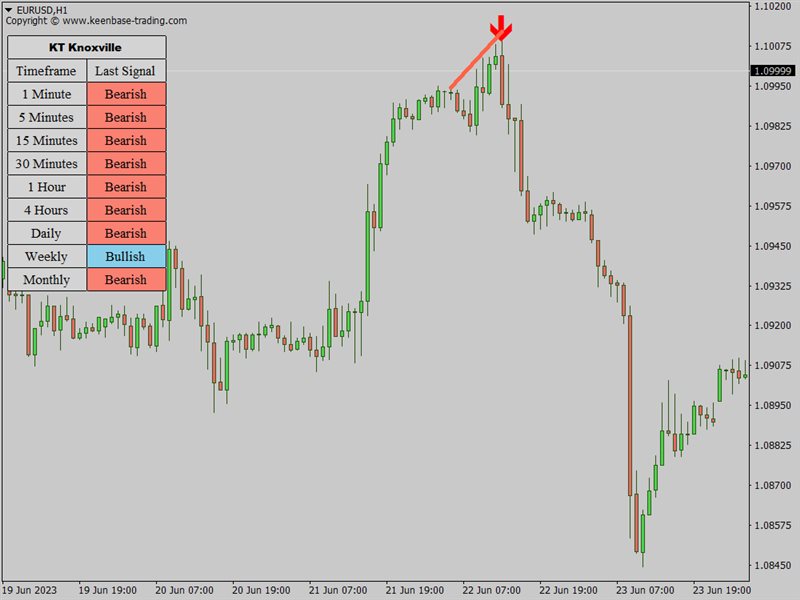
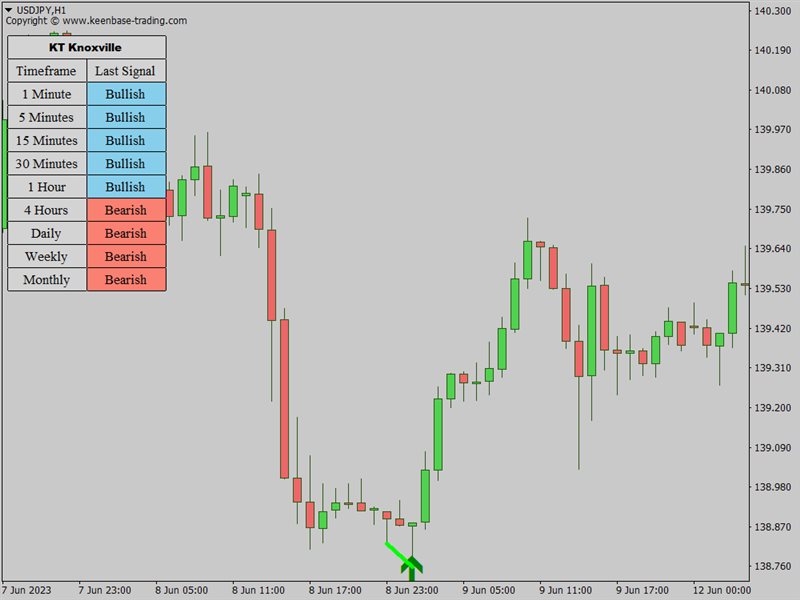
This can be useful to traders looking for optimal entry and exit points. The indicator provides visual signals on the price chart whenever these divergences occur.
Understanding the Knoxville Divergence
This Knoxville divergence can be used to bet against the trend or who are waiting for a slight pullback before going with the longer-term trend's flow. Therefore, it is considered a counter-trend indicator. This indicator is formed due to two critical components that work in tandem.
Firstly, we have the Momentum indicator. When the price movement of an asset is ascending, and the momentum indicator takes a downward path, it raises the first flag of a possible Knoxville Divergence on the horizon. However, the Momentum indicator alone doesn't signal a definitive Knoxville Divergence. The second crucial component that completes the equation is the Relative Strength Index (RSI).
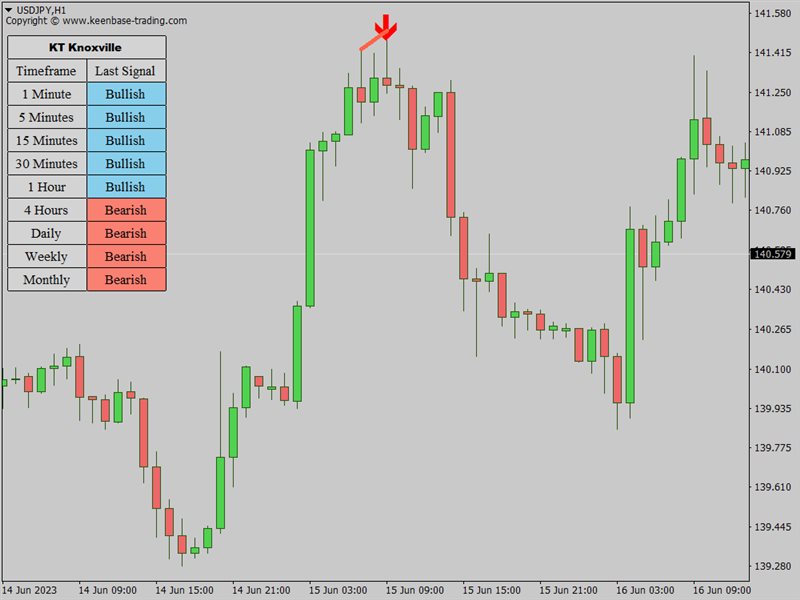
Suppose the RSI also enters an overbought or oversold territory during the phase when the momentum indicator disagrees with the price. In that case, it brings all necessary elements together for a Knoxville Divergence, triggering the appearance of a KD line on the chart.
How to use Knoxville Divergence
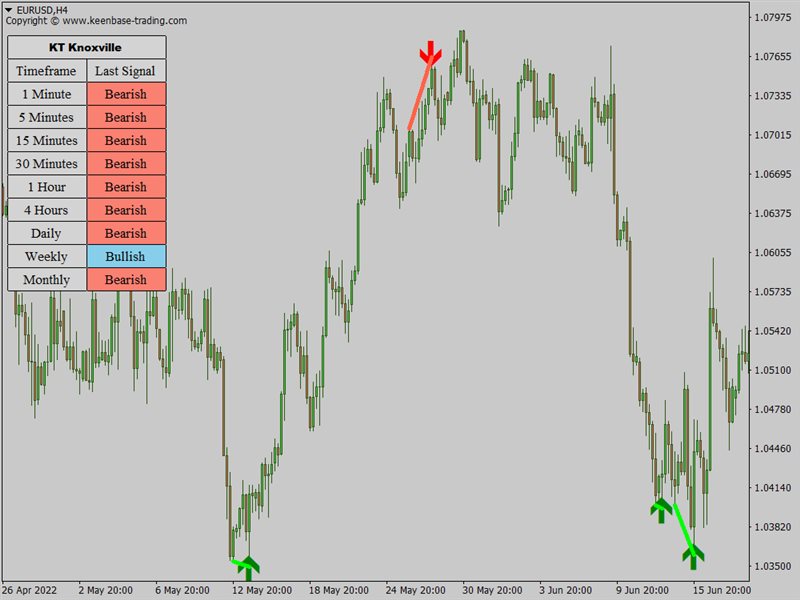
Let's take the example of a Forex currency pair, say the EUR/USD. Suppose EUR/USD has been in an uptrend on the 4-hour chart, and the price has consistently risen over the past several days. Suddenly, you observe a Knoxville Divergence line appearing above the price on the chart. This is the first sign of potential Knoxville Divergence.
However, you also need to confirm some candlestick patterns and check two other indicators to confirm. You check the Momentum indicator and notice that while the price has risen, the momentum has started falling. This divergence is your first confirmation.
Simultaneously, you observe the Relative Strength Index (RSI) and find that it has entered an overbought zone, often interpreted as a potential impending price reversal. With both these signs (falling momentum during a rising price and overbought RSI), the Knoxville Divergence is confirmed, suggesting that the upward trend might soon reverse.
Based on this, you could enter a sell trade on EUR/USD, expecting the price to fall. Counter-trend traders prefer these trading signals as we are betting against the trend here. You would typically set a stop-loss at a point above the recent high (to protect against the possibility that the trend continues upward) and a take-profit at a lower level where you expect the price to drop in the near future.
It's worth noting that this indicator works successfully for assets other than Forex currencies, including stocks, mutual funds, bonds, futures, and even cryptos.












I’ve been looking for a good Knoxville Divergence indicator and I’ve found it at last.