• Genel bakış
  • İncelemeler
  • Yorumlar

ON Trade Melad Pattern

Introducing the ON Trade Melad Pattern Indicator: Enhance Your Trading Strategy with Breakout Patterns

Discover the power of the ON Trade Melad Pattern Indicator—an intuitive tool designed to elevate your trading decisions by detecting and highlighting breakout patterns on your charts. This indicator is your key to identifying crucial breakout points and potential trend shifts with simplicity and precision.

Key Features:

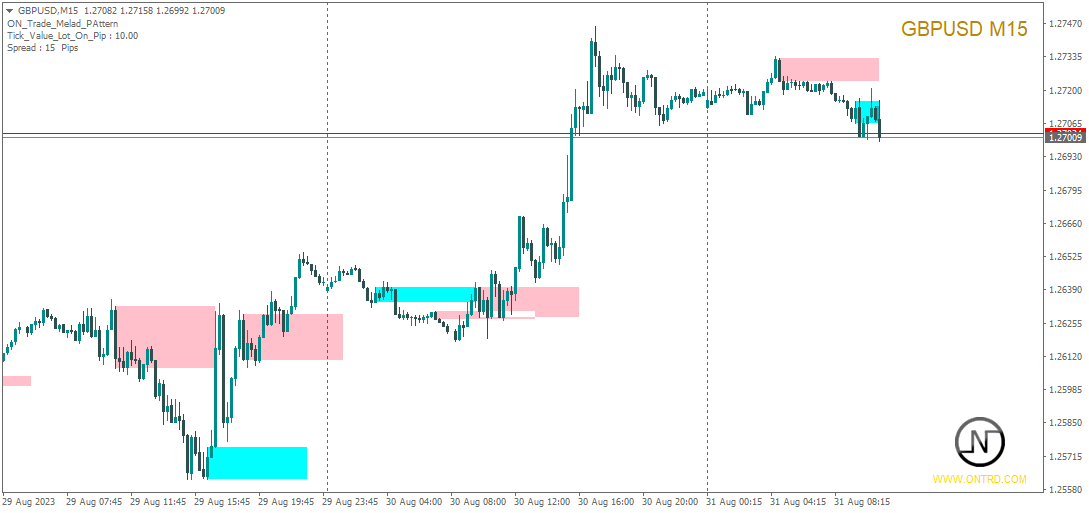
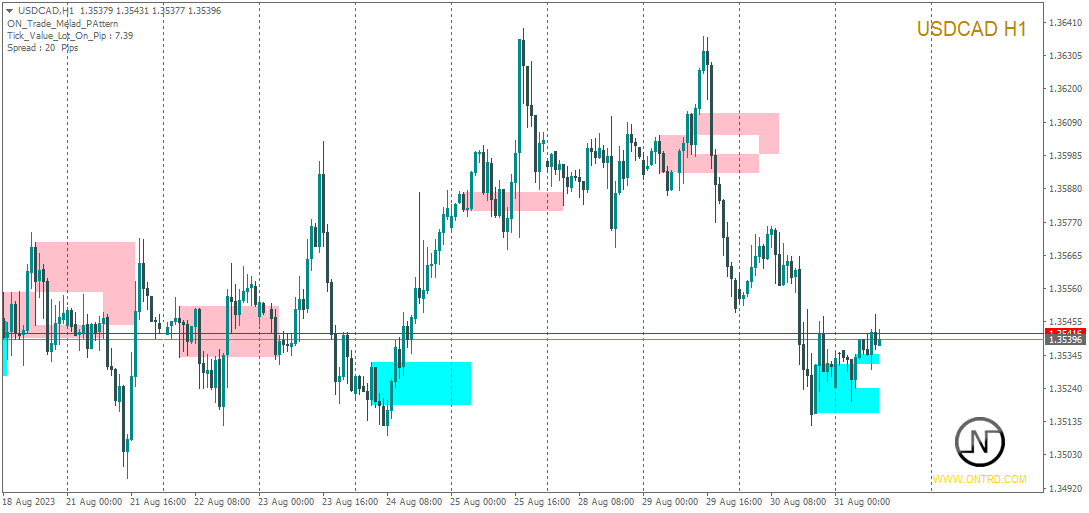
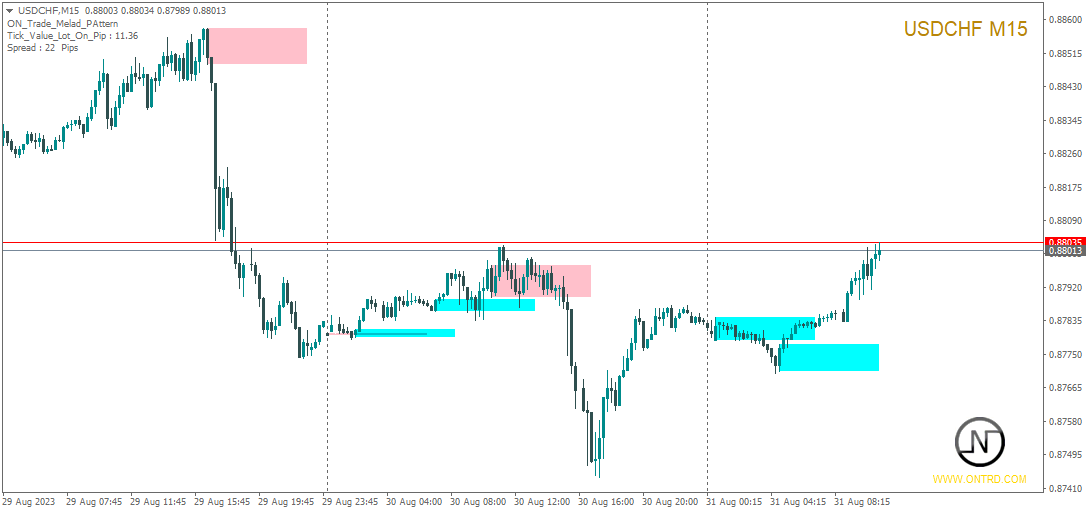
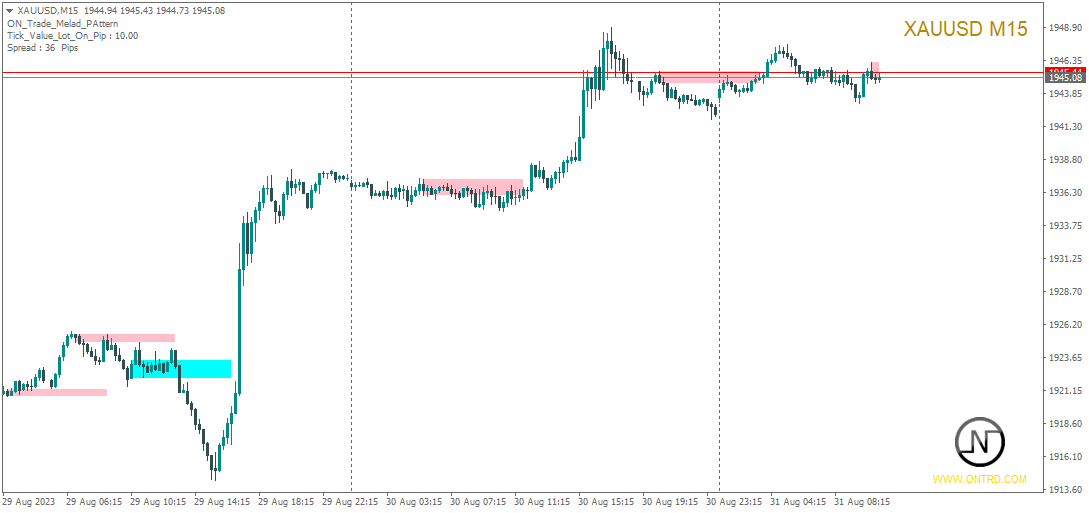
Breakout Pattern Detection: The ON Trade Melad Pattern Indicator focuses on recognizing breakout patterns with ease. It effortlessly spots specific candle formations that break out, helping you quickly identify significant price movement.

Price Movement Projection: Witness the price movement projection feature. After a breakout, the indicator mirrors the breakout's height, allowing you to visualize potential price trajectories that could follow the breakout.

Strategy Refinement: Seamlessly integrate the ON Trade Melad Pattern Indicator into your trading strategy. Use it as a filter to confirm your trading entries, enhancing the accuracy and confidence of your trades.

Easy Customization: Tailor the indicator to match your preferences. Choose the specific candle patterns you want to detect as breakouts and adjust settings to align with your trading style.

How to Use the ON Trade Melad Pattern Indicator:

Installation and Setup: Begin by installing the ON Trade Melad Pattern Indicator on your trading platform. Customize settings according to the candle patterns you wish to detect and your trading preferences.

Breakout Identification: As the market evolves, the indicator scans for candle formations that break out from their usual range. Once a breakout is detected, the indicator draws attention to it, making it easy to spot.

Price Projection: Embrace the power of price projection. Watch as the indicator mirrors the breakout's height, giving you a glimpse of potential price paths after the breakout.

Enhanced Strategy: Implement the breakout patterns as a reliable filter for your trading strategy. Validate your trading decisions by assessing them in light of breakout patterns, leading to better-informed entries.

Risk Management: Maintain effective risk management techniques by setting appropriate stop-loss and take-profit levels for each trade, consistent with your trading strategy.

Conclusion:

The ON Trade Melad Pattern Indicator is your gateway to enhanced trading decisions. By identifying breakout patterns and projecting potential price movement, it equips you with insights that can enhance your trading outcomes. Seamlessly incorporate it into your strategy and experience a new level of trading precision.

[Disclaimer: Trading involves risks, and the indicator should be used as part of a comprehensive trading strategy. Always exercise caution and conduct thorough analysis before making trading decisions.]

Feel free to adapt this explanation to match the specific ON Trade Melad Pattern Indicator and your target audience's needs.

Önerilen ürünler
Signal Aggregator
Algoritmic Capital, Ltd.
4.87 (15)
Optimized set files for 23 currency pairs - H1 SET FILES  , for 17 currency pairs - M15 SET FILES  , for 18 currency pairs - H4 SET FILES . You can read detail manual for learn how trade - MANUAL   . For clients we have ready GIFT -  UTILITY SIGNAL AGGREGATOR . Contact us to private message with purchase number. But only clients with Lifetime version of SIGNAL AGGREGATOR. Utility will manage to you open positions base on Indicator rules. SIGNAL AGGREGATOR - is not just an indicator which most p
Pin Bars
Yury Emeliyanov
5 (4)
Temel amaç: "Pin Çubukları", finansal piyasa grafiklerindeki pin çubuklarını otomatik olarak algılamak için tasarlanmıştır. Bir pim çubuğu, karakteristik bir gövdeye ve uzun bir kuyruğa sahip, bir trendin tersine çevrilmesini veya düzeltilmesini işaret edebilen bir mumdur. Nasıl çalışır: Gösterge, grafikteki her mumu analiz ederek mumun gövdesinin, kuyruğunun ve burnunun boyutunu belirler. Önceden tanımlanmış parametrelere karşılık gelen bir pim çubuğu algılandığında, gösterge, pim çubuğunun
FREE
An Ultimate Tool  for quick and efficient market analysis. Unique combination of solid indicators defining market direction for trend tracking and filtration designed for you to stay on the  right  side of the market. Market Rider Tools   gives you access to one of the most used from professional trades indicators on worldwide, which were not build in for MT4 and MT5 terminals . These are unique non-repainting indicators designed to be used on all time frames for all instruments classes: Fore
Introduction to Chart Pattern MT Chart Pattern MT is a chart pattern scanner to detect the triangle pattern, falling wedge pattern, rising wedge pattern, channel pattern and so on. Chart Pattern MT uses highly sophisticated chart pattern detection algorithm. However, we have designed it in the easy to use with intuitive user interface. Chart Pattern MT will show all the patterns in your chart in the most efficient format for your trading. You do not have to do tedious manual pattern detection an
This indicator is, without a doubt, the best variation of the Gann Angles among others. It allows traders using Gann methods to automatically calculate the Gann angles for the traded instrument. The scale is automatically calculated when the indicator is attached to the chart. When switching timeframes, the indicator recalculates the scale for the current timeframe. Additionally, you can enter your own scales for the Gann angles. You can enter your own scales either for both vectors or for each
FFx Bulls Power
Eric Venturi-Bloxs
4 (4)
The purpose of this new version of the MT4 standard indicator provided in your platform is to display in a sub-window multiple timeframes of the same indicator. See the example shown in the picture below. But the display isn’t like a simple MTF indicator. This is the real display of the indicator on its timeframe. Here's the options available in the FFx indicator: Select the timeframes to be displayed (M1 to Monthly) Define the width (number of bars) for each timeframe box Alert pop up/sound/ema
FREE
Bu gösterge, W.D. Gann'ın dokuzun karesi ve 144'ün karesine bağlı olarak yazdığı "Piyasa tahminleri için matematiksel formül" makalesine dayanan bir piyasa analiz yöntemidir. Kullanım kılavuzu: Add Your review And contact us to get it Tam MT5 Sürümünü Şunlardan Satın Alabilirsiniz: https://www.mql5.com/en/market/product/28669 MT4'te ücretsiz olarak test edebilirsiniz: https://www.mql5.com/en/market/product/15316 Bu ürün sizin için Düzeyler / Yıldız / Izgara / Gann hayranları
FREE
Elliott Wave Trend was designed for the scientific wave counting. This tool focuses to get rid of the vagueness of the classic Elliott Wave Counting using the guideline from the template and pattern approach. In doing so, firstly Elliott Wave Trend offers the template for your wave counting. Secondly, it offers Wave Structural Score to assist to identify accurate wave formation. It offers both impulse wave Structural Score and corrective wave Structure Score. Structural Score is the rating to sh
FFx RVI
Eric Venturi-Bloxs
4.67 (3)
The purpose of this new version of the MT4 standard indicator provided in your platform is to display in a sub-window multiple timeframes of the same indicator. See the example shown in the picture below. But the display isn’t like a simple MTF indicator. This is the real display of the indicator on its timeframe. Here's the options available in the FFx indicator: Select the timeframes to be displayed (M1 to Monthly) Define the width (number of bars) for each timeframe box Alert pop up/sound/ema
FREE
Point Of Interest
Scott Edward Merritt
What is a Point of Interest? Traders who follow Smart Money Concepts may call this a Liquidity Point, or where areas of liquidity have been built up by retail traders for for Big Banks to target to create large price movements in the market. As we all know, retail traders that use outdated and unreliable methods of trading like using trendlines, support and resistance, RSI, MACD, and many others to place trades and put their stop losses at keys points in the market. The "Big Banks" know these me
MA bounce LITE arrows is simplified version of main indicator MA bounce . It's for people who don't need to use all features of main indicator. Lite version shows only arrows on chart when there is high probability of price bounce from selected MA. MA bounce LITE arrows input settings: Current MA period  - period of moving average on current TF Current     MA type   - moving average calculation method  on current TF Current     MA applied price   - applied price of moving average  on current T
Semnale precise Bun venit! Indicatorul de semnale precise declanșează semnale perfecte pe intervalele de timp M15 și M30. Pe H1 la fel, dar semnalele sunt mai rare. De asemenea, funcționează foarte bine pe M5 și chiar pe M1. Noroc! Note Dacă indicatorul nu este afișat, citiți comentariul meu în secțiunea de comentarii pentru a afla cum să faceți acest lucru. IMPORTANT! Verificați mai întâi indicatorul sau expertul pe un cont DEMO, înainte de a-l cumpăra! Analizați-l bine! Închir
Trend Yakalayıcı: Alarm İndikatörü ile Trend Yakalayıcı Stratejisi, piyasa trendlerini ve potansiyel giriş ve çıkış noktalarını belirlemede yardımcı olan çok yönlü bir teknik analiz aracıdır. Piyasa koşullarına uyum sağlayarak trend yönünün net görsel temsili için dinamik bir Trend Yakalayıcı Stratejisi sunar. Tüccarlar tercihlerine ve risk toleranslarına göre parametreleri özelleştirebilirler. Gösterge, trendleri tanımlamaya yardımcı olur, potansiyel ters dönüşleri sinyaller, trailing stop m
FREE
Gold15
Glory Orluike Echonwere
The indicator is a 15-minute signal indicator for all types of traders. Meaning, you could make lots of profits trading two different signals in one indicator. NOTE: Both indicators are channels for achieving the same result. RED ARROW -- Sell Signal BLUE ARROW -- Buy Signal Purchase now to be part of our community. We offer standard chart setups for both novice and intermediate traders. Trade with ease!
FREE
Shape Pack
John Louis Fernando Diamante
This indicator provides common shapes as drawing object options. The shapes are rotatable, resizable, draggable, and will keep their proportions (according to their handle trendline) across different chart scales. Multiple drawings are supported. Shapes: Square Rhombus Triangle (quadrilateral & isosceles) Circle (grid, overlapped grid, flexi grid, rotatable grid, concentric circles) Features: rays (all object edges will be rays) show/hide each individual drawing type, or all delete last drawn
FREE
Scalping indicator. It takes into account volatility, price movement in the local interval and the direction of the current trend. Recommended timeframe - M5. Advantages: Low volatility when a signal appears ensures minimal movement against an open position. The indicator does not redraw its signals. There are alert signals. It is a great tool for day trading. Settings: Name Description Period Indicator period Range of each bar in the period (pp.) The maximum size of each candle in the indicat
FREE
The indicator detects and displays Shark harmonic pattern (see the screenshot). The pattern is plotted by the extreme values of the ZigZag indicator (included in the resources, no need to install). After detecting the pattern, the indicator notifies of that by a pop-up window, a mobile notification and an email. The indicator highlights the process of the pattern formation and not just the complete pattern. In the former case, it is displayed in the contour triangles. After the pattern is comple
R 3MA Cross
Rwy Ksyby
3.5 (2)
R 3MA Çapraz göstergesi, 3 hareketli ortalamanın kesişmesine dayalı uyarıları olan popüler bir trend göstergesidir; daha hızlı, orta ve daha yavaş hareketli bir ortalamadan oluşur. Anahtar noktaları Daha hızlı hareket eden ortalama hem orta hem de daha yavaş hareket eden ortalamayı yukarı doğru geçtiğinde bir satın alma uyarısı oluşur. Daha hızlı hareket eden ortalama hem orta hem de daha yavaş hareket eden ortalamayı aşağıya doğru geçtiğinde bir satış uyarısı oluşur. Onunla ticaret nasıl
FREE
Extremum Reverse Bar
Yurij Izyumov
3.55 (11)
This indicator has been created for finding the probable reversal points of the symbol price. A small candlestick reversal pattern is used it its operation in conjunction with a filter of extremums. The indicator is not redrawn! If the extremum filter is disabled, the indicator shows all points that have a pattern. If the extremum filter is enabled, the condition works – if the history Previous bars 1 candles back contains higher candles and they are farther than the Previous bars 2 candle, such
FREE
Unlock hidden profits: accurate divergence trading for all markets Special Offer: Purchase now to receive free bonuses worth $159! (Read more for details) Tricky to find and scarce in frequency, divergences are one of the most reliable trading scenarios. This indicator finds and scans for regular and hidden divergences automatically using your favourite oscillator. [ Installation Guide | Update Guide | Troubleshooting | FAQ | All Products ] Easy to trade Finds regular and hidden divergence
Bu gösterge, optimum kar al ve zararı durdur seviyelerini gösterir. Bu seviyeler geçmiş verilere dayalı olarak hesaplanır. İlk başlangıçta, gösterge tarih konusunda eğitilir. Bundan sonra, fiyatın gelecekte şu veya bu seviyenin üstesinden gelme olasılığını değerlendirir ve stop emri vermek için en uygun seçenekleri seçer. Örneğin, kârı al değerleri, kârın maksimum olması ve fiyatın seviyesine ulaşma olasılığının mümkün olan en yüksek olması için seçilir. Durdurma kaybı seviyesi minimum olmalıdı
Ppr PA
Yury Emeliyanov
4.75 (4)
"Ppr PA" is a unique technical indicator created to identify "PPR" patterns on the currency charts of the MT4 trading platform. These patterns can indicate possible reversals or continuation of the trend, providing traders with valuable signals to enter the market. Features: Automatic PPR Detection:   The indicator automatically identifies and marks PPR patterns with arrows on the chart. Visual Signals:   Green and red arrows indicate the optimal points for buying and selling, respectively. A
FREE
Pips forex - is a ready trading system . This indicator shows with arrows on the chart when and in what direction you need to open an order. If the arrow is green, then we open a buy deal, and if the arrow is red, then we open a sell deal. Everything is very simple and quite effective. TakeProfit set 15-25 points. StopLoss set at the level of points. When the dots move, we immediately override the StopLoss. Recommended timeframe for trading M1 and M5. This is a scalping strategy and works best
Hareketli Ortalama Döviz Gücü Gösterge Tablosu,   birden çok simge ve zaman diliminde para birimi momentumu hakkında derinlemesine bilgi sağlayan güçlü ve kapsamlı bir göstergedir. Bu sağlam araç, en son geçiş noktalarını belirlemek için hareketli ortalamalardan yararlanır ve mevcut fiyata kadar para birimlerinin gücünü etkili bir şekilde izler. Sezgisel tasarımı ve kullanıcı dostu arayüzü ile bu pano, bilinçli kararlar vermek isteyen yatırımcılar için zengin bilgiler sunar. Bu kontrol paneli
Quantum Currency Heatmap Indicator
QUANTUM TRADING SOFTWARE LIMITED
Trading the currency markets is a complex business, not least since we are dealing with pairs of currencies, and by inference, pairs of economies. All economies around the world are interlinked, and reflected in the constant ebb and flow of currency strength and weakness. The problem for us as traders is monitoring so many pairs simultaneously, since every pair does not move independently, but reflects the interrelated nature of this market. The Quantum Currency Heatmap delivers the informatio
This product is based on the methodologies of Gann, his follower Don E. Hall. The Indicator builds a working view grid, which is used to analyze graphics. The Pyrapoint tool, developed by Don Hall, is a grid based on the Pythagorean cube. In his calculations he uses the Gann Square 9 methodology and the relationship between Price and Time. This tool is used to predict changes in trend and overall market actions. More information about the method   HERE
Chart Patterns Detect 15 patterns (Ascending Triangle, Descending Triangle, Rising Wedge, Falling Wedge, Bullish Flag, Bearish Flag, Bullish Rectangle, Bearish Rectangle Symmetrical triangle, Head and Shoulders, Inverted Head and Shoulders, Triple top, Triple Bottom, Double Top, Double Bottom) Use historical data to calculate the probability of each pattern to succeed (possibility to filter notification according to the chance of success) gives graphic indication about the invalidation level and
History Data Downloader
Hispraise Chinedum Abraham
Piyasa izlemede bulunan tüm döviz çiftleri için eksik verileri indirir. EA'ları ve stratejileri geriye dönük test etmek ve tüm geçmişi tek tek indirmek yerine bir kerede indirmek için çok kullanışlıdır. Gösterge, seçilen döviz çiftleri için tüm geçmiş veriler indirilene kadar çalışacaktır. Göstergenin birden fazla seçeneği vardır: 1. Tek çift için verileri indirin 2. Yalnızca mevcut çift için indirin 3. Seçilen çiftler için indirme 4. Market saatindeki tüm çiftler için indirin
FREE
Quantum Currency Matrix Indicator
QUANTUM TRADING SOFTWARE LIMITED
Of all the four principle capital markets, the world of foreign exchange trading is the most complex and most difficult to master, unless of course you have the right tools! The reason for this complexity is not hard to understand. First currencies are traded in pairs. Each position is a judgment of the forces driving two independent markets. If the GBP/USD for example is bullish, is this being driven by strength in the pound, or weakness in the US dollar. Imagine if we had to do the same thing
FFx Bears Power
Eric Venturi-Bloxs
4.75 (4)
The purpose of this new version of the MT4 standard indicator provided in your platform is to display in a sub-window multiple timeframes of the same indicator. See the example shown in the picture below. But the display isn’t like a simple MTF indicator. This is the real display of the indicator on its timeframe. Here's the options available in the FFx indicator: Select the timeframes to be displayed (M1 to Monthly) Define the width (number of bars) for each timeframe box Alert pop up/sound/ema
FREE
Bu ürünün alıcıları ayrıca şunları da satın alıyor
Gann Made Easy
Oleg Rodin
4.88 (96)
Gann Made Easy , bay teorisini kullanarak ticaretin en iyi ilkelerine dayanan, profesyonel ve kullanımı kolay bir Forex ticaret sistemidir. WD Gann. Gösterge, Zararı Durdur ve Kâr Al Seviyeleri dahil olmak üzere doğru SATIN AL ve SAT sinyalleri sağlar. PUSH bildirimlerini kullanarak hareket halindeyken bile işlem yapabilirsiniz. Lütfen satın aldıktan sonra benimle iletişime geçin! Alım satım ipuçlarımı ve harika bonus göstergelerini ücretsiz olarak sizinle paylaşacağım! Muhtemelen Gann ticaret y
Trend Pulse
Mohamed Hassan
5 (4)
Please contact me after purchase to immediately get your PDF strategy + documentation for Trend Pulse !  Official release price of $99  ( 3 /50 copies left). Next price is $199 . Introducing Trend Pulse , a unique and robust indicator capable of detecting bullish, bearish, and even ranging trends! Trend Pulse uses a special algorithm to filter out market noise with real precision. If the current symbol is moving sideways, Trend Pulse will send you a ranging signal, letting you know that it
Scalper Inside PRO
Alexey Minkov
4.75 (60)
An exclusive indicator that utilizes an innovative algorithm to swiftly and accurately determine the market trend. The indicator automatically calculates opening, closing, and profit levels, providing detailed trading statistics. With these features, you can choose the most appropriate trading instrument for the current market conditions. Additionally, you can easily integrate your own arrow indicators into Scalper Inside Pro to quickly evaluate their statistics and profitability. Scalper Inside
Atomic Analyst
Issam Kassas
5 (3)
Öncelikle belirtmek gerekir ki bu Ticaret Göstergesi Yeniden Çizim Yapmaz, Gecikmez ve Gecikme Göstermez, bu da hem manuel hem de robot ticareti için ideal hale getirir. Kullanıcı kılavuzu: ayarlar, girişler ve strateji. Atom Analisti, Piyasada Daha İyi Bir Avantaj Bulmak İçin Fiyatın Gücünü ve Momentumunu Kullanan PA Fiyat Hareketi Göstergesidir. Gürültüleri ve Yanlış Sinyalleri Kaldırmaya ve Ticaret Potansiyelini Artırmaya Yardımcı Olan Gelişmiş Filtrelerle Donatılmıştır. Birden fazla katma
Gold Stuff
Vasiliy Strukov
4.9 (269)
Gold Stuff, özellikle altın için tasarlanmış bir trend göstergesidir ve herhangi bir finansal enstrümanda da kullanılabilir. Gösterge yeniden çizilmez ve gecikmez. Önerilen zaman dilimi H1. Bu göstergede tam otomatik Uzman Danışman EA Gold Stuff çalışır. Profilimde bulabilirsiniz. Ayarları ve kişisel bir bonusu almak için satın alma işleminden hemen sonra benimle iletişime geçin!  Güçlü Destek ve Trend Tarayıcı göstergemizin ücretsiz bir kopyasını pm'den alabilirsiniz. Ben! AYARLAR Ok Ç
Trend Punch
Mohamed Hassan
4.91 (22)
This indicator is unstoppable when combined with our other indicator called  Support & Resistance . After purchase, send us a message and you will get it   for  FREE as a BONUS! Introducing Trend Punch , the revolutionary forex trend indicator that will transform the way you trade! Trend Punch is uniquely designed to provide precise buy and sell arrows during strong market trends, making your trading decisions clearer and more confident. Whether you're trading major currency pairs or exotic sym
ŞU ANDA %26 INDIRIMLI Yeni Başlayanlar veya Uzman Tüccarlar için En İyi Çözüm! Bu Gösterge benzersiz, yüksek kaliteli ve uygun fiyatlı bir ticaret aracıdır çünkü bir dizi tescilli özellik ve yeni bir formül ekledik. Sadece BİR grafik ile 28 Forex çifti için Döviz Gücünü okuyabilirsiniz! Yeni bir trendin veya scalping fırsatının tam tetik noktasını belirleyebildiğiniz için ticaretinizin nasıl gelişeceğini hayal edin? Kullanım kılavuzu: buraya tıklayın Bu ilk olan, orijinal! Değersiz bir
FX Power MT4 NG
Daniel Stein
5 (12)
Sabah Brifingimiz burada mql5 ve on Telegram! FX Power MT4 NG , uzun zamandır çok popüler olan döviz gücü ölçerimiz FX Power'ın yeni neslidir. Peki bu yeni nesil güç ölçer ne sunuyor? Orijinal FX Power hakkında sevdiğiniz her şey PLUS GOLD/XAU güç analizi Daha da hassas hesaplama sonuçları Ayrı ayrı yapılandırılabilir analiz dönemleri Daha da iyi performans için özelleştirilebilir hesaplama limiti Özel çokluDaha fazlasını görmek isteyenler için örnek ayarlar Her grafikte en sevdiğiniz renkler i
Currency Strength Wizard , başarılı ticaret için size hepsi bir arada çözüm sağlayan çok güçlü bir göstergedir. Gösterge, birden çok zaman dilimindeki tüm para birimlerinin verilerini kullanarak şu veya bu forex çiftinin gücünü hesaplar. Bu veriler, şu veya bu para biriminin gücünü görmek için kullanabileceğiniz, kullanımı kolay para birimi endeksi ve para birimi güç hatları biçiminde temsil edilir. İhtiyacınız olan tek şey, işlem yapmak istediğiniz tabloya göstergeyi eklemektir ve gösterge size
ŞU ANDA %31 INDIRIMLI !!! Yeni Başlayanlar veya Uzman Tüccarlar için En İyi Çözüm! Bu gösterge benzersiz, yüksek kaliteli ve uygun fiyatlı bir ticaret aracıdır çünkü bir dizi tescilli özellik ve gizli bir formül ekledik. Yalnızca BİR grafikle 28 döviz çiftinin tümü için Uyarılar verir. Yeni bir trendin veya scalping fırsatının tam tetik noktasını belirleyebildiğiniz için ticaretinizin nasıl gelişeceğini hayal edin! Yeni temel algoritmalar üzerine inşa edilen bu sistem, potansiyel işlemler
Şu anda %20 İNDİRİMLİ! Herhangi bir Acemi veya Uzman Tüccar için En İyi Çözüm! Bu gösterge paneli yazılımı 28 döviz çifti üzerinde çalışıyor. Ana göstergelerimizden 2'sine (Gelişmiş Para Birimi Gücü 28 ve Gelişmiş Para Birimi Dürtüsü) dayanmaktadır. Tüm Forex piyasasına harika bir genel bakış sağlar. Gelişmiş Para Birimi Gücü değerlerini, para birimi hareket hızını ve tüm (9) zaman dilimlerinde 28 Forex çifti için sinyalleri gösterir. Trendleri ve / veya scalping fırsatlarını belirlemek içi
Scalper Vault
Oleg Rodin
5 (29)
Scalper Vault , başarılı bir scalping için ihtiyacınız olan her şeyi size sağlayan profesyonel bir scalping sistemidir. Bu gösterge, forex ve ikili opsiyon tüccarları tarafından kullanılabilecek eksiksiz bir ticaret sistemidir. Önerilen zaman çerçevesi M5'tir. Sistem size trend yönünde doğru ok sinyalleri sağlar. Ayrıca size üst ve alt sinyaller ve Gann piyasa seviyeleri sağlar. Göstergeler, PUSH bildirimleri dahil her türlü uyarıyı sağlar. Göstergeyi satın aldıktan sonra lütfen benimle iletişim
Öncelikle, bu Ticaret Aracının Non-Repainting, Non-Redrawing ve Non-Lagging Gösterge olduğunu vurgulamakta fayda var, bu da onu profesyonel ticaret için ideal hale getiriyor. Çevrimiçi kurs, kullanıcı kılavuzu ve demo. Akıllı Fiyat Hareketi Kavramları Göstergesi, hem yeni hem de deneyimli tüccarlar için çok güçlü bir araçtır. İleri ticaret fikirlerini, Inner Circle Trader Analizi ve Smart Money Concepts Ticaret Stratejileri gibi 20'den fazla kullanışlı göstergeyi bir araya getirerek bir araya g
Order Block Hunter
Noha Mohamed Fathy Younes Badr
5 (1)
Order block hunter indicator is the best indicator for  hunt the order blocks that area where there has been a large concentration of limit orders waiting to be executed Order blocks are identified on a chart by observing previous price action and looking for areas where the price experienced significant movement or sudden changes in direction .This indicator does that for you by using very complicated codes and helps you to take the best areas To buy and sell because it make marks at the best a
Enigmera
Ivan Stefanov
5 (4)
ENIGMERA: Pazarın çekirdeği https://www.enigmera.com Giriş Bu gösterge ve ticaret sistemi, finansal piyasalar için dikkate değer bir yaklaşımdır. ENIGMERA, destek ve direnç seviyelerini doğru bir şekilde hesaplamak için fraktal döngüleri kullanır. Gerçek birikim aşamasını gösterir ve yön ve hedefler verir.  İster bir trendde ister bir düzeltmede olalım çalışan bir sistem.  Nasıl çalışır? ENIGMERA üç çizgiden oluşur: destek/direnç çizgisi, hedef çizgisi ve sapma çizgisi. Sistem, geçmiş veril
- Real price is 80$ - 50% Discount ( It is 39$ now ) Contact me for instruction, any questions! Introduction The breakout and retest strategy is traded support and resistance levels. it involves price breaking through a previous level.  The break and retest strategy is designed to help traders do two main things, the first is to avoid false breakouts. Many false breakouts start with a candlestick that breaks out of a level but ends with an immediate candlestick that brings the price back into t
Trend Screener
STE S.S.COMPANY
4.82 (93)
Trend Göstergesi, Trend Alım Satım ve Filtreleme için Çığır Açan Benzersiz Çözüm, Tüm Önemli Trend Özellikleriyle Tek Bir Araç İçinde Yerleştirildi! Forex, emtialar, kripto para birimleri, endeksler ve hisse senetleri gibi tüm sembollerde/araçlarda kullanılabilen %100 yeniden boyamayan çoklu zaman çerçevesi ve Çoklu para birimi göstergesidir. Trend Screener, grafikte noktalarla ok trend sinyalleri sağlayan etkili bir trend trend göstergesidir. Trend analizörü göstergesinde bulunan özellikler: 1.
Gold Channel is a volatility-based indicator, developed with a specific timing algorithm for the XAUUSD pair, which consists of finding possible corrections in the market. This indicator shows two outer lines, an inner line (retracement line) and an arrow sign, where the theory of the channel is to help identify overbought and oversold conditions in the market. The market price will generally fall between the boundaries of the channel. If prices touch or move outside the channel it is a tra
Özel MT4 göstergemizle başarılı forex ticaretinin sırrını keşfedin! Forex piyasasında nasıl başarıya ulaşacağınızı hiç merak ettiniz, riski en aza indirirken sürekli olarak kar kazandınız mı? İşte aradığınız cevap! Ticaret yaklaşımınızda devrim yaratacak tescilli MT4 göstergimizi tanıtmamıza izin verin. Benzersiz çok yönlülük Göstergemiz, Renko ve RangeBar Mum oluşumlarını tercih eden kullanıcılar için özel olarak tasarlanmıştır. Bu grafik türlerinin birçok deneyimli tüccar tarafından ter
Automated Trendlines
Georgios Kalomoiropoulos
5 (17)
Trend çizgileri, forex ticaretinde en önemli teknik analiz aracıdır. Ne yazık ki, çoğu tüccar onları doğru şekilde çizmez. Otomatik Trend Çizgileri göstergesi, piyasaların trend hareketini görselleştirmenize yardımcı olan ciddi tüccarlar için profesyonel bir araçtır. İki tür Trend Çizgisi, Boğa Trend Çizgisi ve Ayı Trend Çizgisi vardır. Yükseliş trendinde, Forex trend çizgisi, fiyat hareketinin en düşük salınım noktalarından geçer. En az iki "en düşük düşük"ü birleştirmek, bir trend çiz
Advanced Supply Demand
Bernhard Schweigert
4.9 (314)
CURRENTLY 26% OFF !! Best Solution for any Newbie or Expert Trader! This indicator is a unique, high quality and affordable trading tool because we have incorporated a number of proprietary features and a new formula. With this update, you will be able to show double timeframe zones. You will not only be able to show a higher TF but to show both, the chart TF, PLUS the higher TF: SHOWING NESTED ZONES. All Supply Demand traders will love it. :) Important Information Revealed Maximize the potenti
ÜRÜNÜ SATIN ALMADAN ÖNCE LÜTFEN AŞAĞIDAKİ BİLGİLERİ OKUYUNUZ! Apollo Pips PLUS SP benzersiz bir üründür! YENİ "APOLLO PIPS" GÖSTERGEMİ ARTI TÜM İŞLEM GÖSTERGELERİME ERİŞİM İLE "SÜPER PAKET" BONUSUNU ALMAK İSTEYENLER İÇİN! Apollo Pips PLUS SP ürününü satın alarak aslında Apollo Pips göstergemin tamamen yeni bir versiyonunu satın almış oluyorsunuz. Göstergenin bu sürümü, geliştirilmiş bir algoritmaya ve kullanımı kolay bir parametreye sahiptir; bu, size göstergeyi herhangi bir piyasada ve herhangi
PZ Day Trading
PZ TRADING SLU
3.67 (3)
Effortless trading: non-repainting indicator for accurate price reversals Special Offer: Purchase now to receive free bonuses worth $189! (Read more for details) This indicator detects price reversals in a zig-zag fashion, using only price action analysis and a donchian channel. It has been specifically designed for short-term trading, without repainting or backpainting at all. It is a fantastic tool for shrewd traders aiming to increase the timing of their operations. [ Installation Guide | Up
AW Trend Predictor
AW Trading Software Limited
4.74 (39)
Tek bir sistemde trend ve arıza seviyelerinin kombinasyonu. Gelişmiş bir gösterge algoritması piyasa gürültüsünü filtreler, trendi, giriş noktalarını ve olası çıkış seviyelerini belirler. Gösterge sinyalleri, sinyal geçmişinin etkinliğini gösteren en uygun araçları seçmenize izin veren istatistiksel bir modüle kaydedilir. Gösterge Kâr Al ve Zararı Durdur işaretlerini hesaplar. Kılavuz ve talimat ->   Burada   / MT5 versiyonu ->   Burada Gösterge ile nasıl ticaret yapılır: Trend Predictor ile iş
IX Power MT4
Daniel Stein
5 (6)
IX Power nihayet FX Power'ın rakipsiz hassasiyetini Forex dışı sembollere getiriyor. En sevdiğiniz endeksler, hisse senetleri, emtialar, ETF'ler ve hatta kripto para birimlerindeki kısa, orta ve uzun vadeli eğilimlerin yoğunluğunu doğru bir şekilde belirler. Terminalinizin sunduğu her şeyi analiz edebilirsiniz. Deneyin ve işlem yaparken zamanlamanızın nasıl önemli ölçüde iyileştiğini deneyimleyin. IX Power Temel Özellikler 100 hassas, yeniden boyanmayan hesaplama sonuçları - terminalini
M1 Arrow
Oleg Rodin
4.73 (15)
Piyasanın iki temel ilkesine dayanan bir gün içi stratejisi. Algoritma, ek filtreler kullanarak hacimlerin ve fiyat dalgalarının analizine dayanmaktadır. Göstergenin akıllı algoritması, yalnızca iki piyasa faktörü bir araya geldiğinde bir sinyal verir. Gösterge, daha yüksek zaman çerçevesinin verilerini kullanarak M1 grafiğinde belirli bir aralıktaki dalgaları hesaplar. Ve dalgayı doğrulamak için gösterge, hacme göre analizi kullanır. Bu gösterge hazır bir ticaret sistemidir. Bir tüccarın ihtiya
Break and Retest
Mohamed Hassan
4.12 (17)
This Indicator only places quality trades when the market is really in your favor with a clear break and retest. Patience is key with this price action strategy! If you want more alert signals per day, you increase the number next to the parameter called: Support & Resistance Sensitivity.  After many months of hard work and dedication, we are extremely proud to present you our  Break and Retest price action indicator created from scratch. One of the most complex indicators that we made with ove
TPSpro RFI Levels
Roman Podpora
4.83 (24)
Reversal First Impulse levels (RFI)    INSTRUCTIONS        RUS       -       ENG              R ecommended to use with an indicator   -   TPSpro  TREND PRO -  Version MT5 A key element in trading is zones or levels from which decisions to buy or sell a trading instrument are made. Despite attempts by major players to conceal their presence in the market, they inevitably leave traces. Our task was to learn how to identify these traces and interpret them correctly. Main functions: Displaying activ
PZ Mean Reversion MT4
PZ TRADING SLU
2.33 (3)
Ortalama geri dönüş ticareti için profesyonel ve nicel bir yaklaşım uygulayan benzersiz gösterge. Fiyatın tahmin edilebilir ve ölçülebilir bir şekilde ortalamaya döndüğü ve yön değiştirdiği gerçeğinden yararlanır, bu da nicel olmayan ticaret stratejilerinden büyük ölçüde daha iyi performans gösteren net giriş ve çıkış kurallarına izin verir. [ Installation Guide | Update Guide | Troubleshooting | FAQ | All Products ] Ticaret sinyallerini temizle Ticaret yapmak inanılmaz derecede kolay Özelleş
GOLD Impulse with Alert
Bernhard Schweigert
4.56 (9)
Bu gösterge, 2 ürünümüz Advanced Currency IMPULSE with ALERT  +   Currency Strength Exotics  'in süper bir kombinasyonudur. Tüm zaman dilimleri için çalışır ve 8 ana para birimi artı bir Sembol için grafiksel olarak güç veya zayıflık dürtüsünü gösterir! Bu Gösterge, Altın, Egzotik Çiftler, Emtialar, Endeksler veya Vadeli İşlemler gibi herhangi bir sembol için para birimi gücü ivmesini göstermek için uzmanlaşmıştır. Türünün ilk örneğidir, Altın, Gümüş, Petrol, DAX, US30, MXN, TRY, CNH vb.
Yazarın diğer ürünleri
MT4 için Astronomi Göstergesini Tanıtıyoruz: En İleri Göksel Ticaret Arkadaşınız Ticaret deneyiminizi göksel seviyelere yükseltmeye hazır mısınız? MT4 için devrim niteliğindeki Astronomi Göstergemizi arayın. Bu yenilikçi araç karmaşık algoritmaları kullanarak eşsiz astronomik içgörüler ve hassas hesaplamalar sunmak için geleneksel ticaret göstergelerini aşmaktadır. Bilgi Evreni Parmaklarınızın Ucunda: Göksel verilerin hazinelerini açığa çıkaran kapsamlı bir paneli gözlemleyin. Gezegenlerin geo/h
Gann Kare Göstergesi, W.D. Gann tarafından yazılan "Piyasa Tahminleri için Matematiksel Formül" makalesine dayalı güçlü bir piyasa analizi aracıdır. Bu araç, piyasa analizi için matematiksel ve Gann teorilerini kullanarak hassas analizler gerçekleştirir. 144, 90, 52 karelerini ve ayrıca 9 karesini kullanır. Ayrıca, 'ın 9 karesi ve bu kareyle ilişkili kanallar ve yıldız modelleri için yöntemini içerir. Kullanıcı Kılavuzu ve Uygulama: Bu göstergeleri kullanmadan önce, kullanıcı kılavuzunu okumanız
Sizlere ON Trade Waves Patterns Harmonic Elliot Wolfe'u tanıtmaktan mutluluk duyarız. Bu, manuel ve otomatik yöntemleri kullanarak piyasada çeşitli desenleri tespit etmek için tasarlanmış gelişmiş bir göstergedir. İşte nasıl çalıştığı: Harmonik Desenler: Bu gösterge, grafiğinizde görünen harmonik desenleri tanımlayabilir. Bu desenler, Scott Carney'in "Harmonic Trading vol 1 & 2" adlı kitabında açıklandığı gibi harmonik ticaret teorisini uygulayan tüccarlar için önemlidir. Onları manuel olarak ç
Shepherd Harmonic Pattern
Abdullah Alrai
4.68 (59)
Bu gösterge, manuel ve otomatik yöntemlerle çizilen harmonik desenleri algılar. Kullanım kılavuzuna şu bağlantıdan erişebilirsiniz: İncelemenizi ekleyin ve ürünü almak için bizimle iletişime geçin. Bu ürünü mt4'te denemek için ücretsiz bir sürümü vardır. Gartley ve Nenstar desenlerini algılamak için kullanabilirsiniz: https://www.mql5.com/en/market/product/30181 Tam MT4 sürümünü şuradan satın alabilirsiniz: https://www.mql5.com/en/market/product/15212 Notlar Gösterge kontrol paneline sahiptir ve
Bu gösterge, Elliott dalga teorisi ile iki şekilde çalışır: Otomatik Çalışma: Bu modda gösterge, Elliott dalga teorisine uygun olarak grafikteki beş hareket dalgasını otomatik olarak tespit edecek ve tahminlerde bulunacak, potansiyel ters dönüş bölgelerini belirleyecektir. Ayrıca, önemli gelişmeler hakkında tüccarları uyarılar ve bildirimlerle bilgilendirebilme yeteneğine sahiptir. Bu otomatik işlev, Elliott dalga desenlerinin tanımlanması ve analiz sürecini basit hale getirir. Manuel Çalışma: B
ON Trade Pivoteer
Abdullah Alrai
4 (1)
Introducing the Pivot Point Selector Indicator: Your Ultimate Tool for Custom Pivot Levels Are you ready to take your trading to the next level? Say hello to the Pivot Point Selector Indicator, a game-changing tool that puts you in control of your pivot levels. This innovative indicator empowers you to choose three specific points that will determine the pivot level calculations, giving you unparalleled customization and precision in your trading strategy. Key Features and Benefits: Custom Pivo
FREE
This indicator will detect harmonic patterns that are drawn on the chart by manual and automatic methods. You can see user manual from this link: https://www.mql5.com/en/blogs/post/719257 There is a free version (it detect only Gartley and Nenstar Patterns) to try this product. You can buy the full MT4 version from: https://www.mql5.com/en/market/product/104689 Notes When you use this indicator and change the settings, add indicators like Moving Average or Bollinger Bands, this indicator will
FREE
Bu gösterge, W.D. Gann'ın dokuzun karesi ve 144'ün karesine bağlı olarak yazdığı "Piyasa tahminleri için matematiksel formül" makalesine dayanan bir piyasa analiz yöntemidir. Kullanım kılavuzu: Add Your review And contact us to get it Tam MT5 Sürümünü Şunlardan Satın Alabilirsiniz: https://www.mql5.com/en/market/product/28669 MT4'te ücretsiz olarak test edebilirsiniz: https://www.mql5.com/en/market/product/15316 Bu ürün sizin için Düzeyler / Yıldız / Izgara / Gann hayranları
FREE
Hikkake Japon Şamdan Deseni, grafikte oluşan Hikkake Fiyat Hareket Desenlerini belirlemek ve tespit etmek üzere tasarlanmış özel bir göstergedir. Bu desenler, genellikle potansiyel ticaret fırsatlarına yol açan bir iç çubukta sahte bir dışarı çıkma kavramına dayanır. Göstergenin temel işlevi, grafiğin son beş şamdanını analiz etmek ve bu şamdanların Hikkake deseninin özelliklerini sergileyip sergilemediğini belirlemektir. Bu desen onaylandığında, gösterge deseni oluşturan şamdanların etrafına bi
This indicator offers a comprehensive and efficient solution for traders seeking optimal entries in scalping strategies. Leveraging moving averages and stochastic indicators, it employs a systematic approach to identify favorable trade opportunities. The indicator goes beyond mere analysis, actively drawing clear and actionable entry points on your chart, denoted by arrows. Moreover, it provides the convenience of alerts to ensure you never miss these potential setups. Key Features and Benefits:
FREE
ON Trade Marubozu Mum Modeli Göstergesi Marubozu mum modeli, piyasa duyarlılığını ve potansiyel trend dönüşlerini değerli bilgilerle sunabilen güçlü ve açık bir mum modelidir. Bu model, uçlarından birinde çok küçük veya hiç gölge (fitil) bulunmayan ve baskın trendin yönünde uzanan uzun bir gövdeye sahip bir mumla karakterizedir. Bu model, alıcılar ve satıcılar arasında güçlü bir dengesizliği temsil eder ve piyasada momentumun güçlü bir şekilde tek taraflı olduğunu gösterir. Özellikler ve Faydala
FREE
ON Trade Pivots is A technical indicator that Draws all Pivot levels depending on time frame that defined in settings. Notes It will be good tool for all traders who use pivot levels in their trades. Let me inform you that this indicator draw this level as buffers not as objects then you can connect it easily to EA. This indicator allow you to find pivots levels for any time frame not only daily you are free to choose time frame from settings. Parameters Use_System_Visuals - Enable /Disable
FREE
Altın Gram Fiyatı Hesaplayıcı Gösterge Tanıtımı Yerel para biriminizdeki altın fiyatını sürekli olarak takip etmek istiyor musunuz? Daha fazla aramayın, Altın Gram Fiyatı Hesaplayıcı Gösterge, tercih ettiğiniz yerel para biriminde gerçek zamanlı olarak gram başına altın fiyatını hesaplamanıza olanak sağlayan yenilikçi bir araç sunar. Bu gösterge ile finansal bilgileri kullanarak bilinçli kararlar alabilirsiniz. Ana Özellikler: Yerelleştirilmiş Altın Fiyatı: Altın Gram Fiyatı Hesaplayıcı Gösterge
FREE
Bu gösterge, ticaret grafiğinizde Donchian kanalını görsel olarak temsil etme amacını taşır. Donchian kanalı, belirli bir dönemde en yüksek yüksek ve en düşük düşük arasındaki aralığı gösteren basit bir teknik araçtır. Bu gösterge, fiyat hareketlerinin görsel analizini geliştirerek potansiyel kırılma ve trend devam noktalarına dair anlayış sunar. Donchian kanalı, bu seçeneği etkinleştirmeyi tercih ederseniz hem geçerli zaman dilimine hem de daha yüksek bir zaman dilimine uygulanabilir. Gösterge
FREE
"Bu gösterge basit bir eğilim tespit aracıdır. Skalping modu gibi iyi girişlere sahip olmak için stratejinizle birlikte kullanabilirsiniz. Fiyatın etrafında bir kanal çizecektir ve zaman arttıkça genişleyecektir; özel dönemlerde algoritma çalışma süresi ve fiyatı bir araya getirerek artış noktasının başlangıcına dönecektir. Ters dönüş işaretleri göründükten sonra kanalın en düşük sınırından satın alabilirsiniz. Ve ters dönüş işaretlerini gördükten sonra en yüksek kanal sınırından satabilirsiniz
Rsi Channel
Abdullah Alrai
5 (1)
This indicator displays the channel of Relative Strength Index. When you see that the price touches the red line and retreats from it many times, then you will know that the general trend is down. When it retreats from the blue line many times, that means that the general trend is up. This lines express the RSI values attributed to the price values on the main chart. You can add this indicator to your strategy, it will help you. This indicator will work best on 5 minutes and higher time frames.
Bu araç sayesinde grafiklerinizde regresyon kanalını kontrol etme yeteneği elde edersiniz. Kanal seviyelerini, destek ve direnç seviyelerini sağlayacaktır. Ayrıca düzeltme dalgası seviyelerini sunar. Ayrıca, dolum ve ışın seçenekleri gibi kanalı doğrudan kontrol etme imkanını sağlayan bir kontrol paneli üzerinden kanalı yönetebilirsiniz. Ayrıca, farklı çiftlerle işlem yaparken daha iyi bir görünüm elde etmek için daha yüksek zaman dilimlerinden veri yükleyebilirsiniz. Nasıl Kullanılır: Trend Çiz
Güçlü Forex göstergemizi sizlere sunuyoruz. Bu gösterge, ticaret stratejinizi geliştirmeniz ve size piyasa trendleri hakkında kesin bilgiler sağlamanız için tasarlanmıştır. Bu yenilikçi araç, mum ölçümlerini ayrıntılı bir şekilde analiz eden ve en iyi hassasiyeti elde etmek için ayarlamalar yapan sofistike bir özel algoritma kullanır. Sonuç? Grafiğinizde stratejik giriş noktalarını gösteren dikkatlice çizilmiş bir ok takımı. Bu göstergenin arkasındaki dahilik, mum desenlerinin gücünden faydalanm
"Bu gösterge, Bystra deseni teorisine dayalı olarak girişleri tespit eder ve hedef ve durma seviyeleri ile sınırlı emirleri yerleştirmek için giriş değerlerini sağlar. Bu, risk yüzdesini hesaplamanıza olanak tanır. Notlar: Bu gösterge, Uzman Danışmanlar (EA) içinde kullanım için tamponlara sahiptir. Bu ürünle çalışırken iyi bir para yönetimi uygulamanız önemlidir. Zaman diliminizi değiştirdiğinizde, Gösterge, son oturumunuzda kullanılan şablonu kaydedecektir. Bu yöntemi öğrenmek için bir kitaba
"Fibo Star" göstergesi, Fibonacci Fanlarını yıldız şeklinde grafik üzerine çizmek için tasarlanmıştır. Bu Fibonacci Fanları, fiyat hareketlerini analiz etmek için güçlü bir araçtır ve potansiyel destek ve direnç seviyeleri hakkında görüşler sunabilir. Bu gösterge, çizim ve yapılandırma sürecini kolaylaştırmayı amaçlayan kullanıcı dostu bir kontrol paneli ile donatılmıştır, böylece zaman ve çaba tasarrufu sağlar. Kullanım Talimatları: Bu gösterge manuel kullanım içindir. Etkili bir şekilde kullan
"Para Birimi Gücü" göstergesi, forex piyasasındaki farklı para birimlerinin göreceli gücünü sağlamak amacıyla tasarlanmış güçlü bir araçtır. Her bir para biriminin belirtilen zaman dilimine göre gücünü hesaplayarak ve temsil ederek, bu gösterge, trader'lara potansiyel işlem fırsatlarını tanımlama imkanı sunar, özellikle belirgin ayrışmalar veya kesişmeler gözlendiğinde. Gösterge Ana Özellikleri: 1. Para Birimi Gücü Hesaplama: Gösterge, her bir para biriminin belirtilen zaman dilimine göre gücünü
Güçlü Fiyat Hareketi Desenlerini Algılayan Teknik Gösterge: Pin Bar, Inside Bar ve Outside Bar Giriş: Teknik analizin alanında, fiyat hareketi desenleri potansiyel piyasa hareketlerinin önemli göstergeleri olarak işlev görür. Grafiklerde sağlam fiyat hareketi desenlerini tanımlamanın kolaylaştırıldığı sofistike bir teknik gösterge geliştirdik. Göstergemiz, üç temel deseni tanıma konusunda uzmanlaşmıştır: Pin Bar, Inside Bar ve Outside Bar. Ana Desenlerin Algılanması: Pin Bar: Pin Bar deseni, piy
Unlock Hidden Insights with the Numerokh Indicator: Your Numerology-Based Support and Resistance Tool Introducing the Numerokh indicator, a revolutionary tool that brings the mystical world of numerology into the realm of trading. Imagine having the power to identify key support and resistance levels on your charts using the age-old wisdom of numerology. This indicator takes trading to a new dimension, offering you a unique way to analyze price movements and make informed trading decisions. Key
Shepherd Numeroloji Seviye Göstergesi ile ticarette devrim yaratan bir yaklaşımı keşfedin. Bu yenilikçi araç, geleneksel ticaret tekniklerini antik numeroloji bilgisiyle birleştirerek grafiklerinizdeki önemli destek ve direnç seviyelerini belirlemenize yardımcı olur. Dokuzun karesi yöntemini kullanarak bu gösterge, piyasa mekanizmalarına farklı bir bakış açısı sunar ve daha bilinçli ticaret kararları almanıza olanak tanır. Ana Özellikler ve Avantajlar: Numeroloji ve Dokuzun Karesi: Shepherd Nume
Conclusioni: L'Indicatore ON Trade Numerology Mirror introduce una nuova prospettiva nell'analisi delle inversioni di prezzo integrando la saggezza antica della numerologia. Decifrando i modelli invertiti delle sequenze di numeri, ottieni una prospettiva unica sulle possibili inversioni di prezzo. Poiché il successo nel trading dipende da molti fattori, considera questo indicatore come parte integrante della tua strategia di trading globale. [Avviso: Il trading comporta rischi, e l'indicatore d
Maravilla Square Göstergesi Tanıtımı: Öngörülü İşlem İçin Yardımcınız Maravilla Square göstergesini keşfedin: Öngörülü işlem için anahtarınız. Bu eşsiz araç, fiyat tersine dönmeleri hakkında içgörü sunar ve yüksek ve düşük noktalar arasında ayarlanabilir bir eğilim çizgisi sunar. Trend Çizgisi Dinamiği: Maravilla Square göstergesi, grafiğin yüksek ve düşük noktalarına uyum sağlayabileceğiniz bir trend çizgisi sunar. Bu dinamik özellik, gösterge ile fiyat hareketleri arasında doğrudan bir bağlan
This indicator will give you entries as result of scalping strategy that will be applied on 14 symbols in same time and you are able to be notified with this entries  Note :   This indicator for scalping on 5 minutes timeframe only . How to use it : 1-Open chart and adjust settings (edit symbols names as your platform names , activate the alert system if you need it . 2-Wait for any signal you have it from this scanner you will have it as alert and as notification and you will see it on bo
This indicator gives you the signal of real cross on stochastic indicator. This indicator is easy to attach to an ea. This indicator will work best on All time frames. Arrow appears depending on many algorithms that study the cross parameters. Indicator properties Use_System_Visuals: enable/disable visual styles. Stochastic_K_Period. Stochastic_D_Period. Stochastic_Slowing. Use_Notifications: enable/disable Push Notifications. Use_Alert: enable/disable Alerts. Use_E_Mail: enable/disable Email
ON Trade Volaty'yi Tanıtıyoruz: Karlı Volatilite Kopma Çözümünüz ON Trade Volaty Göstergesi ile ticaret fırsatlarını kilitleyin. Gelişmiş volatilite analizi kullanarak kopma bölgelerini belirler, işlemlerinizi hassaslıkla yönlendirir. Stratejik giriş ve hedef noktalarıyla fiyat hareketlerini yakalayın, tümü ticaret tarzınıza uygun olarak düzenlenmiştir. Temel Özellikler: Gelişmiş Volatilite Analizi Stratejik Giriş Noktaları Dinamik Hedefleme Özelleştirilebilir Parametreler Uzman Danışman (EA) Uy
Tanıtıyoruz: "ON Trade VSA" - Hacim ve Dağılım Analizi için Ultimate Araç! Gücünü, hacim ve dağılım analizinin (VSA) öncü göstergesi "ON Trade VSA" ile keşfedin. VSA, piyasa gücünü değerlendirmek, trendleri tanımlamak ve bilinçli kararlar almak için trader'lar tarafından kullanılan güçlü bir metodolojidir. Şimdi "ON Trade VSA"yı, ticaret cephaneliğinizde vazgeçilmez bir araç haline getiren temel özelliklere göz atalım: Çok Renkli Hacim Mumları : Ortalama harekete dayalı olarak farklı renkler ata
Filtrele:
İnceleme yok
İncelemeye yanıt