• Genel bakış
  • İncelemeler (7)
  • Yorumlar (6)
  • Yenilikler

ON Trade Optuma Astro

5

MT4 için Astronomi Göstergesini Tanıtıyoruz: En İleri Göksel Ticaret Arkadaşınız

Ticaret deneyiminizi göksel seviyelere yükseltmeye hazır mısınız? MT4 için devrim niteliğindeki Astronomi Göstergemizi arayın. Bu yenilikçi araç karmaşık algoritmaları kullanarak eşsiz astronomik içgörüler ve hassas hesaplamalar sunmak için geleneksel ticaret göstergelerini aşmaktadır.

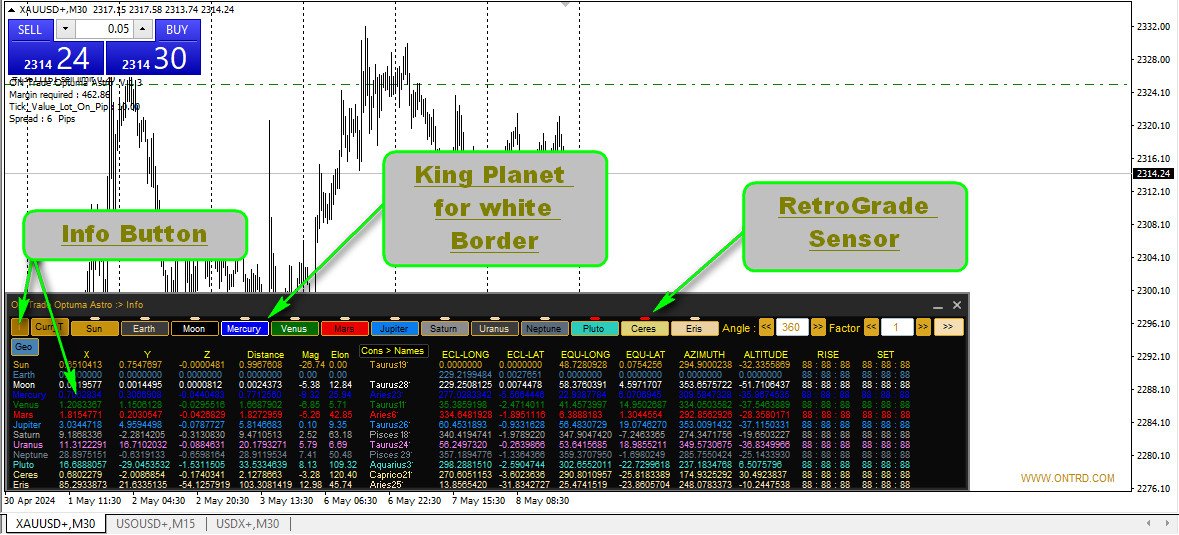
Bilgi Evreni Parmaklarınızın Ucunda: Göksel verilerin hazinelerini açığa çıkaran kapsamlı bir paneli gözlemleyin. Gezegenlerin geo/helyosantrik koordinatları, güneş/dünya mesafesi, büyüklükleri, uzantıları, takımyıldızları, ekliptik ve ekvator koordinatları ve hatta yatay koordinatlar gibi her ayrıntı titizlikle hesaplanır ve güzel bir şekilde sunulur. Gösterge tarafından üretilen dikey çizgi, zaman değerine karşılık gelir ve ticaret yolculuğunuzda kozmik bir perspektif sunar.

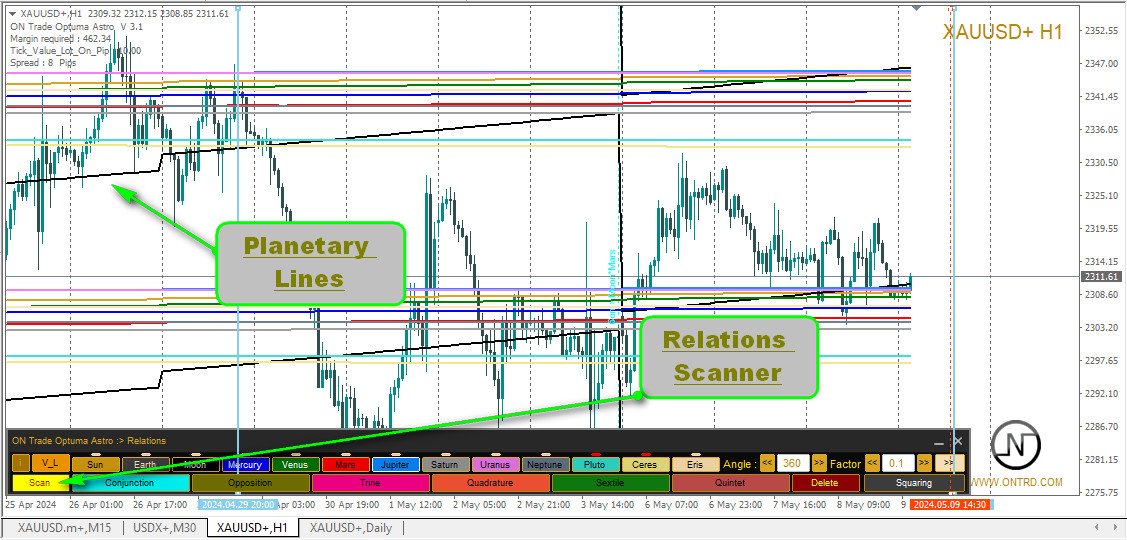
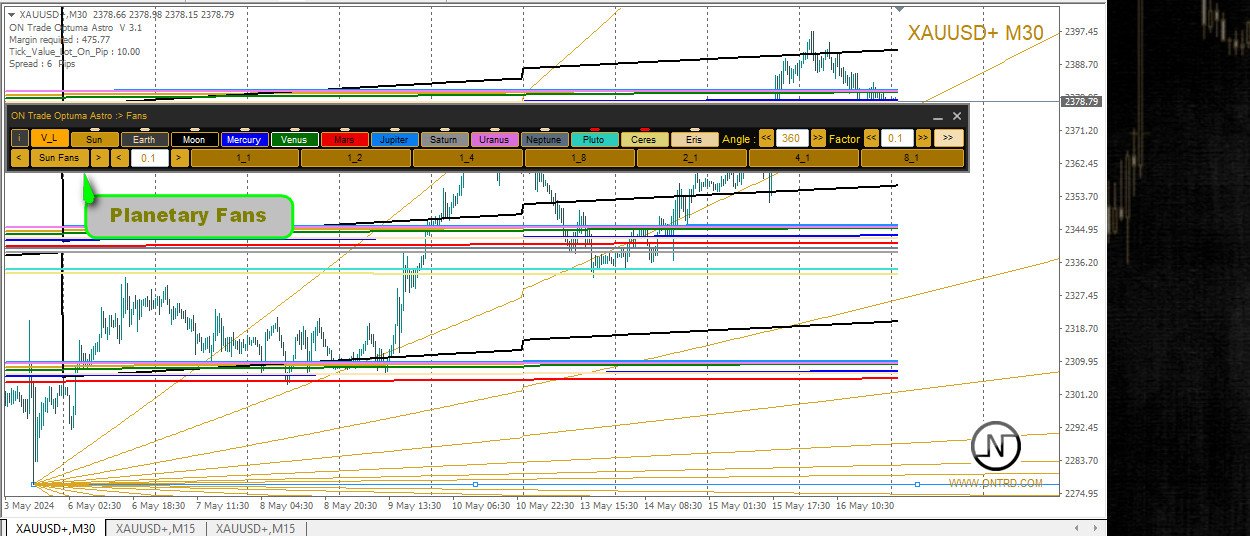
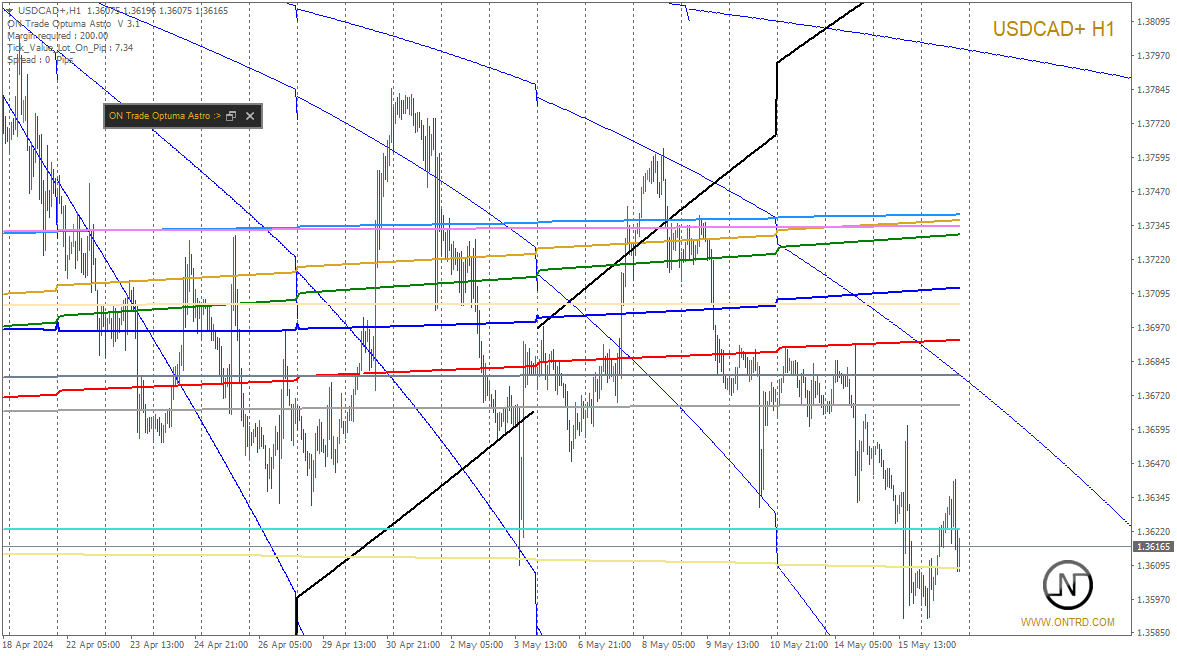
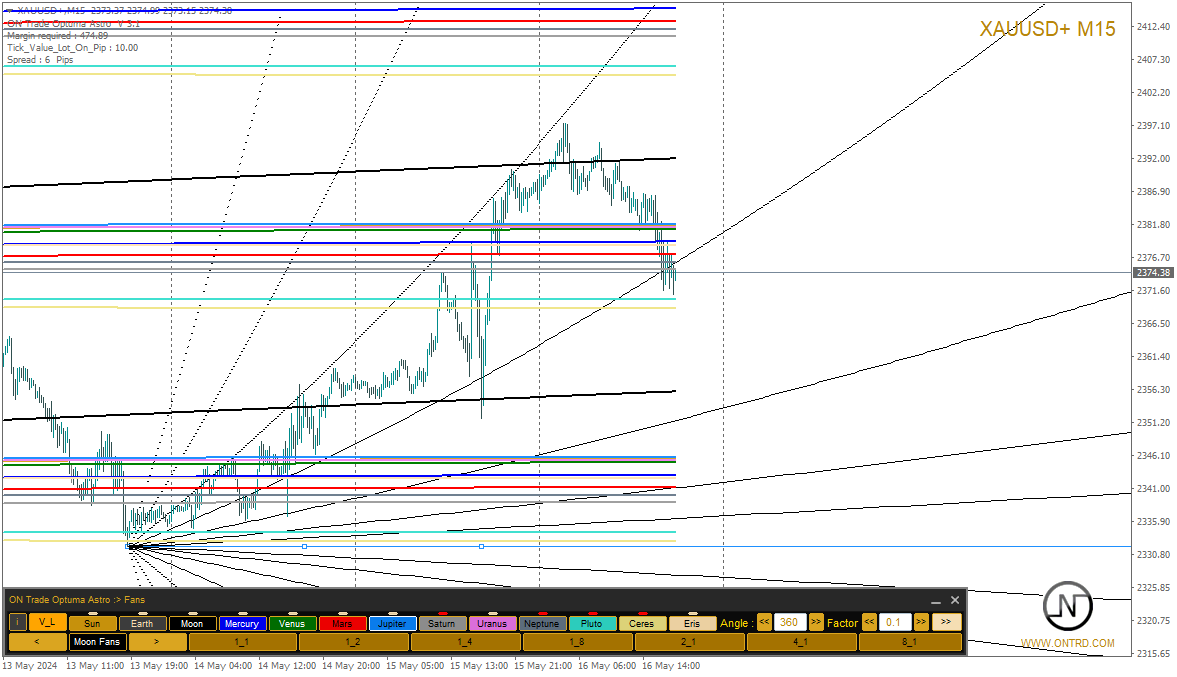
Gezegen Hatları ve İlişkiler: Grafiklerinizi süsleyen gezegen hatlarının büyüsünü deneyimleyin, ölçekleri ve açıları özelleştirilebilir. Her gezegen hattının görünürlüğünü sezgisel kontrol paneli aracılığıyla kolayca değiştirin. Konjunksiyonlar, sekstiller, kareler, trigonlar, oppositler ve retrogradlar için göstergelerle gezegen ilişkilerinin sanatını keşfedin. Bu kozmik konfigürasyonları seçtiğiniz zaman aralığında keşfederek önemli ticaret fırsatlarını belirleyebilirsiniz.

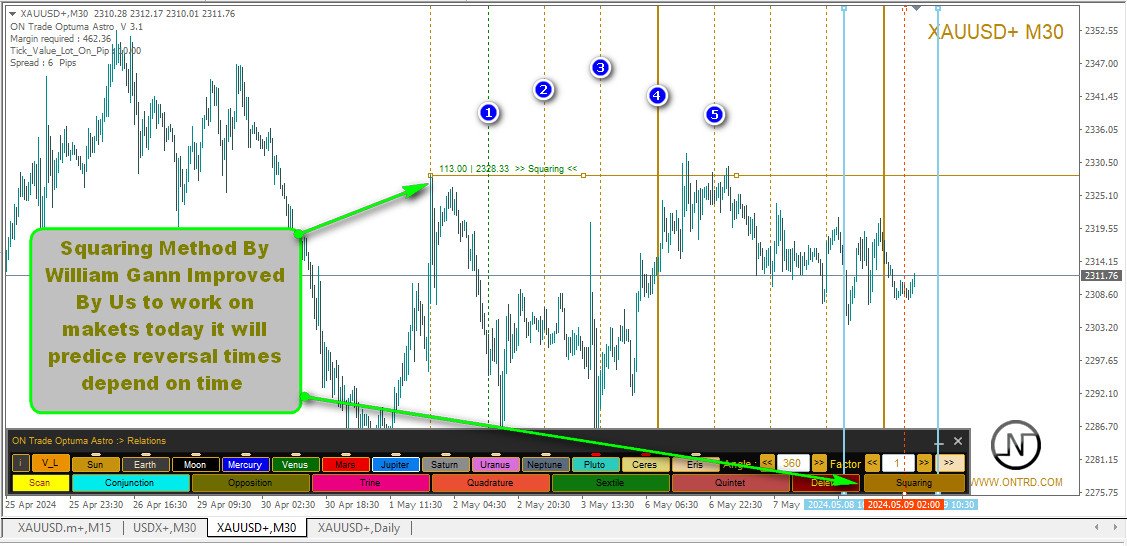
Gann'ın Bilgeliğini Açığa Çıkarın: Potansiyel ters dönüş zamanlarını gösteren Gann'dan esinlenilmiş kare hatlarını açığa çıkarın. Bu yenilikçi değişiklik, Gann'ın denenmiş prensiplerini hayata geçirerek piyasa dönüşlerini ve trendleri önceden tahmin etmenize yardımcı olur.

Ay Kılavuzluğu: Yeni Ay ve Dolunay'ın grafiklerinizi süslediği zarafetle ay fazlarını gezinin. Ay döngüleri ticarette önemli bir rol oynar ve göstergemiz sizin hiçbir ayrıntıyı kaçırmamanızı sağlar.

Dokuz Kare Avantajı: Astronomik analizlerinizi zenginleştirmek için Dokuz Kare panelini kullanın. Bu eski araç benzersiz fiyat ve zaman ilişkileri konusunda size güçlü bakış açıları sunmak için sorunsuz bir şekilde entegre edilmiştir.

Gezegen Derecesi Zamanı: Gezegen Derecesi Zamanı işleviyle gökyüzünde bir yolculuğa çıkın. Açıları kolayca ayarlayın ve ticaret kararlarınızı göksel bilgelikle uyumlu hale getirin.

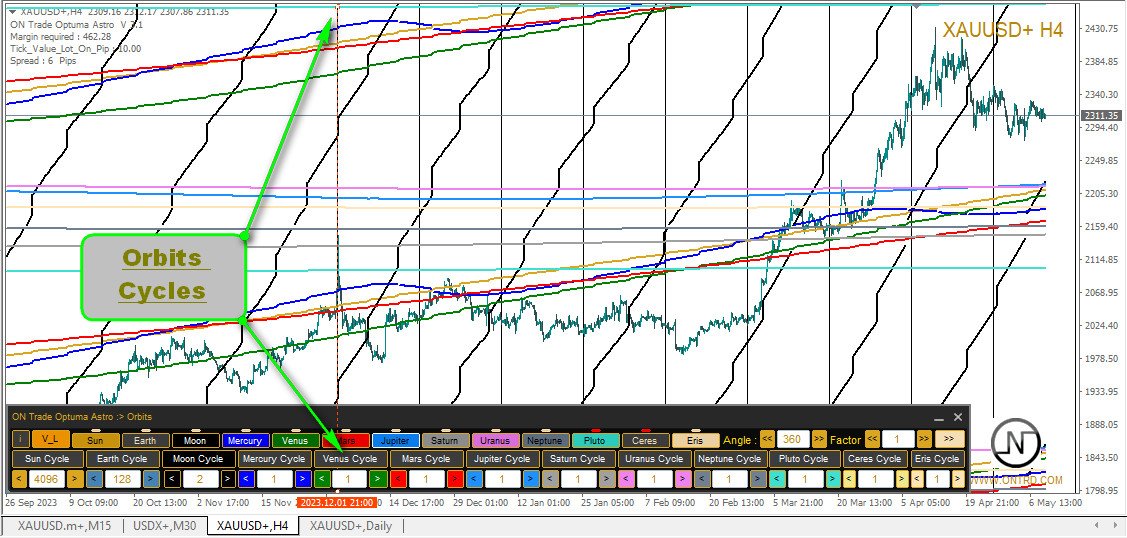
Yörüngeler ve Daha Fazlası: Göstergenin hesap bilgisi paneli, güçlü bir lot hesaplayıcısı ve alarm işlevi ile özelliklerini tamamlar, her zaman kontrol altında olmanızı sağlar.

Yıldızları Yakalayın: Netlik ve hassasiyet sunan bir örtüşme işleviyle ticaret evreninde gezinin. Her özellik sezgisel kontrol paneli üzerinden sorunsuzca erişilebilir, tercih ettiğiniz ayarları kişiselleştirilmiş bir ticaret yolculuğu için kaydedebilirsiniz.

Parlak Bir Gelecek Sizleri Bekliyor: Bu Astronomi Göstergesi, yeni bir çağın başlangıcını işaret ediyor. Potansiyelini kucaklarken, bunun sadece başlangıç olduğunu unutmayın. Güncellemeler yolda, onu pazarda lider ve eşsiz bir teklif olarak konumlandırma vizyonuyla geliyor.

Önemli Bir Not: Gösterge geri testi desteklemese de, işlevselliği özenle bir videoda ve ekli resimlerde yakalanmıştır. Dinamik yeteneklerini hareket halindeyken görün.

Görüşünüz Önemli: Bu kozmik ticaret yolculuğuna çıkarken, deneyimlerinizi yorumlar aracılığıyla paylaşmaktan çekinmeyin. Geri bildiriminiz mükemmeliyet arayışımızı besler.

Yıldızları kucaklayın, gezegenleri yakalayın ve güvenle ticaret evreninde gezinin. MT4 için Astronomi Göstergesi, finansal anlayışla kozmik hassasiyeti uyumlu bir dansla birleştirerek ticaret dünyasında rehber ışığınızdır.


İncelemeler 7
mzakiraden
261
mzakiraden 2024.04.18 02:00 
 

Works as expected. Beautifully coded! Zero issues.

ILYES123
328
ILYES123 2024.02.02 03:14 
 

great job and good indicator , and thank you Sir Abdullah for Support

ahmed nabil
23
ahmed nabil 2023.09.29 14:15 
 

good one

Önerilen ürünler
Position
Jinxiong Yuan
Positon index is the cyclical index of market trend movement, and Positon's value ranges from 0 to 100. When Positon value is below 10, it means that the market is in extreme decline, the market atmosphere is extremely pessimistic, and the market is about to hit bottom and turn around. When Positon value is above 80, it means that the market is in extreme excitement, the market atmosphere is extremely bullish, the market is about to peak and there is a sharp decline.
Utility for show on charts the visual informations about: - a vertical line at start of each bar of selected timeframe - a vertical line at start of each day - a vertical line at start of each week - vertical lines at start / end of trading sessions selected - bid / ask prices, spread, money value for each point (of 1 standard lot) and last tick time recived" You can enable / disable each information and set the color for each line
FREE
Forex Gump
Andrey Kozak
2.83 (6)
Forex Gump is a fully finished semi-automatic trading system. In the form of arrows, signals are displayed on the screen for opening and closing deals. All you need is to follow the instructions of the indicator. When the indicator shows a blue arrow, you need to open a buy order. When the indicator shows a red arrow, you need to open a sell order. Close orders when the indicator draws a yellow cross. In order to get the most effective result, we recommend using the timeframes H1, H4, D1. There
RSI Currency Strength Meter uses RSI (Relative Strength Index) to monitor how strong a currency is, or in other words, if it's being bought or sold by the majority compared to the other currencies. It displays the strength-lines of the currencies of the pair (base and counter currency of the chart) with changeable solid lines. Also, you can add up to ONE additional currency (only 1 in the DEMO version, in REAL up to 5) to the "comparison pool" that already has the base and the profit (counter) c
FREE
Rira Renko
Vitor Palmeira Abbehusen
RENKO on Time Chart This indicator is an enhanced Renko, so you can watch the Renko bricks on the chart to understand price movement more clearly the other improvement is automated box size according to ATR (Average True Range) period you can set the ATR number as you want and the box size of Renko changes automatically based on price movement Inputs Mode: Box size is the input to specify the size of the Renko box you want to print on the chart. This input lets you choose the fixed b
Metatrader 4 için R Show Ticks göstergesi, ana ticaret penceresinde gerçek zamanlı olarak yukarı/aşağı tikleri gösterir. Temel Çıkarımlar Beyaz ok bir yükseliştir. Kırmızı ok bir düşüş işaretidir. Gösterge, tercih ettiğiniz herhangi bir döviz çifti ve zaman çerçevesi için çalışır. Gösterge Özellikleri İşlem Platformu: Metatrader 4 (MT4) için geliştirildi Döviz çiftleri: Herhangi bir çift için çalışır Zaman dilimleri: Herhangi bir zaman dilimi için çalışır Giriş Parametreleri: Giriş se
反转K线指标! 指标将主图的K线在副图中进行反转显示. 交易实用必备工具指标 波浪自动计算指标,通道趋势交易 完美的趋势-波浪自动计算通道计算 , MT4版本 完美的趋势-波浪自动计算通道计算 , MT5版本 本地跟单复制交易 Easy And Fast Copy , MT4版本 Easy And Fast Copy , MT5版本 本地跟单复制交易 模拟试用 Easy And Fast Copy , MT4 模拟账号运行 Easy And Fast Copy , MT5 模拟账号运行 The indicator of the attached figure shows that it is a mirror image of the candlestick chart of the main chart. The ordinate of the figure indicator is mirrored with the main image, and the coordinate value is a negative number. For graphic reference o
Sto Signal AM
Andriy Matviyevs'kyy
5 (1)
This indicator displays Stochastic osc signals on the price chart and allows the user to receive notifications of such signals. The Stochastic indicator is a classic and proven indicator of the technical analysis of the markets. Despite its age, it is still relevant today. Depending on the settings, the indicator allows you to work effectively on various TFs and any markets. Signals are given on fully formed bars and are not redrawn. Custom Parameters: Stochastic_Price (0-1) - The applied pric
FREE
Indicator for binary options arrow is easy to use and does not require configuration works on all currency pairs, cryptocurrencies buy signal blue up arrow sell signal red down arrow tips do not trade during news and 15-30 minutes before their release, as the market is too volatile and there is a lot of noise it is worth entering trades one or two candles from the current period (recommended for 1 candle) timeframe up to m 15 recommended money management fixed lot or fixed percentage of the depo
"Bu gösterge, Bystra deseni teorisine dayalı olarak girişleri tespit eder ve hedef ve durma seviyeleri ile sınırlı emirleri yerleştirmek için giriş değerlerini sağlar. Bu, risk yüzdesini hesaplamanıza olanak tanır. Notlar: Bu gösterge, Uzman Danışmanlar (EA) içinde kullanım için tamponlara sahiptir. Bu ürünle çalışırken iyi bir para yönetimi uygulamanız önemlidir. Zaman diliminizi değiştirdiğinizde, Gösterge, son oturumunuzda kullanılan şablonu kaydedecektir. Bu yöntemi öğrenmek için bir kitaba
Binary Options Support Resistance Indicator This indicator is designed for binary options trading and effectively shows retracements from support and resistance levels. Signals appear on the current candle. A red arrow pointing downwards indicates a potential selling opportunity, while a blue arrow pointing upwards suggests buying opportunities. All that needs adjustment is the color of the signal arrows. It is recommended to use it on the M1-M5 timeframes as signals are frequent on these timef
Shark Deal Book
Philip Pankaj Suthagar
4 (3)
Term  "shark"  in the business world denotes a high volume investor who just made a good investment in a highly Potential business deal.So, sharks are the ones who make the market move. In our case, if an American shark bought a Japanese company, he/she has to convert American dollars into Japanese yen to make the deal. So, the demand for the Japanese yen will increase sharply. Thus USD/JPY will go short rapidly if the deal was from the shark. Another example, In the case of forex, if fed increa
This indicator is, without a doubt, the best variation of the Gann Angles among others. It allows traders using Gann methods to automatically calculate the Gann angles for the traded instrument. The scale is automatically calculated when the indicator is attached to the chart. When switching timeframes, the indicator recalculates the scale for the current timeframe. Additionally, you can enter your own scales for the Gann angles. You can enter your own scales either for both vectors or for each
Breakout Monster Mini
Abdulfattah Yahya Mohammed Alhazmi
5 (1)
It is a very profitable EA, to trade trends breakout, and manage trades, takeprofit, stoploss, move to breakeven, and trailing stop. I work with this EA, and the reversal/pullback version since 2014.  This is a demo   version of the full   Breakout Monster EA . It works on Real and Demo accounts. Demo version restrictions: Money Management is disabled. Lot size is restricted to 0.01 lots only (Or the minimum allowed by broker). Numerical, SL and TP set to 100 pips. They cannot be modified i
FREE
****** Easy to understand, correct Trade direction indicator, quick and easy to visualize******* BING Proper Path Indicator(BPP) will show BUY/SELL signals on-screen in an easy-to-understand 'Traffic Light' format. Provides a final 'reassurance' and 'peace of mind' for taking an educated, high probability, low-risk, trade decision. In the same way, you use a rearview mirror for instantaneous information while taking a driving decision, the same way BING Proper Path Indicator(BPP) will help you
Auto AndrewFork
Noor Ghani Rahman
1 (1)
Auto Pitchfork Indicator The indicator calculate the Pitch fork for the previous Day (Selectable) with multiple Support and Resistance lines from the Median price which acts as Magnet for the Price that if price touch the above warning (1) or below warning (1) lines and not cross up or down then there is maximum possibilities that it will return to the Median Line, and thus maintain the Price Action in Cyclic Pattern to the Market Move. You are able to select how many warning lines you want to k
MT4 için R 2EMA Renk göstergesi, 2 EMA'nın geçişine dayalı sağlam alım satım sinyalleri sağlar. Anahtar noktaları Fiyat iki yeşil EMA'nın üzerine çıkıp kapandığında, bir alım satım sinyali oluşturur. Fiyat iki kırmızı EMA'nın üzerine çıkıp kapandığında, bir satış sinyali oluşturur. R 2EMA Renkli Forex göstergesi, ne zaman alım satım zamanı geldiğini belirlemeyi daha da kolaylaştırır 2 EMA satırı yeşile döndüğünde bir satın alma sinyali oluşur. 2 EMA çizgisi kırmızıya döndüğünde bir satış si
The indicator allows you to trade binary options. The recommended time frame is М1 and the expiration time is 1,2,3 minutes. The indicator suitable for auto and manual trading. A possible signal is specified as a arrows above/under a candle. You should wait until the candle closes! Arrows are not re-painted Trade sessions: TOKYO section (Half-end) Currency pairs: USD/JPY Working time frame: M1 Expiration time: 1,2,3 minutes. The indicator also shows good results when using the martingale strateg
FREE
BB RSI Robot  is made for any level of users: Beginners can use it as it is, Experts can fully customize it. Bollinger Bands and RSI based algorithms for autotrading: it follows  3 Bollinger Bands  and  RSI levels  and places orders with all values computed when the algorithm gives a green flag. Order values use algorithms for risk management per trade and pips calculator. Each placed order is closely followed to be modified if more accurate Take Profit value is computed. BB RSI Robot is f
We present you the indicator "Candle closing counter", which will become your indispensable assistant in the world of trading. That’s why knowing when the candle will close can help: If you like to trade using candle patterns, you will know when the candle will be closed. This indicator will allow you to check if a known pattern has formed and if there is a possibility of trading. The indicator will help you to prepare for market opening and market closure. You can set a timer to create a p
The Stochastic Basket Currency Strenght  brings the Stochastic indicator to a new level.  Expanding the boundaries of TimeFrames and mono-currency analysis, the SBCS take the movements of each currency that composes the cross and confront them in the whole basket of 7 crosses.  The indicator works with any combination of AUD, CAD, CHF, EUR, GBP, JPY, NZD, USD pairs and with full automation takes in account every stochastic value (main line) for the selected Time Frame.  After that, the indicator
Gyroscope        professional forex expert   (for EURUSD, GBPUSD, USDJPY, AUDUSD, USDCHF, EURGBP, EURJPY, NZDUSD, USDCAD, EURCHF, AUDJPY, CADJPY pairs)   alyzing the market using the Elliot Wave Index. Elliott wave theory is the interpretation of processes in financial markets through a system of visual models (waves) on price charts. The author of the theory, Ralph Elliott, identified eight variants of alternating waves (of which five are in the trend and three are against the trend). The mo
This indicator Mega Super indicator.Indicator displays trend movement. Indicator helps to buy and sell.In dicator displays arrow and line. Features per - displays indicator period. How to understand the status: If the arrow color is green, trend is up. I f the arrow color is red, trend is down. //////////////////////////////////////////////////////////////////////////////////////////////////////////////////////////////////////////////////// //////////////////////////////////////////////
LordAutoFibonnaci
Igor Pereira Calil
5 (1)
Lord Auto Fibonnaci is a free indicator for Meta Trader, in order to show the most famous chart in the financial market known as "Fibonnaci". As we can see in the images below, the fibonnaci table will automatically analyze the graph for you, with trend factors through percentage, almost infallible use, you can always work when the percentage is low or high, start shopping and sales on time, great for analyzing entries! In the images below we can see an example in gold in H4, where we are a
FREE
This indicator Super Channel Pro indicator.Indicator displays trend movement. Indicator calculates automatically line. Features FiltPer - displays indicator channel period. deviation - displays indicator channel deviation. deviation2 - displays indicator channel deviation. How to understand the status: If the arrow is green, trend is up. If the arrow is red, trend is down. //////////////////////////////////////////////////////////////////////////////////////////////////////////////////////////
InitialBalance. Universal business tool from professional traders that helps to visualize interest market situations. It previews markets using a price action and sentiment in the market. Tool necessary to understand the market situation and the anticipation of further movement. Finally, you will see how traders estimate the market. Who knows the first steps in the market can estimate the point where the market will stop and reflect! With this tool, you will see important supports and resistance
The autonomous trading system Serenade works on the basis of a unique strategy for determining impulse movements after false breakouts and price rollbacks for a subsequent strong movement. The Expert Advisor has been successfully tested with 99% quotes quality, floating spread and random ping since 2010. Live signals here: https://www.mql5.com/en/users/trendhunter/seller Advisor optimization is not required. In the process, the algorithm of the adviser adjusts the sensitivity of the strategy.
Diamond PRO
Fanur Galamov
4.83 (18)
Diamond PRO is enhanced powerful version of Diamond for advanced traders. Pro version includes optimized cores, new impoved entry points filters, new multistage profit closure algorithm and сontains number of external control parameter that allows build and fine tune own tradind decisions and algorithms. The system provides more accurate market entries, analyzes and filters upcoming economic news, contains spread protection and an advanced position management algorithm. Main goal of Diamond PRO
The Arrow Scalper
Fawwaz Abdulmantaser Salim Albaker
1 (2)
Dear Friend..  I share with you this simple Expert Adviser .. it is full automatic  this Expert Adviser following the trend of the pair you install on or any stocks or indices , it is works like that: - when the trend on H4 chart show a start of up trend the expert will wait till the 15M & 1H charts show an up trend the EA will open a buy order directly , and do the same for down trend and open a sell order the buy or sell  order lot size and take profit and stop loss will measured manually  by
FREE
BACKTEST NOW!  (or see backtest sreenshots below, last update: 30/4/2021 ) ( How to backtest any system correctly ) LIVE SIGNAL :  https://www.mql5.com/en/signals/995254 CURVE is a Honest, Secure and Automated Software for Generation of Daily Profits on Forex Market. With its fully automatic architecture, CURVE is an autonomous Robot Expert capable of independently analyzing the market and making trading decisions. Martingale, Grid, Averaging and other dangerous strategies are NOT used.
Bu ürünün alıcıları ayrıca şunları da satın alıyor
Enigmera
Ivan Stefanov
5 (4)
ENIGMERA: Pazarın çekirdeği https://www.enigmera.com Giriş Bu gösterge ve ticaret sistemi, finansal piyasalar için dikkate değer bir yaklaşımdır. ENIGMERA, destek ve direnç seviyelerini doğru bir şekilde hesaplamak için fraktal döngüleri kullanır. Gerçek birikim aşamasını gösterir ve yön ve hedefler verir.  İster bir trendde ister bir düzeltmede olalım çalışan bir sistem.  Nasıl çalışır? ENIGMERA üç çizgiden oluşur: destek/direnç çizgisi, hedef çizgisi ve sapma çizgisi. Sistem, geçmiş veril
ÜRÜNÜ SATIN ALMADAN ÖNCE LÜTFEN AŞAĞIDAKİ BİLGİLERİ OKUYUNUZ! Apollo Pips PLUS SP benzersiz bir üründür! YENİ "APOLLO PIPS" GÖSTERGEMİ ARTI TÜM İŞLEM GÖSTERGELERİME ERİŞİM İLE "SÜPER PAKET" BONUSUNU ALMAK İSTEYENLER İÇİN! Apollo Pips PLUS SP ürününü satın alarak aslında Apollo Pips göstergemin tamamen yeni bir versiyonunu satın almış oluyorsunuz. Göstergenin bu sürümü, geliştirilmiş bir algoritmaya ve kullanımı kolay bir parametreye sahiptir; bu, size göstergeyi herhangi bir piyasada ve herhangi
TPSpro RFI Levels
Roman Podpora
4.83 (24)
Reversal First Impulse levels (RFI)    INSTRUCTIONS        RUS       -       ENG              R ecommended to use with an indicator   -   TPSpro  TREND PRO -  Version MT5 A key element in trading is zones or levels from which decisions to buy or sell a trading instrument are made. Despite attempts by major players to conceal their presence in the market, they inevitably leave traces. Our task was to learn how to identify these traces and interpret them correctly. Main functions: Displaying activ
Max Paynex
Abdulkarim Karazon
Max Payne, ok şeklinde sinyaller veren bir ters/trend sinyal göstergesidir, bu gösterge sinyalini aynı çubuk kapanışında verir, bu gösterge sinyallerin ikili/üçlü onayını almak için grafik üzerinde farklı periyotlarla birden çok kez düşebilir Gösterge, hiçbir zaman yeniden boyamaz veya arkasını boyamazken, herhangi bir ticaret stiline uyacak şekilde son derece ayarlanabilir; satın alma sonrasında, kullanılan şablonların yanı sıra ekran görüntülerinde gösterilen tüm sistemi elde edeceksiniz. ---
JULY OFFER 80% OFF next price for unlimited version will be 17000$. This is the only time you can get this institutional and professional indicator at this price for unlimited version. Don't dare to miss this. The tool I am about to introduce to you you can't compare it with other tools due to its strategy and accuracy level in predicting the next price directional movement . This tool is designed for serious traders who have decided to make a difference through trading. Be the next person to wi
How to use Pair Trading Station Pair Trading Station is recommended for H1 time frame and you can use it for any currency pairs. To generate buy and sell signal, follow few steps below to apply Pair Trading Station to your MetaTrader terminal. When you load Pair Trading Station on your chart, Pair Trading station will assess available historical data in your MetaTrader platforms for each currency pair. On your chart, the amount of historical data available will be displayed for each currency pai
Dear Traders this is my another tool called " Swing Master Indicator ". As the name above the indicator is designed to help you in swing trading by capturing the low and highs of the price. You may us this tool with any trading strategy and style from scalping to position trading. It is made for level of traders including newbies and advanced traders even prop-firms, hedge funds and banks to help them make sold market analysis. I create tools for serious traders who want to make a difference in
Indicator : RealValueIndicator Description : RealValueIndicator is a powerful tool designed specifically for trading on the EURUSD pair. This indicator analyzes all EUR and USD pairs, calculates their real currency strength values, and displays them as a single realistic value to give you a head start on price. This indicator will tell you moves before they happen if you use it right. RealValueIndicator allows you to get a quick and accurate overview of the EURUSD currency pair tops and bottoms,
Bomb Bank Signal
Igor Pereira Calil
Bomb Bank Signal: Your Trusted Indicator for MetaTrader 4 The Bomb Bank Signal is a powerful indicator for MetaTrader 4, designed to identify the most relevant trends in the financial market. If you are looking for a tool that accurately anticipates movements, Bomb Bank is the ally you need. How it Works: This indicator combines three distinct methods – volume analysis, candle closes and symmetrical trend – to detect and signal buying and selling opportunities. Bomb Bank is like a "bomb"
The indicator is designed to work on any trading platform. The program is based on proprietary algorithms and W.D.Ganna's mathematics, allowing you to calculate target levels of price movement based on three points with the highest degree of certainty. It is a great tool for stock trading. The indicator has three buttons: NEW - call up a triangle for calculation. DEL - delete the selected triangle. DELS - completely remove all constructions. The probability of achieving the goals is more than 80
" ZigZag on Trend " göstergesi, fiyat hareketinin yönünü belirlemenin yanı sıra bir çubuk ve pip hesaplayıcıdır. Zikzak şeklinde sunulan bir trend çizgisi ile fiyatın yönünü izleyen bir trend göstergesi ve trend yönünde geçen çubuk sayısını ve dikey ölçekteki nokta sayısını hesaplayan bir sayaçtan oluşur. (Hesaplamalar çubuğun açılmasıyla yapılır) Gösterge yeniden çizilmez. Kolaylık sağlamak için renkli çubuklar veya çizgiler şeklinde tasarlanmıştır. Tüm TF'lerde kullanılabilir, ancak en iyisi M
TrendMaestro
Stefano Frisetti
5 (3)
note: this indicator is for METATRADER4, if you want the version for METATRADER5 this is the link:  https://www.mql5.com/it/market/product/108106 TRENDMAESTRO ver 2.4 TRENDMAESTRO recognizes a new TREND in the bud, he never makes mistakes. The certainty of identifying a new TREND is priceless. DESCRIPTION TRENDMAESTRO identifies a new TREND in the bud, this indicator examines the volatility, volumes and momentum to identify the moment in which there is an explosion of one or more of these data a
This product is based on the methodologies of Gann, his follower Don E. Hall. The Indicator builds a working view grid, which is used to analyze graphics. The Pyrapoint tool, developed by Don Hall, is a grid based on the Pythagorean cube. In his calculations he uses the Gann Square 9 methodology and the relationship between Price and Time. This tool is used to predict changes in trend and overall market actions. More information about the method   HERE
İŞLEM HIZI, piyasada büyük emirlerin nerede ve ne zaman biriktiğini ve bunun faydalarını gösteren en kaliteli göstergedir. Trend değişikliklerini çok erken aşamada tespit eder. Aynı anda hem bir gösterge hem de bir ticaret sistemidir. Konsept benzersiz ve inanılmaz derecede karlı. Forex'te tik hacmi oldukça yanıltıcı bir şekilde hacim olarak adlandırılır. Aslında, fiilen İŞLEM HIZI olan birim zaman başına fiyat değişimidir. Bu gösterge, Forex'teki hacim fikrini mantıksal olarak doğru şekilde
Contact us to receive a comprehensive user guide after purchasing. William Delbert Gann, commonly known as W.D. Gann, was an exceptional market analyst renowned for his unique trading style in the early 20th century.  His trading techniques were based on a blend of mathematics, geometry, astrology, and ancient mathematics. Gann believed that stock market movements followed specific patterns and cycles, rather than being random. His methodologies, celebrated for their accuracy and relevance, con
Al in one level
Kundan Kumar Srivastava
User feedback : "This indicator is collection of important dynamic support and resistance giving a trader crystal clear idea , where to sell and where to buy. it completely complements trend lines, support, resistance, and sideways market and allow a trader to make sustainable profits. The thickness of lines suggests its strengths, the thicker the dynamic line, the stronger is rejection or pullback allowing a trader to make multi-fold profit, as they can clearly see them." Introducing Your Ult
Oni Scalper
Goh Cheng Wai
5 (2)
Dear Onis, This Indicator is used for   GBPUSD, US30 and GOLD on 1-Min Chart . For US30 , Depending on your broker, Minimum Lot Size will differ from 0.01 to 1.0 lots. My Current Account is trading at 1.0 lots at $1 per point . Please check with your Broker what's the Margin Required for your Minimum lot sizes before you trade on your Real account. I have Forward Tested the indicator for around 6 months before releasing it to the public. ( No Demo is available for the Indicator, Strategy
NOTE: PRICE WILL RISE VERY SOON. DON'T SKIP THIS OFFER! Dear traders I am glad to introduce the " Market Swing Scanner Board" indicator to you. This indicator was made mainly to be used in combination with the Market Swing Index Indicator. You use the  "Market Swing Scanner Board"  indicator to scan for trading opportunities on the  Market Swing Index Indicator . This tool is designed for serious traders who have decided to make a difference through trading. Be the next person to witness this st
Gann Swing Structure
Kirill Borovskii
5 (1)
This indicator is based on the mathematics of the great trader W.D. Ganna. With its help, you can easily find strong levels by analyzing swings to find the optimal entry point. The indicator works on all instruments and all timeframes. The indicator is fully manual and has control buttons. All you need to do is press the NEW button, a segment will appear, which you can place on any movement, swing or even 1 candle that you want to analyze. By placing the segment, press the OK button. A grid (th
The indicator of a Professional Trader is an arrow indicator for predicting the direction of price movement. I have been working on this indicator since 2014. You can use this indicator as your main indicator, use its entry signals, and use it as your only indicator to find entry points. About the product: Recommended TF [H4-D1-W1]   . The indicator predicts the direction of the next candle. Fits a variety of tools; Flexibility in settings for different instruments and intervals through the
Ticaret ve piyasa yönünü tahmin etmek için döngüsel gösterge. Fiyatın döngüsel davranışını osilatör biçiminde gösterir. Osilatörün üst ve alt sınırlarından bir geri dönüş olduğunda, işlem açılmasına yönelik sinyaller verir. Histogram biçiminde trendin yumuşatılmış gücünü gösterir.  Ölçeklendirmeden gün içi işlemlere kadar her türlü ticaret stratejisini tamamlayacak.  Gösterge yeniden çizilmez.  Tüm sembollerde/aletlerde kullanıma uygundur.  Kısa vadeli işlemler için uygun zaman dilimleri M5,
PZ Harmonacci Patterns
PZ TRADING SLU
3.43 (7)
Trade smarter, not harder: Empower your trading with Harmonacci Patterns Special Offer: Purchase now to receive free bonuses worth $165! (Read more for details) This is arguably the most complete harmonic price formation auto-recognition indicator you can find for the MetaTrader Platform. It detects 19 different patterns, takes fibonacci projections as seriously as you do, displays the Potential Reversal Zone (PRZ) and finds suitable stop-loss and take-profit levels. [ Installation Guide | Upda
Full Forex Market View Dashboard
Opengates Success International
5 (2)
TAM FOREX PİYASASI GÖRÜNÜMÜ Pano Göstergesi Bu, Yatırımcılara piyasada neler olup bittiğine dair tam bir görüş sağlamak için oluşturulmuş özel bir göstergedir. Piyasaya erişmek ve başarılı ticaret yapmak için gereken her türlü bilgiyi görüntülemek için gerçek zamanlı bir veri kullanır. KURULUM: Bu Göstergeyi pencere grafiğinize eklemeden önce, MT4'ünüzün Piyasa İzleme paneline gidin ve ihtiyaç duymadığınız veya ticaret yapmadığınız tüm Döviz çiftlerini GİZLEYİN ve geri kalanını orada bı
Gann Signal
Kirill Borovskii
Gann Signal is a very simple indicator at first glance, but hidden inside is many years of experience in studying W.D.Ganna methods. The indicator gives accurate BUY/SELL signals, without redrawing. The indicator is very easy to use. All you need to do is attach it to your chart and follow its recommendations. The indicator constantly analyzes the market for entry opportunities. When such an opportunity appears, the indicator gives a signal in the form of an arrow. I repeat, all signals are NOT
The Nihilist 5.0 Indicator includes Forexalien and Nihilist Easy Trend trading strategies and systems. It is composed of an MTF Dashboard where you can analyze the different input possibilities of each strategy at a glance. It has an alert system with different types of configurable filters. You can also configure which TF you want to be notified on your Metatrader 4 platform and Mobile application The indicator has the option to view how could be a TP and SL by using ATR or fixed points, even
Connect Indicator
Sukunthakan Ngernbamrung
Connect Indicator is a tool used for connecting indicators between the MQL market and MT4. The connected indicators are made by our group and can be used for other applications, such as sending messages to the Line application or Telegram application. If you have any questions, please don't hesitate to ask us to receive support. Function and indicator buffer Buffer one is the high price of the previous candle. Buffer two is the high price of the previous candle. Usage To connect indicators to fu
A. A2SR nedir ?   * Önde gelen bir teknik göstergedir (yeniden boyama yok, gecikme yok). -- Rehberlik : -- https://www.mql5.com/en/blogs/post/734748/page4#comment_16532516 adresinde -- ve https://www.mql5.com/en/users/yohana/blog A2SR, Destek (talep) ve Direnç (arz) seviyelerini belirlemede özel bir tekniğe sahiptir. İnternette gördüğümüz sıradan yoldan farklı olarak A2SR, gerçek SR seviyelerini belirlemede özgün bir konsepte sahiptir. Orijinal teknik internetten alınmadığı gibi internette
Moving pivot Average Fibonacci The  indicator compares the selected period with its counterpart from the previous period. The indicator determines the moving Fibonacci levels for the day or any time interval to assess the price movement range from the time average. The indicator helps predict the expected high or low for the day based on historical time data. The pivot line can be considered an average trend line and use it in a variety of trading strategies. If you have any question about t
Currently Price 20% OFF ( for unlimited use )   BONUS  AUX VIP Club 2024 : Include  EA Airbag  and  Load Data History  to enhance the performance of this tool to its maximum potential  Click Here to Download Files   ( for users only )   Hello World! Introducing.. SMCpro VIP tool and Indicator for MetaTrader 4, designed to revolutionize your trading experience with the ICT Smart Money Concept. This system is meticulously crafted to empower traders with advanced insights and precision in
Full STO
Roman Smoroda
Tam STO göstergesi (üç STO göstergesinin tüm sürümlerini içerir: Premium, Gold, Silver) - STABLE TRADE OPTION, otomatik ikili opsiyon ticareti için tasarlanmıştır.  DİKKATLİCE OKUYUN!!!!! ÖNEMLİ Bir terminalde farklı sürelere sahip iki şablon oluşturun: 18:01, 18:02 için 1 ila 15 dakika arasında süreleri olan bir şablon ve 22:00 için 10 ila 20 dakika arasında süreleri olan bir şablon. Kazanma oranı: Son 5 yılda %71 Para yönetimi: Mevduattan %0,3 Göstergenin bu sürümü yalnızca Gümüş ve
Yazarın diğer ürünleri
Gann Kare Göstergesi, W.D. Gann tarafından yazılan "Piyasa Tahminleri için Matematiksel Formül" makalesine dayalı güçlü bir piyasa analizi aracıdır. Bu araç, piyasa analizi için matematiksel ve Gann teorilerini kullanarak hassas analizler gerçekleştirir. 144, 90, 52 karelerini ve ayrıca 9 karesini kullanır. Ayrıca, 'ın 9 karesi ve bu kareyle ilişkili kanallar ve yıldız modelleri için yöntemini içerir. Kullanıcı Kılavuzu ve Uygulama: Bu göstergeleri kullanmadan önce, kullanıcı kılavuzunu okumanız
Sizlere ON Trade Waves Patterns Harmonic Elliot Wolfe'u tanıtmaktan mutluluk duyarız. Bu, manuel ve otomatik yöntemleri kullanarak piyasada çeşitli desenleri tespit etmek için tasarlanmış gelişmiş bir göstergedir. İşte nasıl çalıştığı: Harmonik Desenler: Bu gösterge, grafiğinizde görünen harmonik desenleri tanımlayabilir. Bu desenler, Scott Carney'in "Harmonic Trading vol 1 & 2" adlı kitabında açıklandığı gibi harmonik ticaret teorisini uygulayan tüccarlar için önemlidir. Onları manuel olarak ç
Shepherd Harmonic Pattern
Abdullah Alrai
4.68 (59)
Bu gösterge, manuel ve otomatik yöntemlerle çizilen harmonik desenleri algılar. Kullanım kılavuzuna şu bağlantıdan erişebilirsiniz: İncelemenizi ekleyin ve ürünü almak için bizimle iletişime geçin. Bu ürünü mt4'te denemek için ücretsiz bir sürümü vardır. Gartley ve Nenstar desenlerini algılamak için kullanabilirsiniz: https://www.mql5.com/en/market/product/30181 Tam MT4 sürümünü şuradan satın alabilirsiniz: https://www.mql5.com/en/market/product/15212 Notlar Gösterge kontrol paneline sahiptir ve
Bu gösterge, Elliott dalga teorisi ile iki şekilde çalışır: Otomatik Çalışma: Bu modda gösterge, Elliott dalga teorisine uygun olarak grafikteki beş hareket dalgasını otomatik olarak tespit edecek ve tahminlerde bulunacak, potansiyel ters dönüş bölgelerini belirleyecektir. Ayrıca, önemli gelişmeler hakkında tüccarları uyarılar ve bildirimlerle bilgilendirebilme yeteneğine sahiptir. Bu otomatik işlev, Elliott dalga desenlerinin tanımlanması ve analiz sürecini basit hale getirir. Manuel Çalışma: B
ON Trade Pivoteer
Abdullah Alrai
4 (1)
Introducing the Pivot Point Selector Indicator: Your Ultimate Tool for Custom Pivot Levels Are you ready to take your trading to the next level? Say hello to the Pivot Point Selector Indicator, a game-changing tool that puts you in control of your pivot levels. This innovative indicator empowers you to choose three specific points that will determine the pivot level calculations, giving you unparalleled customization and precision in your trading strategy. Key Features and Benefits: Custom Pivo
FREE
This indicator will detect harmonic patterns that are drawn on the chart by manual and automatic methods. You can see user manual from this link: https://www.mql5.com/en/blogs/post/719257 There is a free version (it detect only Gartley and Nenstar Patterns) to try this product. You can buy the full MT4 version from: https://www.mql5.com/en/market/product/104689 Notes When you use this indicator and change the settings, add indicators like Moving Average or Bollinger Bands, this indicator will
FREE
Bu gösterge, W.D. Gann'ın dokuzun karesi ve 144'ün karesine bağlı olarak yazdığı "Piyasa tahminleri için matematiksel formül" makalesine dayanan bir piyasa analiz yöntemidir. Kullanım kılavuzu: Add Your review And contact us to get it Tam MT5 Sürümünü Şunlardan Satın Alabilirsiniz: https://www.mql5.com/en/market/product/28669 MT4'te ücretsiz olarak test edebilirsiniz: https://www.mql5.com/en/market/product/15316 Bu ürün sizin için Düzeyler / Yıldız / Izgara / Gann hayranları
FREE
Hikkake Japon Şamdan Deseni, grafikte oluşan Hikkake Fiyat Hareket Desenlerini belirlemek ve tespit etmek üzere tasarlanmış özel bir göstergedir. Bu desenler, genellikle potansiyel ticaret fırsatlarına yol açan bir iç çubukta sahte bir dışarı çıkma kavramına dayanır. Göstergenin temel işlevi, grafiğin son beş şamdanını analiz etmek ve bu şamdanların Hikkake deseninin özelliklerini sergileyip sergilemediğini belirlemektir. Bu desen onaylandığında, gösterge deseni oluşturan şamdanların etrafına bi
This indicator offers a comprehensive and efficient solution for traders seeking optimal entries in scalping strategies. Leveraging moving averages and stochastic indicators, it employs a systematic approach to identify favorable trade opportunities. The indicator goes beyond mere analysis, actively drawing clear and actionable entry points on your chart, denoted by arrows. Moreover, it provides the convenience of alerts to ensure you never miss these potential setups. Key Features and Benefits:
FREE
ON Trade Marubozu Mum Modeli Göstergesi Marubozu mum modeli, piyasa duyarlılığını ve potansiyel trend dönüşlerini değerli bilgilerle sunabilen güçlü ve açık bir mum modelidir. Bu model, uçlarından birinde çok küçük veya hiç gölge (fitil) bulunmayan ve baskın trendin yönünde uzanan uzun bir gövdeye sahip bir mumla karakterizedir. Bu model, alıcılar ve satıcılar arasında güçlü bir dengesizliği temsil eder ve piyasada momentumun güçlü bir şekilde tek taraflı olduğunu gösterir. Özellikler ve Faydala
FREE
Altın Gram Fiyatı Hesaplayıcı Gösterge Tanıtımı Yerel para biriminizdeki altın fiyatını sürekli olarak takip etmek istiyor musunuz? Daha fazla aramayın, Altın Gram Fiyatı Hesaplayıcı Gösterge, tercih ettiğiniz yerel para biriminde gerçek zamanlı olarak gram başına altın fiyatını hesaplamanıza olanak sağlayan yenilikçi bir araç sunar. Bu gösterge ile finansal bilgileri kullanarak bilinçli kararlar alabilirsiniz. Ana Özellikler: Yerelleştirilmiş Altın Fiyatı: Altın Gram Fiyatı Hesaplayıcı Gösterge
FREE
ON Trade Pivots is A technical indicator that Draws all Pivot levels depending on time frame that defined in settings. Notes It will be good tool for all traders who use pivot levels in their trades. Let me inform you that this indicator draw this level as buffers not as objects then you can connect it easily to EA. This indicator allow you to find pivots levels for any time frame not only daily you are free to choose time frame from settings. Parameters Use_System_Visuals - Enable /Disable
FREE
Bu gösterge, ticaret grafiğinizde Donchian kanalını görsel olarak temsil etme amacını taşır. Donchian kanalı, belirli bir dönemde en yüksek yüksek ve en düşük düşük arasındaki aralığı gösteren basit bir teknik araçtır. Bu gösterge, fiyat hareketlerinin görsel analizini geliştirerek potansiyel kırılma ve trend devam noktalarına dair anlayış sunar. Donchian kanalı, bu seçeneği etkinleştirmeyi tercih ederseniz hem geçerli zaman dilimine hem de daha yüksek bir zaman dilimine uygulanabilir. Gösterge
FREE
"Bu gösterge basit bir eğilim tespit aracıdır. Skalping modu gibi iyi girişlere sahip olmak için stratejinizle birlikte kullanabilirsiniz. Fiyatın etrafında bir kanal çizecektir ve zaman arttıkça genişleyecektir; özel dönemlerde algoritma çalışma süresi ve fiyatı bir araya getirerek artış noktasının başlangıcına dönecektir. Ters dönüş işaretleri göründükten sonra kanalın en düşük sınırından satın alabilirsiniz. Ve ters dönüş işaretlerini gördükten sonra en yüksek kanal sınırından satabilirsiniz
Rsi Channel
Abdullah Alrai
5 (1)
This indicator displays the channel of Relative Strength Index. When you see that the price touches the red line and retreats from it many times, then you will know that the general trend is down. When it retreats from the blue line many times, that means that the general trend is up. This lines express the RSI values attributed to the price values on the main chart. You can add this indicator to your strategy, it will help you. This indicator will work best on 5 minutes and higher time frames.
Bu araç sayesinde grafiklerinizde regresyon kanalını kontrol etme yeteneği elde edersiniz. Kanal seviyelerini, destek ve direnç seviyelerini sağlayacaktır. Ayrıca düzeltme dalgası seviyelerini sunar. Ayrıca, dolum ve ışın seçenekleri gibi kanalı doğrudan kontrol etme imkanını sağlayan bir kontrol paneli üzerinden kanalı yönetebilirsiniz. Ayrıca, farklı çiftlerle işlem yaparken daha iyi bir görünüm elde etmek için daha yüksek zaman dilimlerinden veri yükleyebilirsiniz. Nasıl Kullanılır: Trend Çiz
Güçlü Forex göstergemizi sizlere sunuyoruz. Bu gösterge, ticaret stratejinizi geliştirmeniz ve size piyasa trendleri hakkında kesin bilgiler sağlamanız için tasarlanmıştır. Bu yenilikçi araç, mum ölçümlerini ayrıntılı bir şekilde analiz eden ve en iyi hassasiyeti elde etmek için ayarlamalar yapan sofistike bir özel algoritma kullanır. Sonuç? Grafiğinizde stratejik giriş noktalarını gösteren dikkatlice çizilmiş bir ok takımı. Bu göstergenin arkasındaki dahilik, mum desenlerinin gücünden faydalanm
"Bu gösterge, Bystra deseni teorisine dayalı olarak girişleri tespit eder ve hedef ve durma seviyeleri ile sınırlı emirleri yerleştirmek için giriş değerlerini sağlar. Bu, risk yüzdesini hesaplamanıza olanak tanır. Notlar: Bu gösterge, Uzman Danışmanlar (EA) içinde kullanım için tamponlara sahiptir. Bu ürünle çalışırken iyi bir para yönetimi uygulamanız önemlidir. Zaman diliminizi değiştirdiğinizde, Gösterge, son oturumunuzda kullanılan şablonu kaydedecektir. Bu yöntemi öğrenmek için bir kitaba
"Fibo Star" göstergesi, Fibonacci Fanlarını yıldız şeklinde grafik üzerine çizmek için tasarlanmıştır. Bu Fibonacci Fanları, fiyat hareketlerini analiz etmek için güçlü bir araçtır ve potansiyel destek ve direnç seviyeleri hakkında görüşler sunabilir. Bu gösterge, çizim ve yapılandırma sürecini kolaylaştırmayı amaçlayan kullanıcı dostu bir kontrol paneli ile donatılmıştır, böylece zaman ve çaba tasarrufu sağlar. Kullanım Talimatları: Bu gösterge manuel kullanım içindir. Etkili bir şekilde kullan
"Para Birimi Gücü" göstergesi, forex piyasasındaki farklı para birimlerinin göreceli gücünü sağlamak amacıyla tasarlanmış güçlü bir araçtır. Her bir para biriminin belirtilen zaman dilimine göre gücünü hesaplayarak ve temsil ederek, bu gösterge, trader'lara potansiyel işlem fırsatlarını tanımlama imkanı sunar, özellikle belirgin ayrışmalar veya kesişmeler gözlendiğinde. Gösterge Ana Özellikleri: 1. Para Birimi Gücü Hesaplama: Gösterge, her bir para biriminin belirtilen zaman dilimine göre gücünü
Güçlü Fiyat Hareketi Desenlerini Algılayan Teknik Gösterge: Pin Bar, Inside Bar ve Outside Bar Giriş: Teknik analizin alanında, fiyat hareketi desenleri potansiyel piyasa hareketlerinin önemli göstergeleri olarak işlev görür. Grafiklerde sağlam fiyat hareketi desenlerini tanımlamanın kolaylaştırıldığı sofistike bir teknik gösterge geliştirdik. Göstergemiz, üç temel deseni tanıma konusunda uzmanlaşmıştır: Pin Bar, Inside Bar ve Outside Bar. Ana Desenlerin Algılanması: Pin Bar: Pin Bar deseni, piy
Unlock Hidden Insights with the Numerokh Indicator: Your Numerology-Based Support and Resistance Tool Introducing the Numerokh indicator, a revolutionary tool that brings the mystical world of numerology into the realm of trading. Imagine having the power to identify key support and resistance levels on your charts using the age-old wisdom of numerology. This indicator takes trading to a new dimension, offering you a unique way to analyze price movements and make informed trading decisions. Key
Shepherd Numeroloji Seviye Göstergesi ile ticarette devrim yaratan bir yaklaşımı keşfedin. Bu yenilikçi araç, geleneksel ticaret tekniklerini antik numeroloji bilgisiyle birleştirerek grafiklerinizdeki önemli destek ve direnç seviyelerini belirlemenize yardımcı olur. Dokuzun karesi yöntemini kullanarak bu gösterge, piyasa mekanizmalarına farklı bir bakış açısı sunar ve daha bilinçli ticaret kararları almanıza olanak tanır. Ana Özellikler ve Avantajlar: Numeroloji ve Dokuzun Karesi: Shepherd Nume
Conclusioni: L'Indicatore ON Trade Numerology Mirror introduce una nuova prospettiva nell'analisi delle inversioni di prezzo integrando la saggezza antica della numerologia. Decifrando i modelli invertiti delle sequenze di numeri, ottieni una prospettiva unica sulle possibili inversioni di prezzo. Poiché il successo nel trading dipende da molti fattori, considera questo indicatore come parte integrante della tua strategia di trading globale. [Avviso: Il trading comporta rischi, e l'indicatore d
Maravilla Square Göstergesi Tanıtımı: Öngörülü İşlem İçin Yardımcınız Maravilla Square göstergesini keşfedin: Öngörülü işlem için anahtarınız. Bu eşsiz araç, fiyat tersine dönmeleri hakkında içgörü sunar ve yüksek ve düşük noktalar arasında ayarlanabilir bir eğilim çizgisi sunar. Trend Çizgisi Dinamiği: Maravilla Square göstergesi, grafiğin yüksek ve düşük noktalarına uyum sağlayabileceğiniz bir trend çizgisi sunar. Bu dinamik özellik, gösterge ile fiyat hareketleri arasında doğrudan bir bağlan
Introducing the ON Trade Melad Pattern Indicator: Enhance Your Trading Strategy with Breakout Patterns Discover the power of the ON Trade Melad Pattern Indicator—an intuitive tool designed to elevate your trading decisions by detecting and highlighting breakout patterns on your charts. This indicator is your key to identifying crucial breakout points and potential trend shifts with simplicity and precision. Key Features: Breakout Pattern Detection: The ON Trade Melad Pattern Indicator foc
This indicator will give you entries as result of scalping strategy that will be applied on 14 symbols in same time and you are able to be notified with this entries  Note :   This indicator for scalping on 5 minutes timeframe only . How to use it : 1-Open chart and adjust settings (edit symbols names as your platform names , activate the alert system if you need it . 2-Wait for any signal you have it from this scanner you will have it as alert and as notification and you will see it on bo
This indicator gives you the signal of real cross on stochastic indicator. This indicator is easy to attach to an ea. This indicator will work best on All time frames. Arrow appears depending on many algorithms that study the cross parameters. Indicator properties Use_System_Visuals: enable/disable visual styles. Stochastic_K_Period. Stochastic_D_Period. Stochastic_Slowing. Use_Notifications: enable/disable Push Notifications. Use_Alert: enable/disable Alerts. Use_E_Mail: enable/disable Email
ON Trade Volaty'yi Tanıtıyoruz: Karlı Volatilite Kopma Çözümünüz ON Trade Volaty Göstergesi ile ticaret fırsatlarını kilitleyin. Gelişmiş volatilite analizi kullanarak kopma bölgelerini belirler, işlemlerinizi hassaslıkla yönlendirir. Stratejik giriş ve hedef noktalarıyla fiyat hareketlerini yakalayın, tümü ticaret tarzınıza uygun olarak düzenlenmiştir. Temel Özellikler: Gelişmiş Volatilite Analizi Stratejik Giriş Noktaları Dinamik Hedefleme Özelleştirilebilir Parametreler Uzman Danışman (EA) Uy
Tanıtıyoruz: "ON Trade VSA" - Hacim ve Dağılım Analizi için Ultimate Araç! Gücünü, hacim ve dağılım analizinin (VSA) öncü göstergesi "ON Trade VSA" ile keşfedin. VSA, piyasa gücünü değerlendirmek, trendleri tanımlamak ve bilinçli kararlar almak için trader'lar tarafından kullanılan güçlü bir metodolojidir. Şimdi "ON Trade VSA"yı, ticaret cephaneliğinizde vazgeçilmez bir araç haline getiren temel özelliklere göz atalım: Çok Renkli Hacim Mumları : Ortalama harekete dayalı olarak farklı renkler ata
Filtrele:
mzakiraden
261
mzakiraden 2024.04.18 02:00 
 

Works as expected. Beautifully coded! Zero issues.

Abdullah Alrai
42098
Geliştiriciden yanıt Abdullah Alrai 2024.05.17 01:32
thanks for your review mr
ILYES123
328
ILYES123 2024.02.02 03:14 
 

great job and good indicator , and thank you Sir Abdullah for Support

Abdullah Alrai
42098
Geliştiriciden yanıt Abdullah Alrai 2024.02.02 03:15
Thanks
Vince13
130
Vince13 2024.01.22 15:15 
 

Kullanıcı incelemeye herhangi bir yorum bırakmadı

Abdullah Alrai
42098
Geliştiriciden yanıt Abdullah Alrai 2024.01.22 15:18
thanks
ahmed nabil
23
ahmed nabil 2023.09.29 14:15 
 

good one

Abdullah Alrai
42098
Geliştiriciden yanıt Abdullah Alrai 2023.09.29 14:19
Thanks
rumbacillo
24
rumbacillo 2023.09.20 09:34 
 

This indicator is priceless and provides solid guidance to trade every symbol. Thanks for coding it

Abdullah Alrai
42098
Geliştiriciden yanıt Abdullah Alrai 2023.09.20 09:35
Thank you mr for your kind words
fligods
288
fligods 2023.09.12 20:54 
 

Kullanıcı incelemeye herhangi bir yorum bırakmadı

Abdullah Alrai
42098
Geliştiriciden yanıt Abdullah Alrai 2023.09.12 20:55
Thank you sir
SALAH198889
16
SALAH198889 2023.09.06 12:52 
 

Kullanıcı incelemeye herhangi bir yorum bırakmadı

Abdullah Alrai
42098
Geliştiriciden yanıt Abdullah Alrai 2023.09.06 12:57
Thank you mr Salah for your kind words
İncelemeye yanıt
Sürüm 3.6 2024.05.17
-Improvements
Sürüm 3.5 2024.05.17
- Added Planetary Fans !
Sürüm 3.1 2024.05.09
-Powerful Improvements .
Sürüm 1.2 2024.04.06
- Bug Fix .
Sürüm 1.1 2023.10.21
- improvements