• Genel bakış
  • İncelemeler
  • Yorumlar

ON Trade Forex Strength Meter

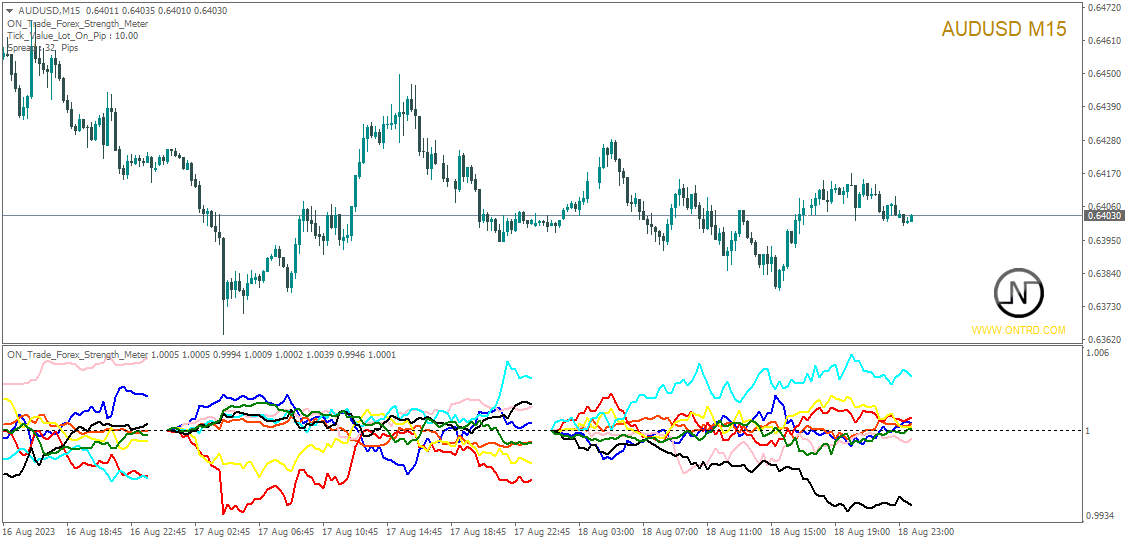
"Para Birimi Gücü" göstergesi, forex piyasasındaki farklı para birimlerinin göreceli gücünü sağlamak amacıyla tasarlanmış güçlü bir araçtır. Her bir para biriminin belirtilen zaman dilimine göre gücünü hesaplayarak ve temsil ederek, bu gösterge, trader'lara potansiyel işlem fırsatlarını tanımlama imkanı sunar, özellikle belirgin ayrışmalar veya kesişmeler gözlendiğinde.

Gösterge Ana Özellikleri:

1. Para Birimi Gücü Hesaplama: Gösterge, her bir para biriminin belirtilen zaman dilimine göre gücünü hesaplar. Bu hesaplama, belirtilen süre zarfında bir para biriminin performansını diğer bir dizi para birimine karşı değerlendirmeyi içerir. Bu, trader'ların her bir para biriminin göreceli gücünü veya zayıflığını anlamalarına yardımcı olur.

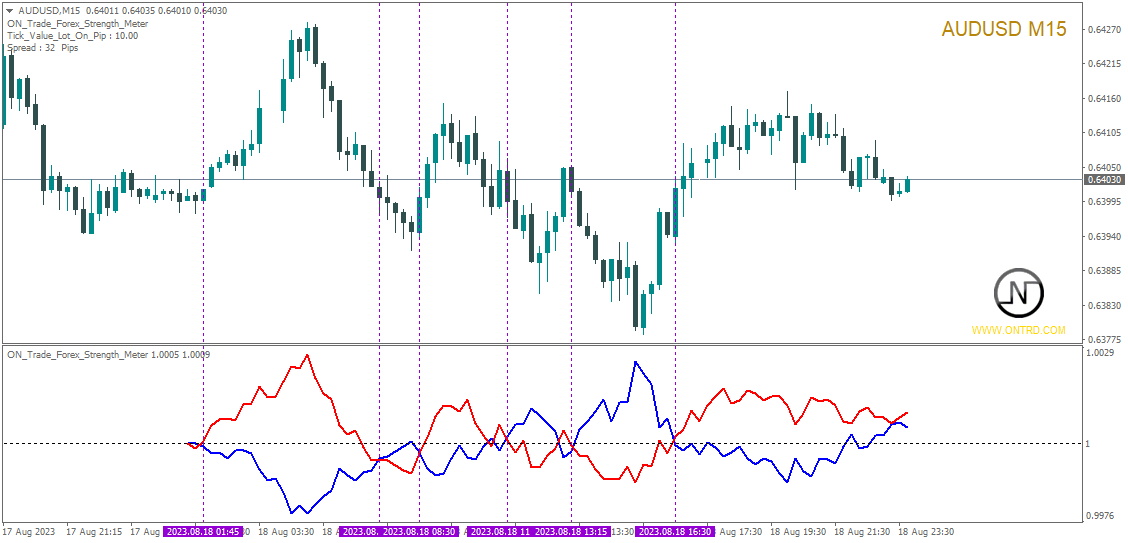
2. Sıkışma ve Ayrışma: İki para biriminin güçleri arasında sıkışma veya ayrışma olduğunda, bu potansiyel işlem fırsatlarını gösterir. Örneğin, bir para birimi belirgin bir şekilde güçlenirken diğer bir para birimi zayıflarsa, bu potansiyel bir giriş noktası gösterebilir.

3. Sıfır Seviyesi Kesişimi: Gösterge ayrıca bir para biriminin gücünün sıfır seviyesini kesip kesmediğini de belirler. Sıfırı geçmek yükseliş eğilimini, sıfırın altına geçmek düşüş eğilimini gösterebilir. Bu kesişmeler, işlem kararlarını doğrulamak için ek bir onay olarak kullanılabilir.

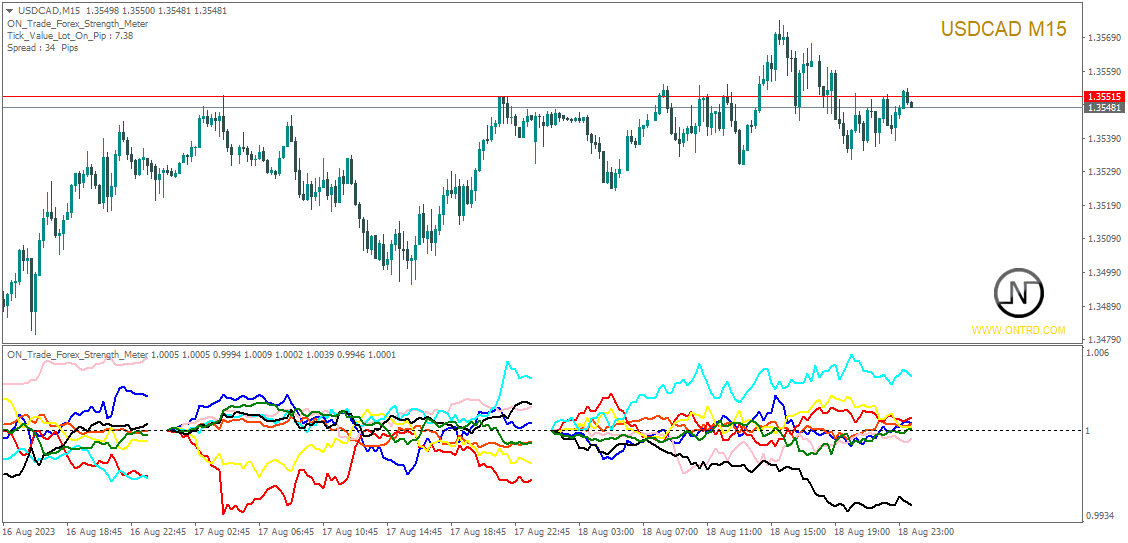
4. Kişiselleştirilebilir Görüntüleme: Trader'lar grafiklerinde hangi para birimi güçlerini göstermek istediklerini seçme esnekliğine sahiptir. Gösterge, USD, EUR, GBP, AUD, NZD, JPY, CHF ve CAD gibi belirli para birimleri için gücün görüntülenip görüntülenmeyeceğini etkinleştirmenizi veya devre dışı bırakmanızı sağlar.

5. Güç Zaman Aralığı: "Strength Type" parametresi trader'lara para birimi gücünün hesaplanacağı zaman aralığını seçme imkanı sunar. Bu özelleştirme, farklı trader'ların strateji ve ticaret tercihlerine göre farklı zaman aralıkları tercih etmeleri nedeniyle önemlidir.

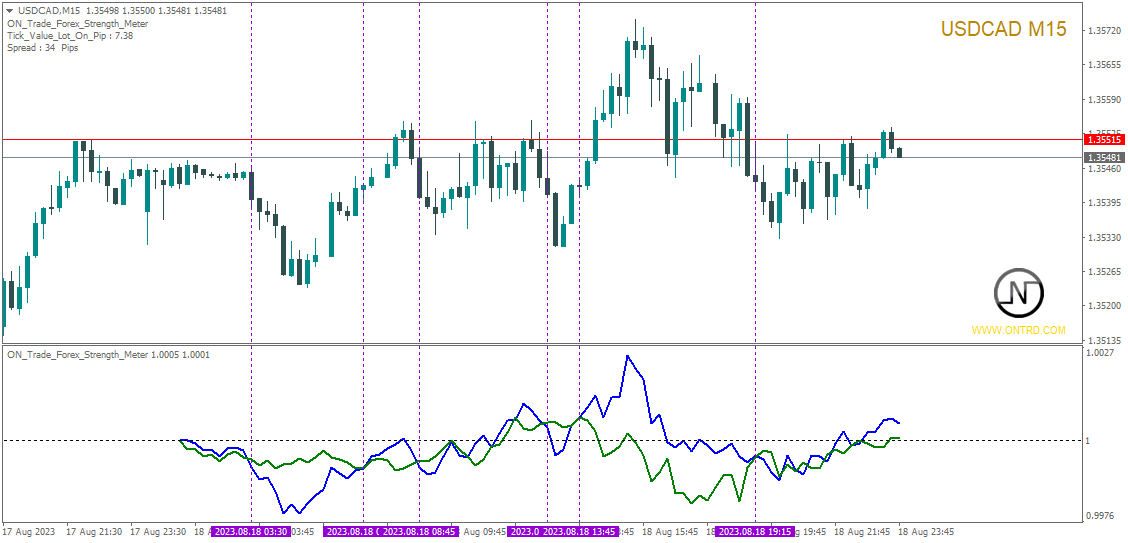
6. Sadece Geçerli Çifti Göster: "Show Current Only" parametresi, sadece şu anda analiz edilen para birimi çiftinin gücünü göstermeyi etkinleştirip devre dışı bırakmanıza olanak tanır. Bu özellik, ilgili olduğu belirli para birimi çiftlerine odaklanmaya yardımcı olabilir.

7. Geçmiş Veri Analizi: Trader'lar "Bars Limit" parametresini kullanarak geçmiş verileri analiz edebilirler. Bu parametre, göstergenin güç çizgilerinin grafik üzerine ne kadar geriye çekileceğini belirler. Geçmiş veri analizi, trader'ların zaman içinde trendleri ve desenleri belirlemelerine yardımcı olabilir.

Kullanım ve Düşünülmesi Gerekenler:

  • Göstergenin sağladığı para birimi gücü bilgileri, diğer teknik ve temel analiz araçları ile birleştirilerek genel bir ticaret stratejisinin bir parçası olarak kullanılabilir.
  • Para birimi güçleri arasında sıkışma veya ayrışma, potansiyel trend ters dönüş noktalarını veya devam noktalarını gösterebilir.
  • Sıfır seviyesini geçme veya altına düşme, potansiyel trendleri veya dönüşleri doğrulamak için trader'lara yardımcı olabilir.
  • Trader'lar para birimi gücü için farklı zaman aralıkları deneyerek kendi tarzlarına ve ticaret stratejilerine uyarlamayı deneyebilirler.
  • Herhangi bir gösterge veya ticaret stratejisi kullanımında sorumlu risk yönetimi uygulanmalıdır.

Tıpkı herhangi bir ticaret aracında olduğu gibi, trader'lar göstergenin nasıl çalıştığını anlayarak, tarihsel verilerle pratik yaparak ve farklı yapılandırmaları deneyerek kullanma konusunda güven kazanabilirler. Ayrıca başarılı ticaret kararları almak için mevcut piyasa koşullarını takip etmek ve gerçek zamanlı faktörleri dikkate almak da önemlidir.


Önerilen ürünler
VR Cub
Vladimir Pastushak
VR Cub , yüksek kaliteli giriş noktaları elde etmenin bir göstergesidir. Gösterge, matematiksel hesaplamaları kolaylaştırmak ve bir pozisyona giriş noktalarının aranmasını basitleştirmek için geliştirildi. Göstergenin yazıldığı ticaret stratejisi uzun yıllardan beri etkinliğini kanıtlamaktadır. Ticaret stratejisinin basitliği, acemi yatırımcıların bile başarılı bir şekilde ticaret yapmasına olanak tanıyan büyük avantajıdır. VR Cub, pozisyon açılış noktalarını ve Kâr Al ve Zararı Durdur hedef sev
KT Renko Patterns MT4
KEENBASE SOFTWARE SOLUTIONS
2.33 (3)
KT Renko Patterns scans the Renko chart brick by brick to find some famous chart patterns that are frequently used by traders across the various financial markets. Compared to the time-based charts, patterns based trading is easier and more evident on Renko charts due to their uncluttered appearance. KT Renko Patterns features multiple Renko patterns, and many of these patterns are extensively explained in the book titled Profitable Trading with Renko Charts by Prashant Shah. A 100% automate
Noize Absorption Index MT4
Ekaterina Saltykova
5 (1)
Noize Absorption Index - is the manual trading system that measures the difference of pressure between bears forces and bulls forces. Green line - is a noize free index that showing curent situation. Zero value of index shows totally choppy/flat market.Values above zero level shows how powerfull bullish wave is and values below zero measures bearish forces.Up arrow appears on bearish market when it's ready to reverse, dn arrow appears on weak bullish market, as a result of reverse expectation. S
PZ Support Resistance
PZ TRADING SLU
3.33 (3)
Unlock key market insights with automated support and resistance lines Special Offer: Purchase now to receive free bonuses worth $89! (Read more for details) Tired of plotting support and resistance lines? This is a multi-timeframe indicator that detects and plots supports and resistance lines in the chart with the same precision as a human eye would. As price levels are tested over time and its importance increases, the lines become thicker and darker, making price leves easy to glance and ev
Bu, bir mumun kapanış fiyatını tahmin eden bir göstergedir. Gösterge öncelikle D1 çizelgelerinde kullanılmak üzere tasarlanmıştır. Bu gösterge hem geleneksel forex ticareti hem de ikili opsiyon ticareti için uygundur. Gösterge, bağımsız bir ticaret sistemi olarak kullanılabilir veya mevcut ticaret sisteminize ek olarak hareket edebilir. Bu gösterge, mevcut mumu analiz ederek mumun gövdesi içindeki belirli güç faktörlerini ve önceki mumun parametrelerini hesaplar. Böylece gösterge, piyasa hareket
Fibonacci retracement and extension line drawing tool Fibonacci retracement and extended line drawing tool for MT4 platform is suitable for traders who use  golden section trading Advantages: There is no extra line, no too long line, and it is easy to observe and find trading opportunities Trial version: https://www.mql5.com/zh/market/product/35884 Main functions: 1. Multiple groups of Fibonacci turns can be drawn directly, and the relationship between important turning points
TWO PAIRS SQUARE HEDGE METER INDICATOR Try this brilliant 2 pairs square indicator It draws a square wave of the relation between your two inputs symbols when square wave indicates -1 then it is very great opportunity to SELL pair1 and BUY Pair2 when square wave indicates +1 then it is very great opportunity to BUY pair1 and SELL Pair2 the inputs are : 2 pairs of symbols         then index value : i use 20 for M30 charts ( you can try other values : 40/50 for M15 , : 30 for M30 , : 10 for H1 ,
The Th3Eng PipFinite indicator is based on a very excellent analysis of the right trend direction with perfect custom algorithms. It show the true direction and the best point to start trading. With StopLoss point and Three Take Profit points. Also it show the right pivot of the price and small points to order to replace the dynamic support and resistance channel, Which surrounds the price. And Finally it draws a very helpful Box on the left side on the chart includes (take profits and Stop loss
Trendiness Index
Libertas LLC
5 (3)
"The trend is your friend" is one of the best known sayings in investing, because capturing large trendy price movements can be extremely profitable. However, trading with the trend is often easier said than done, because many indicators are based on price reversals not trends. These aren't very effective at identifying trendy periods, or predicting whether trends will continue. We developed the Trendiness Index to help address this problem by indicating the strength and direction of price trend
Trade with Gann on your side!! MASTER CIRCLE 360 CIRCLE CHART, originally created by Gann admitted that this is “The Mother of all charts”. It is one of the last studies that this great trader left for us. The numeric tab le is apparently quite simple like all the tables and is based on square numbers, the SQUARE OF 12 and is by evolution, one of the most important square numbers. Here we can find CYCLE, PRICE AND TIME thanks to angles and grades, to show past and future support and resistance.
Classic Fractals indicator for MT4, with additional Trendlines connecting the latest couples of fractals ( fractals are showing highest high, and lowest low on each period) Rules for trendlines: -if new top fractal is below the last one = new resistance line -if new bot fractal is above the last one = new support line -Trendlines can be hidden -Fractals can be hidden Fractal Period = can be both even or uneven number, as it is setting for half (one side) of the bars sequence
Reversal Pattern Pro
Boonyapagorn Rodvattanajinda
Reversal Patterns Pro Reversal Patterns Pro is a Price Action (PA) analytical tool that scans the reversal patterns.  - Finds and marks the most dependable Japanese candlestick patterns in real-time. - Supports all time frames (Best for Scalping) - Doesn't repaint making it an exceptional indicator for Expert Advisors. Input parameters : - Support & Resistance Mode ( true or false ) for enabling advanced filtering - Donchian Period - RSI Period - RSI Oversold Level - RSI Overbought Level - 
Blahtech Market Profile
Blahtech Limited
4.61 (18)
Was: $249  Now: $99   Market Profile defines a number of day types that can help the trader to determine market behaviour. A key feature is the Value Area, representing the range of price action where 70% of trading took place. Understanding the Value Area can give traders valuable insight into market direction and establish the higher odds trade. It is an excellent addition to any system you may be using. Blahtech Limited presents their Market Profile indicator for the MetaTrader community. Ins
Atomic Analyst
Issam Kassas
5 (3)
Öncelikle belirtmek gerekir ki bu Ticaret Göstergesi Yeniden Çizim Yapmaz, Gecikmez ve Gecikme Göstermez, bu da hem manuel hem de robot ticareti için ideal hale getirir. Kullanıcı kılavuzu: ayarlar, girişler ve strateji. Atom Analisti, Piyasada Daha İyi Bir Avantaj Bulmak İçin Fiyatın Gücünü ve Momentumunu Kullanan PA Fiyat Hareketi Göstergesidir. Gürültüleri ve Yanlış Sinyalleri Kaldırmaya ve Ticaret Potansiyelini Artırmaya Yardımcı Olan Gelişmiş Filtrelerle Donatılmıştır. Birden fazla katma
The Penta-O is a 6-point retracement harmonacci pattern which usually precedes big market movements. Penta-O patterns can expand and repaint quite a bit. To make things easier this indicator implements a twist: it waits for a donchian breakout in the right direction before signaling the trade. The end result is an otherwise repainting indicator with a very reliable trading signal. The donchian breakout period is entered as an input. [ Installation Guide | Update Guide | Troubleshooting | FAQ | A
Title : Market Bias Indicator - Oscillator-Based Trading Tool Introduction : Discover the potential of the "Market Bias Indicator," a revolutionary oscillator-based trading tool designed for precise market analysis. If you're in search of a robust alternative to traditional bias indicators, your quest ends here. Market Bias Indicator offers unparalleled accuracy in identifying market sentiment and is your gateway to confident trading decisions. Recommended Trading Pairs : Market Bias Indicator i
Monster Harmonic Indicator
Paul Geirnaerdt
4.61 (31)
Monster Harmonics Indicator is a harmonic pattern indicator. It recognizes Gartley, Bat, Crab, Butterfly, Cypher, White Swan, Black Swan, Shark and several other patterns. Projected patterns that are not yet completed are recognized, too. Monster even shows the PRZ (Potential Reversal Zone). Users can add their own user defined patterns to Monster. Besides the current pattern, Monster also shows all patterns in the symbols history. Monster will provide alerts for developing patterns. Introduced
Trend Line Map Pro
STE S.S.COMPANY
4.5 (16)
Trend Line Map indicator is an addons for Trend Screener Indicator . It's working as a scanner for all signals generated by Trend screener ( Trend Line Signals ) . It's a Trend Line Scanner based on Trend Screener Indicator.  If you don't have Trend Screener Pro Indicator, the Trend Line Map Pro will not work. LIMITED TIME OFFER : Trend Line Map Indicator is available for only 50 $ and lifetime. ( Original price 125$ ) By accessing to our MQL5 Blog,  you can find all our premium indicators w
This product is a part of  ON Trade Waves Patterns Harmonic Elliot Wolfe you can test free version on EURJPY from this link  Wolf Waves Indicator Kurt Dalgalarını Keşfedin - En İyi Ticaret Aracınız! Herhangi bir zaman diliminde Kurt Dalgalarını kolayca tespit etmek için güçlü bir araç mı arıyorsunuz? Daha fazla aramayın! Kurt Dalgaları göstergemiz bu işi zahmetsizce halleder. İşte neden sizin için mükemmel olduğunu anlatıyoruz: Ana Özellikler: Otomatik Algılama:   Kurt Dalgaları göstergemiz
YK-Fibo Pivot Indicator: Trade Smarter with Fibonacci Pivot Points The YK-Fibo Pivot Indicator is a powerful technical analysis tool that combines the precision of Fibonacci retracements with the insights of Pivot Points. Whether you're a novice or seasoned trader, this indicator empowers you to spot profitable opportunities in the market with ease. Why Choose YK-Fibo Pivot? Pinpoint Support & Resistance: By calculating Fibonacci levels based on the previous day's high, low, and close prices, y
Forex Indicator  " Morning  Star  pattern" for MT4 Indicator "Morning Star pattern" is a very powerful indicator for Price Action trading:    No repaint, No delays; Indicator   detects bullish Morning Star patterns on chart:  Blue arrow signal on chart (see pictures) P C, Mobile & Email alerts   are included Also its brother - bearish  " Evening Star pattern" indicator is available (follow the links below) Indicator  " Morning Star pattern"  is excellent to   combine with Support/Resistance Leve
For this set of indicators 1. General information     - Calculates with high performance mathematical algorithms.     - Calculated from the price of candles     - The entry point of this order is filtered by the train EMA and the oscillator.     - Calculate the integrity of the candle 2. How does it work?     - You can see two types of order entry points: the notification on the monitor and the arrow.     - You can trust 75-95 percent of this entry point. 3. Settings     - Retracement is re
Master Scalping M1 , trendi hızlı ve doğru bir şekilde belirlemek için bir algoritma kullanan yenilikçi bir göstergedir. Gösterge, pozisyonların açılış ve kapanış zamanını hesaplar, gösterge algoritmaları, bir ticarete girmek (bir varlık satın almak veya satmak) için ideal anları bulmanızı sağlar, bu da çoğu tüccar için işlemlerin başarısını artırır. Göstergenin faydaları: Kullanımı kolaydır, çizelgeyi gereksiz bilgilerle aşırı yüklemez. Herhangi bir strateji için bir filtre olarak kullanılabili
Infinity Trend Pro
Yaroslav Varankin
1 (1)
This is a trend indicator without redrawing Developed instead of the binary options strategy (by the color of the Martingale candlestick) Also works well in forex trading When to open trades (binary options) A signal will appear in the place with a candle signaling the current candle It is recommended to open a deal for one candle of the current timeframe M1 and M5 When a blue dot appears, open a deal up When a red dot appears, open a trade down. How to open trades on Forex. When a signal is rec
All Symbols   AND  All Time frames Scan                                                                                                                 Document Introduction   The ABCD is a basic harmonic pattern. The ABCD pattern is a visual, geometric chart pattern comprised of three consecutive price swings. It looks like a diagonal lightning bolt and can indicate an upcoming trading opp
RTrends
Nikolay Likhovid
The RTrends indicator does two things: first, it automatically draws the layout of the price chart by plotting trend lines and, secondly, it produces bearish and bullish signals. The layout reflects the fractal nature of the market. Trends from different time horizons are applied simultaneously on the chart. Thus, from a single chart a trader can see trend lines of higher timeframes. The lines, depending on the horizon, differ in color and width: the older the horizon, the thicker the line is. T
The Sextet Scalper Pro  is an MT4 indicator that gives signals when new waves are starting in a trend. The trends are calculated using the original " The Sextet " indicator method. You get a free EA to trade with The Sextet Scalper Pro: Free EA . Default settings were optimized on GBPUSD H1 from 2017. EA could be tested on free demo version of The Sextet Scalper Pro, before purchase. Key Features: Uses The Sextet Trend Detection Method which is already a good strategy in itself for detecting l
The CCI Divergence is a reasonably useful indicator in itself, but it is even more effective when used with divergence pattern trading. The CCI Divergence indicator signal is one of the most potent signals among the indicators that exist in the market. Here is new version for Divergence Indicator using CCI method, with more improvements. Divergences indicate a potential investment point because the directional moment does not confirm the price. A bullish divergence occurs when the underlying
ROYAL DUTCH SKUNK USES THE TREND WAVE INDICATOR AND IT CAN IDENTIFY THE BEGINNING AND THE END OF A NEW WAVE TREND MOVEMENT. AS AN OSCILLATOR, THE INDICATOR IDENTIFIES THE OVERBOUGHT AND OVERSOLD ZONES. IT WORKS GREAT TO CATCH THE SHORT TERM PRICE REVERSALS AND USES A MARTINGALE STRATEGY TO CLOSE ALL TRADES IN PROFIT. USE DEFAULT SETTINGS ON H1 OR HIGHER TIME FRAME ON ANY PAIR FOR MORE ACCURATE TRADES WHY THIS EA : Smart entries calculated by 6 great strategies The EA can be run on even a $20000
PZ Trend Trading
PZ TRADING SLU
4.8 (5)
Capture every opportunity: your go-to indicator for profitable trend trading Special Offer: Purchase now to receive free bonuses worth $159! (Read more for details) Trend Trading is an indicator designed to profit as much as possible from trends taking place in the market, by timing pullbacks and breakouts. It finds trading opportunities by analyzing what the price is doing during established trends. [ Installation Guide | Update Guide | Troubleshooting | FAQ | All Products ] Trade financial
Bu ürünün alıcıları ayrıca şunları da satın alıyor
Scalper Inside PRO
Alexey Minkov
4.75 (60)
An exclusive indicator that utilizes an innovative algorithm to swiftly and accurately determine the market trend. The indicator automatically calculates opening, closing, and profit levels, providing detailed trading statistics. With these features, you can choose the most appropriate trading instrument for the current market conditions. Additionally, you can easily integrate your own arrow indicators into Scalper Inside Pro to quickly evaluate their statistics and profitability. Scalper Inside
Şu anda %20 İNDİRİMLİ! Herhangi bir Acemi veya Uzman Tüccar için En İyi Çözüm! Bu gösterge paneli yazılımı 28 döviz çifti üzerinde çalışıyor. Ana göstergelerimizden 2'sine (Gelişmiş Para Birimi Gücü 28 ve Gelişmiş Para Birimi Dürtüsü) dayanmaktadır. Tüm Forex piyasasına harika bir genel bakış sağlar. Gelişmiş Para Birimi Gücü değerlerini, para birimi hareket hızını ve tüm (9) zaman dilimlerinde 28 Forex çifti için sinyalleri gösterir. Trendleri ve / veya scalping fırsatlarını belirlemek içi
Enigmera
Ivan Stefanov
5 (4)
ENIGMERA: Pazarın çekirdeği https://www.enigmera.com Giriş Bu gösterge ve ticaret sistemi, finansal piyasalar için dikkate değer bir yaklaşımdır. ENIGMERA, destek ve direnç seviyelerini doğru bir şekilde hesaplamak için fraktal döngüleri kullanır. Gerçek birikim aşamasını gösterir ve yön ve hedefler verir.  İster bir trendde ister bir düzeltmede olalım çalışan bir sistem.  Nasıl çalışır? ENIGMERA üç çizgiden oluşur: destek/direnç çizgisi, hedef çizgisi ve sapma çizgisi. Sistem, geçmiş veril
Gold Channel is a volatility-based indicator, developed with a specific timing algorithm for the XAUUSD pair, which consists of finding possible corrections in the market. This indicator shows two outer lines, an inner line (retracement line) and an arrow sign, where the theory of the channel is to help identify overbought and oversold conditions in the market. The market price will generally fall between the boundaries of the channel. If prices touch or move outside the channel it is a tra
ÜRÜNÜ SATIN ALMADAN ÖNCE LÜTFEN AŞAĞIDAKİ BİLGİLERİ OKUYUNUZ! Apollo Pips PLUS SP benzersiz bir üründür! YENİ "APOLLO PIPS" GÖSTERGEMİ ARTI TÜM İŞLEM GÖSTERGELERİME ERİŞİM İLE "SÜPER PAKET" BONUSUNU ALMAK İSTEYENLER İÇİN! Apollo Pips PLUS SP ürününü satın alarak aslında Apollo Pips göstergemin tamamen yeni bir versiyonunu satın almış oluyorsunuz. Göstergenin bu sürümü, geliştirilmiş bir algoritmaya ve kullanımı kolay bir parametreye sahiptir; bu, size göstergeyi herhangi bir piyasada ve herhangi
PZ Day Trading
PZ TRADING SLU
3.67 (3)
Effortless trading: non-repainting indicator for accurate price reversals Special Offer: Purchase now to receive free bonuses worth $189! (Read more for details) This indicator detects price reversals in a zig-zag fashion, using only price action analysis and a donchian channel. It has been specifically designed for short-term trading, without repainting or backpainting at all. It is a fantastic tool for shrewd traders aiming to increase the timing of their operations. [ Installation Guide | Up
TPSpro RFI Levels
Roman Podpora
4.83 (24)
Reversal First Impulse levels (RFI)    INSTRUCTIONS        RUS       -       ENG              R ecommended to use with an indicator   -   TPSpro  TREND PRO -  Version MT5 A key element in trading is zones or levels from which decisions to buy or sell a trading instrument are made. Despite attempts by major players to conceal their presence in the market, they inevitably leave traces. Our task was to learn how to identify these traces and interpret them correctly. Main functions: Displaying activ
PZ Mean Reversion MT4
PZ TRADING SLU
2.33 (3)
Ortalama geri dönüş ticareti için profesyonel ve nicel bir yaklaşım uygulayan benzersiz gösterge. Fiyatın tahmin edilebilir ve ölçülebilir bir şekilde ortalamaya döndüğü ve yön değiştirdiği gerçeğinden yararlanır, bu da nicel olmayan ticaret stratejilerinden büyük ölçüde daha iyi performans gösteren net giriş ve çıkış kurallarına izin verir. [ Installation Guide | Update Guide | Troubleshooting | FAQ | All Products ] Ticaret sinyallerini temizle Ticaret yapmak inanılmaz derecede kolay Özelleş
GOLD Impulse with Alert
Bernhard Schweigert
4.56 (9)
Bu gösterge, 2 ürünümüz Advanced Currency IMPULSE with ALERT  +   Currency Strength Exotics  'in süper bir kombinasyonudur. Tüm zaman dilimleri için çalışır ve 8 ana para birimi artı bir Sembol için grafiksel olarak güç veya zayıflık dürtüsünü gösterir! Bu Gösterge, Altın, Egzotik Çiftler, Emtialar, Endeksler veya Vadeli İşlemler gibi herhangi bir sembol için para birimi gücü ivmesini göstermek için uzmanlaşmıştır. Türünün ilk örneğidir, Altın, Gümüş, Petrol, DAX, US30, MXN, TRY, CNH vb.
This product is based on the methodologies of Gann, his follower Don E. Hall. The Indicator builds a working view grid, which is used to analyze graphics. The Pyrapoint tool, developed by Don Hall, is a grid based on the Pythagorean cube. In his calculations he uses the Gann Square 9 methodology and the relationship between Price and Time. This tool is used to predict changes in trend and overall market actions. More information about the method   HERE
Best Currency Strength Indicator
Tumelo Patrick Rakotsoane
4.6 (48)
Advanced Currency Strength Indicator The Advanced Divergence Currency Strength Indicator. Not only it breaks down all 28 forex currency pairs and calculates the strength of individual currencies across all timeframes , but, You'll be analyzing the WHOLE forex market in 1 window (In just 1 minute) . This indicator is very powerful because it reveals the true movements of the market.  It is highly recommended to  analyze charts knowing the performance of individual currencies or the countries ec
TPSproTREND PrO
Roman Podpora
4.78 (18)
TPSpro TRENDPRO  - is a trend indicator that automatically analyzes the market and provides information about the trend and each of its changes, as well as giving signals for entering trades without redrawing! The indicator uses each candle, analyzing them separately. referring to different impulses - up or down impulse. Exact entry points into transactions for currencies, crypto, metals, stocks, indices!  Version MT5             DETAILED DESCRIPTION              R ecommended to use with an indi
XQ Indicator MetaTrader 4
Marzena Maria Szmit
3.67 (3)
Step into the realm of Forex trading with confidence and precision using XQ, a cutting-edge Forex indicator designed to elevate your trading game to unprecedented heights. Whether you're a seasoned trader or just stepping into the world of currency exchange,   XQ Forex Indicator   empowers you with the insights and signals needed to make informed trading decisions. The signal conditions are a combination of three indicators, and XQ Forex Indicator only display  medium and long-term trends . The
Entry Points Pro
Yury Orlov
4.7 (226)
Yeniden boyamadan bir ticarete girmek için doğru sinyaller sağlayan MT5 için en iyi gösterge! Herhangi bir finansal varlığa uygulanabilir: forex, kripto para birimleri, metaller, hisse senetleri, endeksler. MT5 versiyonu burada Oldukça doğru alım satım sinyalleri sağlayacak ve bir alım satımı açıp kapatmanın en iyi zamanını size söyleyecektir. Göstergeyi ödeyen yalnızca bir sinyali işleme örneğiyle videoyu (6:22) izleyin! Çoğu tüccar, Giriş Noktaları Pro göstergesinin yardımıyla ilk işl
Max Paynex
Abdulkarim Karazon
Max Payne, ok şeklinde sinyaller veren bir ters/trend sinyal göstergesidir, bu gösterge sinyalini aynı çubuk kapanışında verir, bu gösterge sinyallerin ikili/üçlü onayını almak için grafik üzerinde farklı periyotlarla birden çok kez düşebilir Gösterge, hiçbir zaman yeniden boyamaz veya arkasını boyamazken, herhangi bir ticaret stiline uyacak şekilde son derece ayarlanabilir; satın alma sonrasında, kullanılan şablonların yanı sıra ekran görüntülerinde gösterilen tüm sistemi elde edeceksiniz. ---
RelicusRoad Pro
Relicus LLC
4.73 (141)
Şimdi 147 $ (birkaç güncellemeden sonra 499 $ 'a yükseliyor) - Sınırsız Hesaplar (PC'ler veya Mac'ler) RelicusRoad Kullanım Kılavuzu + Eğitim Videoları + Özel Discord Grubuna Erişim + VIP Durumu PİYASAYA BAKMAK İÇİN YENİ BİR YOL RelicusRoad, forex, vadeli işlemler, kripto para birimleri, hisse senetleri ve endeksler için dünyanın en güçlü ticaret göstergesidir ve yatırımcılara kârlı kalmaları için ihtiyaç duydukları tüm bilgileri ve araçları sağlar. Başlangıç ​​seviyesinden ileri seviyey
Quantum Currency Array Indicator
QUANTUM TRADING SOFTWARE LIMITED
This indicator has been developed to identify and display these trends quickly and easily, allowing you to see instantly, those currency pairs which are trending, and those which are not – and in all timeframes, with just one click. The 28 currency pairs are displayed as a fan as they sweep from strong to weak and back again, and this is why we call it the ‘currency array’. All 28 pairs are arrayed before you, giving an instant visual description of those pairs that are trending strongly, those
JULY OFFER 80% OFF next price for unlimited version will be 17000$. This is the only time you can get this institutional and professional indicator at this price for unlimited version. Don't dare to miss this. The tool I am about to introduce to you you can't compare it with other tools due to its strategy and accuracy level in predicting the next price directional movement . This tool is designed for serious traders who have decided to make a difference through trading. Be the next person to wi
Tanıtım       Kuantum Trend Keskin Nişancı Göstergesi   , trend tersine dönmeleri belirleme ve ticaret yapma şeklinizi değiştiren çığır açan MQL5 Göstergesi! 13 yılı aşkın ticaret tecrübesine sahip deneyimli tüccarlardan oluşan bir ekip tarafından geliştirilmiştir.       Kuantum Trend Keskin Nişancı Göstergesi       trend dönüşlerini son derece yüksek doğrulukla belirlemenin yenilikçi yolu ile ticaret yolculuğunuzu yeni zirvelere taşımak için tasarlanmıştır. ***Kuantum Trend Keskin Nişancı Gö
FX Volume
Daniel Stein
4.61 (36)
Sabah Brifingimiz aracılığıyla ayrıntılar ve ekran görüntüleri ile günlük piyasa güncellemenizi alın burada mql5 ve on Telegram ! FX Volume, bir brokerin bakış açısından piyasa duyarlılığı hakkında GERÇEK bir fikir veren İLK ve TEK hacim göstergesidir. COT raporlarından çok daha hızlı bir şekilde, brokerlar gibi kurumsal piyasa katılımcılarının Forex piyasasında nasıl konumlandıklarına dair harika bilgiler sağlar. Bu bilgileri doğrudan grafiğinizde görmek, ticaretiniz için gerçek oyun değiştir
Cycle Sniper
Elmira Memish
4.44 (39)
NEW YEAR SALE PRICE FOR LIMITED TIME!!! Please contact us after your purchase and we will send you the complimentary indicators to complete the system Cycle Sniper is not a holy grail but when you use it in a system which is explained in the videos, you will feel the difference. If you are not willing to focus on the charts designed with Cycle Sniper and other free tools we provide, we recommend not buying this indicator. We recommend watching the videos about the indiactor and system before pu
Quantum Breakout Indicator PRO
Bogdan Ion Puscasu
4.96 (26)
Tanıtım       Quantum Breakout PRO   , Breakout Bölgeleri ile ticaret yapma şeklinizi değiştiren çığır açan MQL5 Göstergesi! 13 yılı aşkın ticaret deneyimine sahip deneyimli tüccarlardan oluşan bir ekip tarafından geliştirilen   Quantum Breakout PRO   , yenilikçi ve dinamik koparma bölgesi stratejisiyle ticaret yolculuğunuzu yeni zirvelere taşımak için tasarlanmıştır. Kuantum Breakout Göstergesi, size 5 kar hedefi bölgesi ile kırılma bölgelerinde sinyal okları ve kırılma kutusuna dayalı ol
"The Squeeze indicator attempts to identify periods of consolidation in a market. In general the market is either in a period of quiet consolidation or vertical price discovery. By identifying these calm periods, we have a better opportunity of getting into trades with the potential for larger moves. Once a market enters into a "squeeze," we watch the overall market momentum to help forecast the market direction and await a release of market energy." Modified TTM Squeeze Indicator is a modifica
"MultiSymbol & TF Chart Integrated" göstergesi, tek bir grafikte (çoklu mod) tercih ettiğiniz zaman dilimlerinde 60'a kadar döviz çiftini izleyebilmenizi veya işlem yaptığınız çifti tüm TF'lerde görüntüleyebilmenizi (basit mod) sağlayarak piyasaya hızlı ve kapsamlı bir bakış sunmak üzere tasarlanmıştır. Ana Avantajlar: Tam İzleme: Tek bir grafikte tüm istenen çiftleri bir bakışta gerçek zamanlı olarak izlemeye olanak tanır. Zaman Tasarrufu: Grafikler arasında geçiş yapma ihtiyacını ortadan kald
AT Forex Indicator MT4
Marzena Maria Szmit
5 (3)
The AT Forex Indicator MT4 is a sophisticated trading tool designed to provide traders with a comprehensive analysis of multiple currency pairs. This   powerful indicator   simplifies the complex nature of the forex market, making it accessible for both novice and experienced traders. AT Forex Indicator uses   advanced algorithms   to detect trends, patterns and is an essential tool for traders aiming to enhance their forex trading performance. With its robust features, ease of use, and reliabl
Dear Traders this is my another tool called " Swing Master Indicator ". As the name above the indicator is designed to help you in swing trading by capturing the low and highs of the price. You may us this tool with any trading strategy and style from scalping to position trading. It is made for level of traders including newbies and advanced traders even prop-firms, hedge funds and banks to help them make sold market analysis. I create tools for serious traders who want to make a difference in
Ultimate Sniper Dashboard
Hispraise Chinedum Abraham
4.85 (27)
İndirimli fiyatı 299$! Fiyatlar gelecekte artabilir! Aşağıdaki açıklamayı okuyun! Ultimate Sniper Dashboard için En İyi Giriş Sistemi: NIHAI DINAMIK SEVIYELER. (Lütfen Ürünlerimi Kontrol Edin) Ultimate Sniper Dashboard, MT4 çoklu para birimi test limitleri nedeniyle SADECE canlı piyasalarda çalışır. Ultimate-Sniper Dashboard ile tanışın! Hem HA-Sniper hem de MA-Sniper içeren en iyimiz. ve birçok özel mod. Ultimate Sniper Dashboard mutlak bir canavar! Herhangi bir Acemi veya Uzman Tüccar
NAM Order Blocks
NAM TECH GROUP, CORP.
5 (1)
MT4 Multi-timeframe Order Blocks detection indicator. Features - Fully customizable on chart control panel, provides complete interaction. - Hide and show control panel wherever you want. - Detect OBs on multiple timeframes. - Select OBs quantity to display. - Different OBs user interface. - Different filters on OBs. - OB proximity alert. - ADR High and Low lines. - Notification service (Screen alerts | Push notifications). Summary Order block is a market behavior that indicates order collection
Indicator : RealValueIndicator Description : RealValueIndicator is a powerful tool designed specifically for trading on the EURUSD pair. This indicator analyzes all EUR and USD pairs, calculates their real currency strength values, and displays them as a single realistic value to give you a head start on price. This indicator will tell you moves before they happen if you use it right. RealValueIndicator allows you to get a quick and accurate overview of the EURUSD currency pair tops and bottoms,
ECM Elite Channel is a volatility-based indicator, developed with a specific time algorithm, which consists of finding possible corrections in the market. This indicator shows two outer lines, an inner line (retracement line) and an arrow sign, where the channel theory is to help identify overbought and oversold conditions in the market. The market price will generally fall between the boundaries of the channel. If prices touch or move outside the channel, it's a trading opportunity. The
Yazarın diğer ürünleri
MT4 için Astronomi Göstergesini Tanıtıyoruz: En İleri Göksel Ticaret Arkadaşınız Ticaret deneyiminizi göksel seviyelere yükseltmeye hazır mısınız? MT4 için devrim niteliğindeki Astronomi Göstergemizi arayın. Bu yenilikçi araç karmaşık algoritmaları kullanarak eşsiz astronomik içgörüler ve hassas hesaplamalar sunmak için geleneksel ticaret göstergelerini aşmaktadır. Bilgi Evreni Parmaklarınızın Ucunda: Göksel verilerin hazinelerini açığa çıkaran kapsamlı bir paneli gözlemleyin. Gezegenlerin geo/h
Gann Kare Göstergesi, W.D. Gann tarafından yazılan "Piyasa Tahminleri için Matematiksel Formül" makalesine dayalı güçlü bir piyasa analizi aracıdır. Bu araç, piyasa analizi için matematiksel ve Gann teorilerini kullanarak hassas analizler gerçekleştirir. 144, 90, 52 karelerini ve ayrıca 9 karesini kullanır. Ayrıca, 'ın 9 karesi ve bu kareyle ilişkili kanallar ve yıldız modelleri için yöntemini içerir. Kullanıcı Kılavuzu ve Uygulama: Bu göstergeleri kullanmadan önce, kullanıcı kılavuzunu okumanız
Sizlere ON Trade Waves Patterns Harmonic Elliot Wolfe'u tanıtmaktan mutluluk duyarız. Bu, manuel ve otomatik yöntemleri kullanarak piyasada çeşitli desenleri tespit etmek için tasarlanmış gelişmiş bir göstergedir. İşte nasıl çalıştığı: Harmonik Desenler: Bu gösterge, grafiğinizde görünen harmonik desenleri tanımlayabilir. Bu desenler, Scott Carney'in "Harmonic Trading vol 1 & 2" adlı kitabında açıklandığı gibi harmonik ticaret teorisini uygulayan tüccarlar için önemlidir. Onları manuel olarak ç
Shepherd Harmonic Pattern
Abdullah Alrai
4.68 (59)
Bu gösterge, manuel ve otomatik yöntemlerle çizilen harmonik desenleri algılar. Kullanım kılavuzuna şu bağlantıdan erişebilirsiniz: İncelemenizi ekleyin ve ürünü almak için bizimle iletişime geçin. Bu ürünü mt4'te denemek için ücretsiz bir sürümü vardır. Gartley ve Nenstar desenlerini algılamak için kullanabilirsiniz: https://www.mql5.com/en/market/product/30181 Tam MT4 sürümünü şuradan satın alabilirsiniz: https://www.mql5.com/en/market/product/15212 Notlar Gösterge kontrol paneline sahiptir ve
Bu gösterge, Elliott dalga teorisi ile iki şekilde çalışır: Otomatik Çalışma: Bu modda gösterge, Elliott dalga teorisine uygun olarak grafikteki beş hareket dalgasını otomatik olarak tespit edecek ve tahminlerde bulunacak, potansiyel ters dönüş bölgelerini belirleyecektir. Ayrıca, önemli gelişmeler hakkında tüccarları uyarılar ve bildirimlerle bilgilendirebilme yeteneğine sahiptir. Bu otomatik işlev, Elliott dalga desenlerinin tanımlanması ve analiz sürecini basit hale getirir. Manuel Çalışma: B
ON Trade Pivoteer
Abdullah Alrai
4 (1)
Introducing the Pivot Point Selector Indicator: Your Ultimate Tool for Custom Pivot Levels Are you ready to take your trading to the next level? Say hello to the Pivot Point Selector Indicator, a game-changing tool that puts you in control of your pivot levels. This innovative indicator empowers you to choose three specific points that will determine the pivot level calculations, giving you unparalleled customization and precision in your trading strategy. Key Features and Benefits: Custom Pivo
FREE
This indicator will detect harmonic patterns that are drawn on the chart by manual and automatic methods. You can see user manual from this link: https://www.mql5.com/en/blogs/post/719257 There is a free version (it detect only Gartley and Nenstar Patterns) to try this product. You can buy the full MT4 version from: https://www.mql5.com/en/market/product/104689 Notes When you use this indicator and change the settings, add indicators like Moving Average or Bollinger Bands, this indicator will
FREE
Bu gösterge, W.D. Gann'ın dokuzun karesi ve 144'ün karesine bağlı olarak yazdığı "Piyasa tahminleri için matematiksel formül" makalesine dayanan bir piyasa analiz yöntemidir. Kullanım kılavuzu: Add Your review And contact us to get it Tam MT5 Sürümünü Şunlardan Satın Alabilirsiniz: https://www.mql5.com/en/market/product/28669 MT4'te ücretsiz olarak test edebilirsiniz: https://www.mql5.com/en/market/product/15316 Bu ürün sizin için Düzeyler / Yıldız / Izgara / Gann hayranları
FREE
Hikkake Japon Şamdan Deseni, grafikte oluşan Hikkake Fiyat Hareket Desenlerini belirlemek ve tespit etmek üzere tasarlanmış özel bir göstergedir. Bu desenler, genellikle potansiyel ticaret fırsatlarına yol açan bir iç çubukta sahte bir dışarı çıkma kavramına dayanır. Göstergenin temel işlevi, grafiğin son beş şamdanını analiz etmek ve bu şamdanların Hikkake deseninin özelliklerini sergileyip sergilemediğini belirlemektir. Bu desen onaylandığında, gösterge deseni oluşturan şamdanların etrafına bi
This indicator offers a comprehensive and efficient solution for traders seeking optimal entries in scalping strategies. Leveraging moving averages and stochastic indicators, it employs a systematic approach to identify favorable trade opportunities. The indicator goes beyond mere analysis, actively drawing clear and actionable entry points on your chart, denoted by arrows. Moreover, it provides the convenience of alerts to ensure you never miss these potential setups. Key Features and Benefits:
FREE
ON Trade Marubozu Mum Modeli Göstergesi Marubozu mum modeli, piyasa duyarlılığını ve potansiyel trend dönüşlerini değerli bilgilerle sunabilen güçlü ve açık bir mum modelidir. Bu model, uçlarından birinde çok küçük veya hiç gölge (fitil) bulunmayan ve baskın trendin yönünde uzanan uzun bir gövdeye sahip bir mumla karakterizedir. Bu model, alıcılar ve satıcılar arasında güçlü bir dengesizliği temsil eder ve piyasada momentumun güçlü bir şekilde tek taraflı olduğunu gösterir. Özellikler ve Faydala
FREE
ON Trade Pivots is A technical indicator that Draws all Pivot levels depending on time frame that defined in settings. Notes It will be good tool for all traders who use pivot levels in their trades. Let me inform you that this indicator draw this level as buffers not as objects then you can connect it easily to EA. This indicator allow you to find pivots levels for any time frame not only daily you are free to choose time frame from settings. Parameters Use_System_Visuals - Enable /Disable
FREE
Altın Gram Fiyatı Hesaplayıcı Gösterge Tanıtımı Yerel para biriminizdeki altın fiyatını sürekli olarak takip etmek istiyor musunuz? Daha fazla aramayın, Altın Gram Fiyatı Hesaplayıcı Gösterge, tercih ettiğiniz yerel para biriminde gerçek zamanlı olarak gram başına altın fiyatını hesaplamanıza olanak sağlayan yenilikçi bir araç sunar. Bu gösterge ile finansal bilgileri kullanarak bilinçli kararlar alabilirsiniz. Ana Özellikler: Yerelleştirilmiş Altın Fiyatı: Altın Gram Fiyatı Hesaplayıcı Gösterge
FREE
Bu gösterge, ticaret grafiğinizde Donchian kanalını görsel olarak temsil etme amacını taşır. Donchian kanalı, belirli bir dönemde en yüksek yüksek ve en düşük düşük arasındaki aralığı gösteren basit bir teknik araçtır. Bu gösterge, fiyat hareketlerinin görsel analizini geliştirerek potansiyel kırılma ve trend devam noktalarına dair anlayış sunar. Donchian kanalı, bu seçeneği etkinleştirmeyi tercih ederseniz hem geçerli zaman dilimine hem de daha yüksek bir zaman dilimine uygulanabilir. Gösterge
FREE
"Bu gösterge basit bir eğilim tespit aracıdır. Skalping modu gibi iyi girişlere sahip olmak için stratejinizle birlikte kullanabilirsiniz. Fiyatın etrafında bir kanal çizecektir ve zaman arttıkça genişleyecektir; özel dönemlerde algoritma çalışma süresi ve fiyatı bir araya getirerek artış noktasının başlangıcına dönecektir. Ters dönüş işaretleri göründükten sonra kanalın en düşük sınırından satın alabilirsiniz. Ve ters dönüş işaretlerini gördükten sonra en yüksek kanal sınırından satabilirsiniz
Rsi Channel
Abdullah Alrai
5 (1)
This indicator displays the channel of Relative Strength Index. When you see that the price touches the red line and retreats from it many times, then you will know that the general trend is down. When it retreats from the blue line many times, that means that the general trend is up. This lines express the RSI values attributed to the price values on the main chart. You can add this indicator to your strategy, it will help you. This indicator will work best on 5 minutes and higher time frames.
Bu araç sayesinde grafiklerinizde regresyon kanalını kontrol etme yeteneği elde edersiniz. Kanal seviyelerini, destek ve direnç seviyelerini sağlayacaktır. Ayrıca düzeltme dalgası seviyelerini sunar. Ayrıca, dolum ve ışın seçenekleri gibi kanalı doğrudan kontrol etme imkanını sağlayan bir kontrol paneli üzerinden kanalı yönetebilirsiniz. Ayrıca, farklı çiftlerle işlem yaparken daha iyi bir görünüm elde etmek için daha yüksek zaman dilimlerinden veri yükleyebilirsiniz. Nasıl Kullanılır: Trend Çiz
Güçlü Forex göstergemizi sizlere sunuyoruz. Bu gösterge, ticaret stratejinizi geliştirmeniz ve size piyasa trendleri hakkında kesin bilgiler sağlamanız için tasarlanmıştır. Bu yenilikçi araç, mum ölçümlerini ayrıntılı bir şekilde analiz eden ve en iyi hassasiyeti elde etmek için ayarlamalar yapan sofistike bir özel algoritma kullanır. Sonuç? Grafiğinizde stratejik giriş noktalarını gösteren dikkatlice çizilmiş bir ok takımı. Bu göstergenin arkasındaki dahilik, mum desenlerinin gücünden faydalanm
"Bu gösterge, Bystra deseni teorisine dayalı olarak girişleri tespit eder ve hedef ve durma seviyeleri ile sınırlı emirleri yerleştirmek için giriş değerlerini sağlar. Bu, risk yüzdesini hesaplamanıza olanak tanır. Notlar: Bu gösterge, Uzman Danışmanlar (EA) içinde kullanım için tamponlara sahiptir. Bu ürünle çalışırken iyi bir para yönetimi uygulamanız önemlidir. Zaman diliminizi değiştirdiğinizde, Gösterge, son oturumunuzda kullanılan şablonu kaydedecektir. Bu yöntemi öğrenmek için bir kitaba
"Fibo Star" göstergesi, Fibonacci Fanlarını yıldız şeklinde grafik üzerine çizmek için tasarlanmıştır. Bu Fibonacci Fanları, fiyat hareketlerini analiz etmek için güçlü bir araçtır ve potansiyel destek ve direnç seviyeleri hakkında görüşler sunabilir. Bu gösterge, çizim ve yapılandırma sürecini kolaylaştırmayı amaçlayan kullanıcı dostu bir kontrol paneli ile donatılmıştır, böylece zaman ve çaba tasarrufu sağlar. Kullanım Talimatları: Bu gösterge manuel kullanım içindir. Etkili bir şekilde kullan
Güçlü Fiyat Hareketi Desenlerini Algılayan Teknik Gösterge: Pin Bar, Inside Bar ve Outside Bar Giriş: Teknik analizin alanında, fiyat hareketi desenleri potansiyel piyasa hareketlerinin önemli göstergeleri olarak işlev görür. Grafiklerde sağlam fiyat hareketi desenlerini tanımlamanın kolaylaştırıldığı sofistike bir teknik gösterge geliştirdik. Göstergemiz, üç temel deseni tanıma konusunda uzmanlaşmıştır: Pin Bar, Inside Bar ve Outside Bar. Ana Desenlerin Algılanması: Pin Bar: Pin Bar deseni, piy
Unlock Hidden Insights with the Numerokh Indicator: Your Numerology-Based Support and Resistance Tool Introducing the Numerokh indicator, a revolutionary tool that brings the mystical world of numerology into the realm of trading. Imagine having the power to identify key support and resistance levels on your charts using the age-old wisdom of numerology. This indicator takes trading to a new dimension, offering you a unique way to analyze price movements and make informed trading decisions. Key
Shepherd Numeroloji Seviye Göstergesi ile ticarette devrim yaratan bir yaklaşımı keşfedin. Bu yenilikçi araç, geleneksel ticaret tekniklerini antik numeroloji bilgisiyle birleştirerek grafiklerinizdeki önemli destek ve direnç seviyelerini belirlemenize yardımcı olur. Dokuzun karesi yöntemini kullanarak bu gösterge, piyasa mekanizmalarına farklı bir bakış açısı sunar ve daha bilinçli ticaret kararları almanıza olanak tanır. Ana Özellikler ve Avantajlar: Numeroloji ve Dokuzun Karesi: Shepherd Nume
Conclusioni: L'Indicatore ON Trade Numerology Mirror introduce una nuova prospettiva nell'analisi delle inversioni di prezzo integrando la saggezza antica della numerologia. Decifrando i modelli invertiti delle sequenze di numeri, ottieni una prospettiva unica sulle possibili inversioni di prezzo. Poiché il successo nel trading dipende da molti fattori, considera questo indicatore come parte integrante della tua strategia di trading globale. [Avviso: Il trading comporta rischi, e l'indicatore d
Maravilla Square Göstergesi Tanıtımı: Öngörülü İşlem İçin Yardımcınız Maravilla Square göstergesini keşfedin: Öngörülü işlem için anahtarınız. Bu eşsiz araç, fiyat tersine dönmeleri hakkında içgörü sunar ve yüksek ve düşük noktalar arasında ayarlanabilir bir eğilim çizgisi sunar. Trend Çizgisi Dinamiği: Maravilla Square göstergesi, grafiğin yüksek ve düşük noktalarına uyum sağlayabileceğiniz bir trend çizgisi sunar. Bu dinamik özellik, gösterge ile fiyat hareketleri arasında doğrudan bir bağlan
Introducing the ON Trade Melad Pattern Indicator: Enhance Your Trading Strategy with Breakout Patterns Discover the power of the ON Trade Melad Pattern Indicator—an intuitive tool designed to elevate your trading decisions by detecting and highlighting breakout patterns on your charts. This indicator is your key to identifying crucial breakout points and potential trend shifts with simplicity and precision. Key Features: Breakout Pattern Detection: The ON Trade Melad Pattern Indicator foc
This indicator will give you entries as result of scalping strategy that will be applied on 14 symbols in same time and you are able to be notified with this entries  Note :   This indicator for scalping on 5 minutes timeframe only . How to use it : 1-Open chart and adjust settings (edit symbols names as your platform names , activate the alert system if you need it . 2-Wait for any signal you have it from this scanner you will have it as alert and as notification and you will see it on bo
This indicator gives you the signal of real cross on stochastic indicator. This indicator is easy to attach to an ea. This indicator will work best on All time frames. Arrow appears depending on many algorithms that study the cross parameters. Indicator properties Use_System_Visuals: enable/disable visual styles. Stochastic_K_Period. Stochastic_D_Period. Stochastic_Slowing. Use_Notifications: enable/disable Push Notifications. Use_Alert: enable/disable Alerts. Use_E_Mail: enable/disable Email
ON Trade Volaty'yi Tanıtıyoruz: Karlı Volatilite Kopma Çözümünüz ON Trade Volaty Göstergesi ile ticaret fırsatlarını kilitleyin. Gelişmiş volatilite analizi kullanarak kopma bölgelerini belirler, işlemlerinizi hassaslıkla yönlendirir. Stratejik giriş ve hedef noktalarıyla fiyat hareketlerini yakalayın, tümü ticaret tarzınıza uygun olarak düzenlenmiştir. Temel Özellikler: Gelişmiş Volatilite Analizi Stratejik Giriş Noktaları Dinamik Hedefleme Özelleştirilebilir Parametreler Uzman Danışman (EA) Uy
Tanıtıyoruz: "ON Trade VSA" - Hacim ve Dağılım Analizi için Ultimate Araç! Gücünü, hacim ve dağılım analizinin (VSA) öncü göstergesi "ON Trade VSA" ile keşfedin. VSA, piyasa gücünü değerlendirmek, trendleri tanımlamak ve bilinçli kararlar almak için trader'lar tarafından kullanılan güçlü bir metodolojidir. Şimdi "ON Trade VSA"yı, ticaret cephaneliğinizde vazgeçilmez bir araç haline getiren temel özelliklere göz atalım: Çok Renkli Hacim Mumları : Ortalama harekete dayalı olarak farklı renkler ata
Filtrele:
İnceleme yok
İncelemeye yanıt