Wave Cycle Explorer
- Göstergeler
- Vitalyi Belyh
- Sürüm: 1.0
- Etkinleştirmeler: 7
Alım satım yapmak, piyasa durumunu analiz etmek ve tahmin etmek için bir trend aracı.
Gösterge, günlük veya haftalık trend dalgaları için kılavuz görevi gören bir kılavuz çizgi içerir. Ve işlem hacimlerini analiz eden özel bir osilatör.
Aşırı alım ve satım piyasalarının dönemlerini gösterir ve olası bir fiyat hareketinin başlangıcında giriş noktalarını belirler.
Gösterge yeniden çizilmez ve gecikmez.
Herhangi bir enstrüman ve Zaman Çerçevesi üzerinde çalışır.
Gösterge grafiği yüklemez, yalnızca 2 ayar içerir, ticaret için bağımsız bir gösterge olarak kullanılabilir.
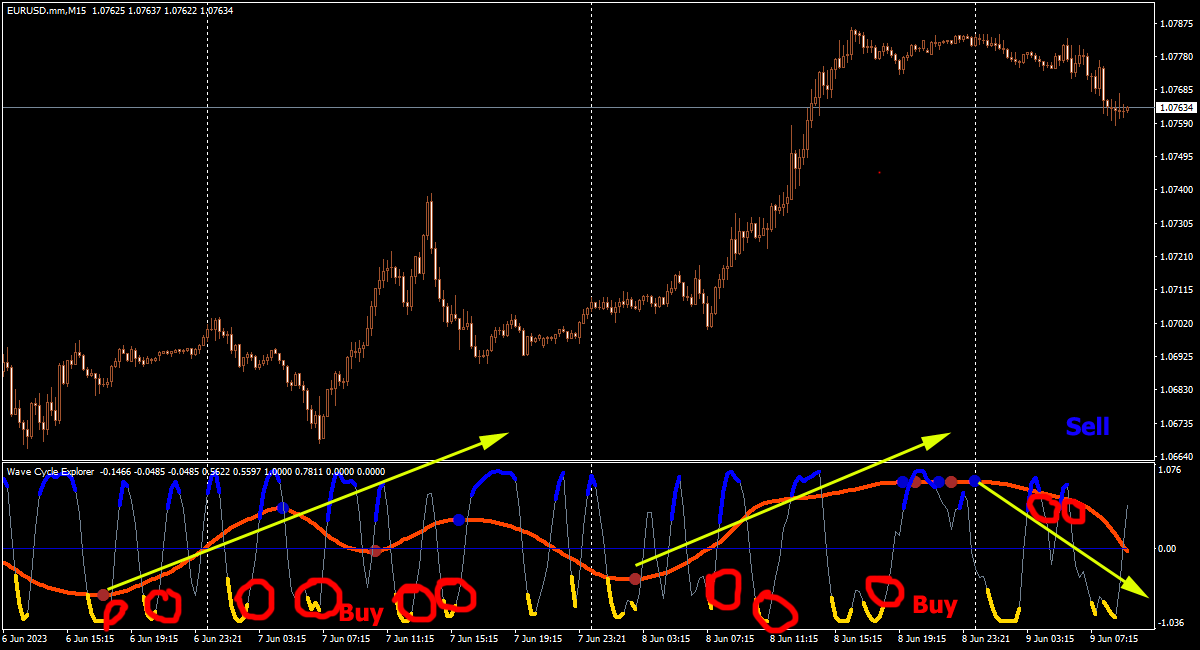
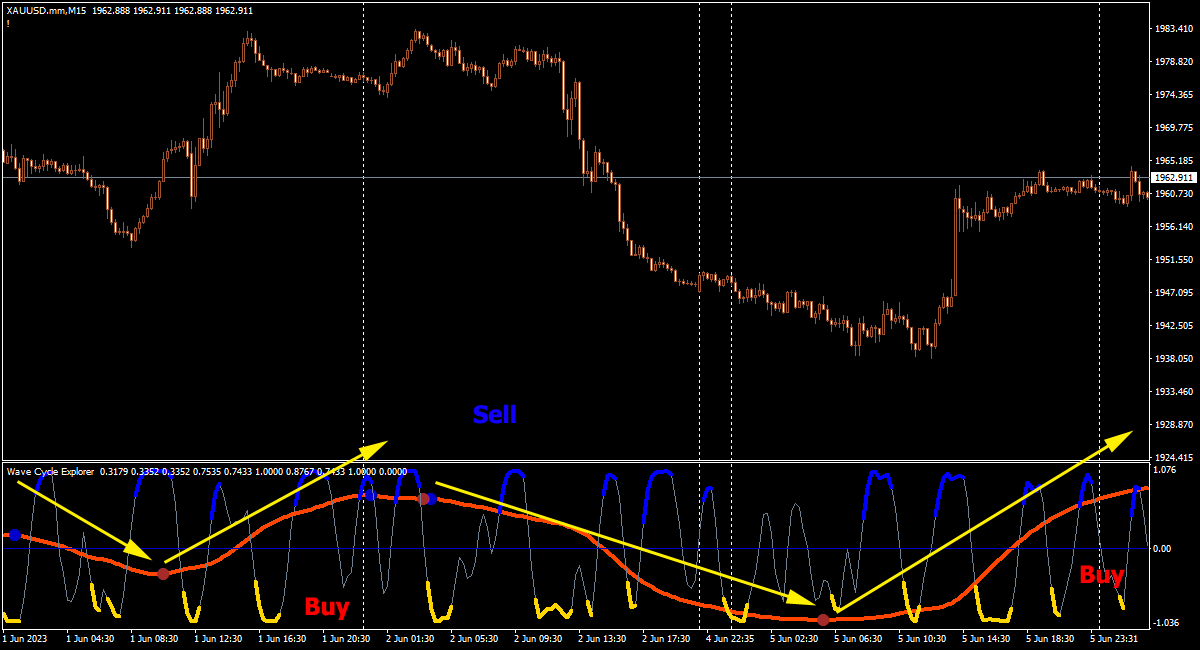
Göstergenin kılavuz turuncu çizgisi, piyasa hareketi hakkında fikir verir. Çizgi aşağı hareket ettiğinde - piyasa düşüş eğiliminde, yukarı hareket ettiğinde - piyasa yükseliş eğiliminde, ayrıca çizgi 0'ın üzerindeyse, yükseliş piyasası hakimdir,
çizgi 0'ın altındaysa, bir ayı piyasası hakimdir. Geri dönüş noktaları dairelerle gösterilir.
Sinyal osilatörü gri bir çizgidir, dalga fiyat hareketlerinde giriş sağlar, çizgi üst ve alt aralıklardan çıktığında çalışır. Maksimum aşırı alım ve aşırı satım bölgeleri sarı ve mavi renktedir.
Osilatör hattının aşırı alım ve aşırı satım bölgesinden çıkışı, fiyat yönünde olası bir değişikliği gösterir.
Osilatöre karşı işlem yapmayın.
Gösterge, M5-M15 zaman dilimleri için standart ayarlara sahiptir, diğer zaman dilimleri için parametreleri değiştirmeniz gerekir.
Giriş parametreleri
Gösterge, günlük veya haftalık trend dalgaları için kılavuz görevi gören bir kılavuz çizgi içerir. Ve işlem hacimlerini analiz eden özel bir osilatör.
Aşırı alım ve satım piyasalarının dönemlerini gösterir ve olası bir fiyat hareketinin başlangıcında giriş noktalarını belirler.
Gösterge yeniden çizilmez ve gecikmez.
Herhangi bir enstrüman ve Zaman Çerçevesi üzerinde çalışır.
Gösterge grafiği yüklemez, yalnızca 2 ayar içerir, ticaret için bağımsız bir gösterge olarak kullanılabilir.
Göstergenin kılavuz turuncu çizgisi, piyasa hareketi hakkında fikir verir. Çizgi aşağı hareket ettiğinde - piyasa düşüş eğiliminde, yukarı hareket ettiğinde - piyasa yükseliş eğiliminde, ayrıca çizgi 0'ın üzerindeyse, yükseliş piyasası hakimdir,
çizgi 0'ın altındaysa, bir ayı piyasası hakimdir. Geri dönüş noktaları dairelerle gösterilir.
Sinyal osilatörü gri bir çizgidir, dalga fiyat hareketlerinde giriş sağlar, çizgi üst ve alt aralıklardan çıktığında çalışır. Maksimum aşırı alım ve aşırı satım bölgeleri sarı ve mavi renktedir.
Osilatör hattının aşırı alım ve aşırı satım bölgesinden çıkışı, fiyat yönünde olası bir değişikliği gösterir.
Osilatöre karşı işlem yapmayın.
Gösterge, M5-M15 zaman dilimleri için standart ayarlara sahiptir, diğer zaman dilimleri için parametreleri değiştirmeniz gerekir.
Giriş parametreleri
- Trend Direction - Trend yönünü hesaplamak için çubuk sayısını analiz eder.
- Signal Oscillator - Sinyal osilatörünü hesaplamak için çubuk sayısını analiz eder.
- Bars Count - grafikteki gösterge çubuklarının sayısı.