YouTube'dan Mağaza ile ilgili eğitici videoları izleyin
Bir alım-satım robotu veya gösterge nasıl satın alınır?
Uzman Danışmanınızı
sanal sunucuda çalıştırın
sanal sunucuda çalıştırın
Satın almadan önce göstergeyi/alım-satım robotunu test edin
Mağazada kazanç sağlamak ister misiniz?
Satış için bir ürün nasıl sunulur?
MetaTrader 5 için ücretli Uzman Danışmanlar ve göstergeler - 30

Mum Geri Sayım Zamanlayıcısı – Piyasada Bir Adım Önde Olun Hangi mumun kapanmasına ne kadar zaman kaldığını hiç merak ettiniz mi? Ticarette zamanlama her şeydir. Mum Geri Sayım Zamanlayıcısı , stratejilerinizi etkili bir şekilde uygulamak için hassas zamana ihtiyaç duyan tüccarlar için mükemmel bir çözümdür. İster scalper, ister günlük tüccar, ister swing tüccar olun, bu araç kritik bir anı asla kaçırmamanızı sağlar. Mum Geri Sayım Zamanlayıcısı Nedir? Mum Geri Sayım Zamanlayıcısı , mevcut mumun

Martingal. "Oberon iMA" , karı özetleyen ve düşüşü zaman içinde dağıtan 15 ayrı bloktan (mini Uzman Danışmanlar) oluşur.
Özellikler: Her karakter için bireysel giriş verileri. Semboller tekrar edilebilir (15 özdeş sembol bile birbirinden ayrı işlem görecektir). Bir ticaret hesabına, farklı ayarlarla birkaç "Oberon iMA" yükleyebilirsiniz (durumu gözlemleyerek: Magic[i+1]>Magic[i]+15). Herhangi bir çizelgeye yüklenir. Yazılımınızın gücü düşükse, "Every_tick_based_on_real_tick" modunda (15 semb
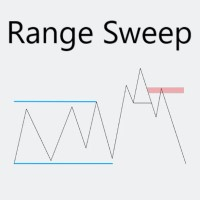
The strategy is quite simple but extremely effective. For Smart Money and ICT traders it may also be known as "Asian Range Sweep", "London Session Sweep" or a "Liquidity Raid".
First of all, the EA marks high and low of the chosen time range and then waits for the price to sweep high or low. Now when a liquidity of a high/low is taken, EA waits for the Market Structure Shift (MSS) and enters a trade on an imbalance (FVG) formed in the displacement.
MT4 version: CLICK The bot includes many func

Uses the built-in news calendar of the MT5 terminal or the Investing.com website (in the latter case, the Get news5 utility is required) Has the Scale parameter={100%, 110%, 125%, ...} to adjust the comfortable size of the text and control elements
Tells you in which direction it is safer to open positions 3 in 1: News + Trends + Forecast
News for the selected period: current and in tabular form
Actual trends for 5 customizable timeframes and trend reversal levels
Forecast of exchange rate mo

Gösterge, Dinamik ZigZag'a (https://www.mql5.com/en/market/product/5356 ) dayalı olarak grafikte harmonik desenler görüntüler ve iyi bilinen korHarmonik sürümlerinden birinin neredeyse tam bir analogudur. Gösterge aşağıdaki kalıpları ve çeşitlerini tanır: ABCD, Gartley (Butterfly, Crab, Bat), 3Drives, 5-0, Batman, SHS, One2One, Camel, Triangles, WXY, Fibo ve Vibrations. Ayarlarda varsayılan olarak yalnızca ABCD ve Gartley modellerinin görüntülenmesi etkinleştirilmiştir. Ters çizgi, karşı köşey

DİĞER EA'ları ÜCRETSİZ EDİNİN!!! DİĞER EA'ları ÜCRETSİZ EDİNİN!!! DİĞER EA'ları ÜCRETSİZ EDİNİN!!! DİĞER EA'ları ÜCRETSİZ EDİNİN!!! DİĞER EA'ları ÜCRETSİZ EDİNİN!!!
RSI Izgarası, RSI aşırı alım ve aşırı satım koşullarına dayanır ve ticaret piyasanın kaybeden tarafında olduğunda bir ızgara açar. RSI, teknik tüccarlara yükseliş ve düşüş fiyat momentumu hakkında sinyaller sağlar ve genellikle bir varlığın fiyat grafiğinin altında çizilir. Bir varlık genellikle RSI %70'in üzerinde olduğunda aşırı

Crazy Scalper mt5 Crazy scalper Crazy Scalper is a non-indicator trading robot that uses a scalping system that trades in two directions simultaneously (buys and sells). At the same time, multidirectional positions cannot be profitable, and one of the open positions will necessarily go to a loss. If there is a losing position, a lock (lock) is used. In turn, if the locking position has not fulfilled its role and the quote reversed, the withdrawal is used without loss, according to the averag

What is this indicator? This indicator draws a customized vertical, horizontal, or trend line at any position on the chart. To draw each line, press the hotkey and then click at any point on the chart. Each drawn line is synchronized with other charts by timeframe. (Each chart requires this indicator to be installed)
How to draw a vertical or horizontal line 1. Press the hotkey to enter drawing mode. 2. Move the mouse to any point. 3. Click to draw the line.
How to draw a trendline 1. Press t

* Düzeltilmiş ve hızlandırılmış zigzag. (Aralığı değiştirebilirsiniz) * Her yeni mum/bar da zigzag güncellenir. * İsterseniz buton aktif ederek, sadece butona tıkladığınızda patern arar. Otomatik yaparsanız grafik her yenilendiğinde arama yapar. * Sıklıklıkla kullanılan 17 adet harmonik patern ve kendi oranlarınızı belirleyebileceğiniz özel pattern. * Fiyat gösterimi ile grafiği sade tutabilirsiniz. İsterseniz üçgen gösterimi yapabilirsiniz. * "History Mode" ile geçmiş performansları inceleyebi
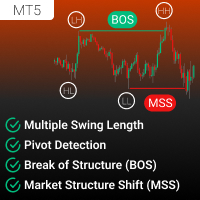
1TF BOS/MSS Göstergesi , piyasa yapısını doğrudan grafiğinizdeki tek bir zaman diliminde analiz etmek ve görselleştirmek için tasarlanmış güçlü bir araçtır. Bu gösterge, piyasa yapısı kırılmalarını (BOS) ve piyasa yapısı değişimlerini (MSS) hassas bir şekilde algılayarak, traderların kilit dönüş noktalarını ve trend devamlılıklarını kolaylıkla tespit etmelerini sağlar. Özelleştirilebilir ayarları ve ayrıntılı açıklamaları, traderlar için netlik ve güven sağlayan vazgeçilmez bir araç haline getir

Yahoo Finance verilerine otomatik olarak erişin ve MetaTrader 5'te özel semboller oluşturun. Gösterge veya Uzman Danışmanların aksine, bu hizmetin bir grafikte çalıştırılmasına gerek yoktur. Arka planda çalışır ve brokerınızın sunmadığı piyasa verilerini sürekli olarak günceller. Ana Özellikler: Özel piyasa verileri : VIX, DOLLARINDEX, T-Bond, SP500, NASDAQ100 ve Vanguard Total Stock Market (VTI), SPDR S&P 500 (SPY), iShares MSCI Emerging Markets (EEM), Invesco QQQ Trust (QQQ) gibi birçok ETF'ye

Full presentation and user guide here. Robotu 3 gün boyunca ücretsiz bir demo veya gerçek hesapta test etmek için lütfen MQL5 üzerindeki sohbet aracılığıyla benimle iletişime geçin ve kopyanızı isteyin.
Order Flow Analytics PRO'yu keşfedin, size piyasa akış analizi (Tape Reading) yapma görevini üstlenen ve grafik göstergelerin kullanımını gereksiz kılan bir robot. Robotumuz, işlemleri otomatikleştirmek için kullanılabilecek bir dizi araç oluşturmak için Times And Sales ve Sipariş Defteri bilgi

Introducing the Investment Castle Expert Advisor - the ultimate trend-based trading tool that comes with built-in Investment Castle and Psychological Key Levels indicators. Whether you're a novice or a seasoned trader, this powerful tool will help you make informed decisions and maximize profits. Features: Automated Support and Resistance Key Levels: Say goodbye to manual chart analysis! Our AI-driven software automatically identifies key levels of support and resistance, allowing you to make s
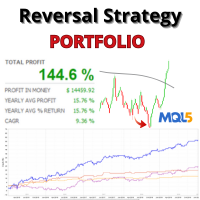
Low-Risk Portfolio – Expert Advisor Reversal Strategy This fully automated strategy is specifically designed to identify buying opportunities in AUDJPY , AUDUSD , and AUDCAD pairs. It focuses on capturing significant price movements away from the moving average, optimizing entries through advanced technical analysis and strict risk management. Key Features Mean Reversion Approach: Detects significant price deviations from the moving average, using Bollinger Bands to pinpoint extreme movements an

This EA utility helps Price Action traders calculate the risk as Big Money profesional traders do: as percentages of available funds. Allows to visually set a desired Profit:Risk ratio, where you want your stop-loss and take-profit levels. Optionally, enable a second and third orders to be placed simultaneously with different ratios and risk percentages. Great for BTMM, ICT, and other methodologies.
Very simple to use, just "point and shoot"!!! FREE limited version here .

The "Blockchain" Expert Advisor is based on the market consolidation algorithm. The algorithm is designed to determine the direction of price movement. Works on all instruments, including cryptocurrency. The Expert Advisor contains many combinations of trading settings, grid, using one order using stop orders. It is also possible to trawl the placed order. Enabling and disabling the EA operation mode. It can also be used as an indicator for manual trading. Sets are provided for three pairs of yo

Local Trade Copier is a professional utility designed to copy and synchronize trades between trading accounts. With its easy 1-minute setup, this trade copier allows you to copy trades between multiple MetaTrader terminals on the same Windows computer or Windows VPS with lightning-fast copying speeds of under 0.5 seconds.
Guide: https://youtu.be/QDhL_r8avzE
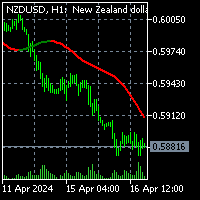
To download MT4 version please click here. - This is the exact conversion from TradingView: "Sentiment Range Ma" By "ChartPrime". - This is a non-repaint and light processing load indicator - You can message in private chat for further changes you need. - All input options are available. - Buffers are available for processing within EAs. - Highlight option is omitted as does not show good in Metatrader.
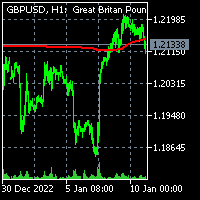
To get access to MT4 version please click here . - This is the exact conversion from TradingView: "Trend Regularity Adaptive Moving Average","TRAMA" By " LuxAlgo ". - This is a light-load processing and non-repaint indicator. - Buffer is available for the main line on chart. - You can message in private chat for further changes you need. Thanks for downloading

To download MT4 version please click here . This is the exact conversion from TradingView: "B-Xtrender" By "QuantTherapy". - It is an oscillator based on RSI and multiple layers of moving averages. - It is a two in one indicator to calculate overbought and oversold zones for different RSI settings. - This indicator lets you read the buffers for all data on the window. - This is a non-repaint and light processing load indicator. - You can message in private chat for further changes you need.

To download MT4 version please click here . - This is the exact conversion from TradingView: "Linear Regression Candles" By "ugurvu". - The screenshot shows similar results from tradingview and Metatrader when tested on ICMarkets on both platforms. - The overall look of the indicator is like Heiken Ashi. - It can be used as a trend confirmation indicator to detect the right trend direction. - This indicator lets you read the buffers for Candles' OHLC. - This is a non-repaint and light processing

Half Trend TPSL Buy Sell Indicator calculates the open and close of the price bars over the selected period of time and applies its own calculation method to find an average line of the price movement. ATR based Take Profit and Stop Loss ATR is a measure of volatility over a specified period of time. The most common length is 14, which is also a common length for oscillators, such as the relative strength index (RSI) and stochastics. A higher ATR indicates a more volatile market, while a lowe

Moving Average Crossover Scanner and Dashboard For MT5 Advanced Moving Average Scanner Moving Averages Crossover Dashboard MT4 Version of the product can be downloaded: https://www.mql5.com/en/market/product/69260 The indicator scans the market and sends signals and alerts for Moving Average crossovers, death cross and golden cross.
Crossovers are one of the main moving average ( MA ) strategies.
MA Crossover ( cut ) strategy is to apply two moving averages to a chart: one longer and one sho
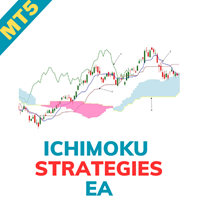
Ichimoku Strategies Expert Advisor for MetaTrader 5 Introduction: Welcome to the Ichimoku Strategies EA, an advanced tool designed exclusively for MetaTrader 5. This expert advisor streamlines trading activities by harnessing the power of the Ichimoku indicator, automating trade entries and exits based on 6 different strategies. The EA also facilitates reverse trading setups within these zones, offering a versatile approach to managing trades. For detailed documentation General Settings

Revolutionary Forex expert advisor, built on the principles of the unique Recovery trading system. The key to the effectiveness of this algorithm is the accurate analysis of price behavior near psychologically important round levels. Moreover, the system uses a special price representation in the form of coordinates different from traditional candlestick charts. Main advantages of the advisor: Recovery strategy, based on price recovery High accuracy in identifying key support and resistance leve

MACD ADX Oscillator – a powerful indicator that combines the best of the Moving Average Convergence Divergence (MACD) and the Average Directional Index (ADX) to provide unparalleled insights into market momentum and trend strength.
Key Features: Dual Momentum Analysis: This indicator merges MACD's ability to detect changes in market momentum with ADX's strength measurement, giving you a comprehensive view of the market's direction and power. Customizable Settings: Tailor the indicator to your t

Every indicator has its advantages and disadvantages. Trending ones show good signals during a trend, but lag during a flat. Flat ones thrive in the flat, but die off as soon as a trend comes. All this would not be a problem, if it was easy to predict when a flat changes to a trend and when a trend changes to a flat, but in practice it is an extremely serious task. What if you develop such an algorithm, which could eliminate an indicator's flaws and enhance its strengths? What if such an algorit
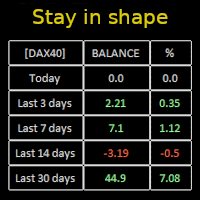
Constantly monitor the progress of your trading at daily intervals of your choice. For positive readings - maintain discipline and stick to your strategy. In case of gradually worsening results - react as soon as possible.
Be aware of the quality of your work!
The panel calculates the account balance You can track your progress for both the current instrument and the entire account The number of days back (5 items) - you set freely Learning to count days: if today is October 3 (day number
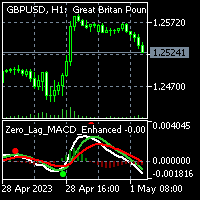
To get access to MT4 version please click here . This is the exact conversion from TradingView: "Zero Lag MACD Enhanced - Version 1.2" by " Albert.Callisto ". This is a light-load processing and non-repaint indicator. All input options are available. Buffers are available for processing in EAs. You can message in private chat for further changes you need. Thanks
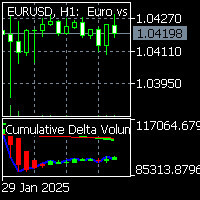
To get access to MT4 version please click here . This is the exact conversion from TradingView: "Cumulative Delta Volume" by "LonesomeTheBlue". The screenshot shows similar results from tradingview and Metatrader when tested on ICMarkets on both platforms. This is a light-load processing and non-repaint indicator. All input options are available. Buffers are available for processing in EAs. You can message in private chat for further changes you need. Thanks for downloading

To get access to MT4 version please click here . This is the exact conversion from TradingView: "[SHK] Schaff Trend Cycle (STC)" by "shayankm". This is a light-load processing indicator. This is a non-repaint indicator. Buffers are available for processing in EAs. All input fields are available. You can message in private chat for further changes you need. Thanks for downloading
To get access to MT4 version please click here . This is the exact conversion from TradingView:"HIGH AND LOW Optimized Trend TrackerHL OTT" by "kivancozbilgic" This is a light-load processing indicator. It is a non-repaint indicator. All input options are available. Buffers are available for processing in EAs. You can message in private chat for further changes you need. Thanks.
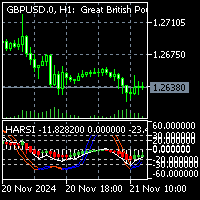
To get access to MT4 version please click here . This is the exact conversion from TradingView:"Heikin Ashi RSI Oscillator" by "jayRogers" The screenshot shows similar results from tradingview and Metatrader when tested on ICMarkets on both platforms. This is a light-load processing indicator. It is a non-repaint indicator. I removed colored areas option to fit into metatrader graphics. Buffers are available for processing in EAs. You can message in private chat for further changes you need.

To get access to MT4 version please click here . This is the exact conversion from TradingView: "SwingArm ATR Trend Indicator" by " vsnfnd ". The screenshot shows similar results from tradingview and Metatrader when tested on ICMarkets on both platforms. Also known as : "Blackflag FTS" by "Jose Azcarate" This is a light-load processing and non-repaint indicator. All input options are available except multi time frame. Buffers are available for processing in EAs. Extra option to show buy and sel

Point and Plot: The Anchored VWAP with Channel Bands tool is designed for traders of all levels, from beginners to seasoned professionals. Point to the price level you want to anchor to, plot the horizontal line, and watch as this versatile tool transforms your trading approach. User-Friendly Interface : Navigate the tool effortlessly with a user-friendly interface that ensures you never miss a crucial detail. Real-Time Analysis : Make informed decisions in real time with dynamic data that upda
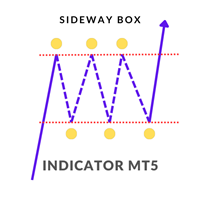
Sideway Box Indicator
The Sideway Box Indicator is an advanced trading tool designed to help traders identify and capitalize on sideways market conditions. This powerful indicator detects periods when the market is in a sideways (ranging) phase, providing traders with clear visual cues. Key Features
Sideways Market Detection : The Sideway Box Indicator accurately identifies sideways market conditions, allowing traders to recognize when the price is consolidating within a specific range. Buy/Sel

6-BAND VWAP (Volume Weighted Average Price)
Fully customized and EA-friendly VWAP Bands Indicator.
Main Features:
Choose the period of VWAP calculation reset (Daily, Weekly or Monthly): For day trading use the Daily VWAP, and for longer term analysis use the Weekly or Monthly calculations. Choose how many bands (deviations) you want to show, up to 6. Choose zero to display only the main VWAP line. Fine adjustment of the deviation of the bands: Find the best band’s deviation for the instrum

Se você já ouviu falar do Método de Wyckoff, Análise de dispersão de volume, etc., com certeza chegou até aqui para buscar o indicador que lhe faltava!! Nosso indicador é capaz de lhe mostrar a dispersão de volume negociado pelos grandes players durante todo o período de negociação!
E o grande diferencial deste tipo de abordagem é a capacidade que este indicador possui de lhe mostrar onde está armado o "ACAMPAMENTO" dos BigPlayers e, assim, tirar o melhor proveito em seus trades, entrando junt

Robô Ultra Dinamic Keltner
é um expert que utiliza os canais de keltner como principal forma de sinal.
O Robô possuem três setups
Rompimento das bandas Toque nas Bandas Retorno ao centro que é o Fechou Fora Fechou Dentro Configurações básicas do expert são
Volume (Tamanho do lote a ser negociado) Stop Loss em Pontos Take Profit em Pontos Configuração de horário para inicial Configuração de horário para enviar ordem Metas Financeiras Perda máxima no dia Lucro Máximo no dia Martingale Breake

The indicator monitors the Dinapoli MACD trend in multiple timeframes for the all markets filtered and shows the results on Dashboard.
Key Features Indicator can be used for all markets Monitors every timeframe, from 1 Min to Monthly
Parameters
UseMarketWatch: Set true to copy all symbols available in market watch MarketWatchCount : Set the number of symbols that you want to copy from the market watch list. CustomSymbols: Enter the custom symbols that you want to be available in dashboard. Ti

The order block locator is powered by three main search algorithms thar can be used to find order blocks. Simple Fractal Search Algorithm Naive Fractal Movers Algorithm
Candle Transition Algorithm You can even combine the power of your 2 favourite algorithms and get the best of both worlds: Mixed Algorithm (Naive Fractal + Candle transition) Mixed Algorithm (Simple Fractal + Candle Transition
Simple Fractal Search Algorithm
The algorithm finds the fractals based on your setting paramers for c

SpinSpike Detector is an amazing New Deriv MT5 indicator on the Market which detects Spikes and Crashes on Boom and Crash pair with more than 90% Accuracy . This indicator will give alerts before a spike or a crash so that you get ready to strike. The Indicator will only work for Boom and Crash pairs and will not work on any pair and it will give errors. This is a Non-Lag Indicator as witnessed by its stagnant arrows on chart which do not move. You can scalp all the day with this wonderful ind

Description ea-PartialClose&VirtualTrailing – fully automated advisor for transaction support. Version = Multi = provides support for any BUY or SELL positions. The adviser almost perfectly averages profit and loss. In open positions, it is recommended to use Stop-Loss, and do not set TakeProfit, which limits profit during sharp surges of the symbol price. The trailing process is virtual, since each movement of the levels that are responsible for a certain part of the position does not modify th

The Simple ICT Concepts Indicator is a powerful tool designed to help traders apply the principles of the Inner Circle Trader (ICT) methodology. This indicator focuses on identifying key zones such as liquidity levels, support and resistance, and market structure, making it an invaluable asset for price action and smart money concept traders. Key Features Market Structure : Market structure labels are constructed from price breaking a prior swing point. This allows a user to determine the curr

Hareketli Ortalama (MA) göstergesinin çok para birimi ve çok zaman çerçeveli modifikasyonu. Kontrol panelinde göstergenin mevcut durumunu görebilirsiniz - Hızlı MA ve Yavaş MA'nın kırılmaları ve dokunuşları (fiyata göre) ve ayrıca MA çizgilerinin birbirleri arasındaki kesişimi (hareketli ortalama geçiş). Parametrelerde istediğiniz para birimini ve zaman dilimlerini belirleyebilirsiniz. Ayrıca gösterge, fiyatın çizgilere temas etmesi ve geçişleri hakkında bildirimler gönderebilir. Noktalı bir hü

Live Trading Results MT4 Version Contact for Manual Guide Next Price $125 Free Scanner Dashboard (Contact me)
Strategy - Breakout / Retest / Aggressive Hello Everyone, We are excited to introduce one of the most reliable and high win rate patterns in trading: the Cup and Handle . This is the first time we are releasing this meticulously crafted indicator, boasting an impressive 95% success rate . It is versatile and effective across all types of pairs, stocks
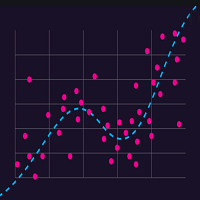
The Regression Channel consists of two lines equidistant above and below the regression trend line. The distance between the channel boundaries and the regression line is equal to the deviation of the maximum closing price from the regression line, only this definition corresponds to the most recent regression points.
The term regression refers to the field of statistics. The center line of the channel is the trend line. To calculate it, the method of least squares is used. The line above the

Arrow Simulator mt5 gives buy and sell signals based on non repaint arrow logic
It also shows take profit and stop loss placement based on average true range
Also provided is a simulation panel in the corner to show how the signals performed over a set number of bars
When running in strategy tester or live lower the number of bars to reduce using pc resources and speed up back testing
Filter out arrows with the ma filter if needed and choose your trading time
Default settings is for 5m EUR
There are many linear regression indicators out there, most of them draw lines or channels, but this one actually draws a chart. This indicator also alow user show MA line on chart. So buy signal is when red candle and crossdown with MA line and vice versal. Following MA type is supported: SMA EMA RMA WMA This simple mineset but powerfull KISS - Keep it simple, stupid :D

If you want a reliable seconds chart that works properly, look no further.
This utility here uses tick data to create a precise seconds chart. You just need to load it on a M1 chart and choose how many seconds you want the chart to be.
The utility creates an offline chart that gets updated on every tick so it behaves as if it were a live chart. It receives tick data so you can load custom indicators on it.
It's not possible to trade from the seconds chart.
The screenshots below show a 30 se

This utility solves the problem of Metatrader not having the capacity to create custom session times, all markets are displayed forcefully in a 24h format.
Lots of traders prefer to ignore the overnight action and focus only on NY session and use the overnight gaps as part of their trading strategy.
ICT teaches this as "opening range gap", it's the gap between NY session end (16:15) and NY session start (09:30).
The default setting in this utility reflects the RTH (Regular Trading Hours) opti

The Bheurekso Pattern Indicator for MT5 helps traders automatically identify candlestick pattern that formed on the chart base on some japanese candle pattern and other indicator to improve accurate. This indicator scans all candles, recognizes and then displays any candle patterns formed on the chart. The candle displayed can be Bullish or Bearish Engulfing, Bullish or Bearish Harami, and so on. There are some free version now but almost that is repaint and lack off alert function. With this ve

Equity Control expert advisor - this is a tool for controlling your account funds. It allows you to limit the general and daily drawdown, number of simultaneously existing positions, as well as the equity increase. The acceptable general drawdown can be set not only from the current account balance value, but also below this value. Which is convenient if you deal with Prop Firms. Daily drawdown is calculated from the balance value or equity if it is higher than the balance value. If the drawdown
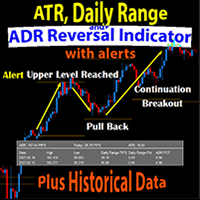
The Daily Range ATR ADR Reversal Indicator shows you where price is currently trading in relation to its normal average daily range. You will received alerts via pop-ups when price exceeds its average daily range. This will enable you to identify and trade pullbacks and reversals quickly.
The Indicator also shows you the Daily Range of Price for the current market session as well as previous market sessions. It shows you the ATR which is the average range of pips that a candle may move in that

This indicator gives you arrows, two SR lines and a golden trend line. Uses a special trend algorithm to plot the arrows, combined with support and resistance inputs. Perfect for channel trading. Features alert functions.
Parameter TrendArrowPeriod. Parameter TrendLinePeriod. (Change to your preference) How to use: Simply attach to any chart with default settings. Zoom in the chart, to see the two blue SR lines and arrows more clearly. When the blue SR line is below the price, golden trend line
OPTMIZE EA BEFORE BACKTEST AND USE. YOU MUST UNDERSTAND THIS BEFORE PURCHASE FTMO Minute Master is a trading Expert Advisor made for the FTMO Intraday Prop Trading program. This EA operates exclusively on XAU/USD 1-minute charts, leveraging lightning-fast algorithmic strategies to identify and execute precise entry and exit points in the world of intraday trading. Its primary goal is to optimize risk management while seeking consistent profits in the dynamic intraday market environment. FTMO Mi

The Gann Scalping Gold Indicator is a robust technical analysis tool designed for precision trading in gold markets. It leverages Gann-based methodologies to identify key price levels, enabling traders to anticipate potential market reversals, breakouts, and areas of consolidation. Daily Reset Logic: Automatically resets touch statuses at the start of a new trading day, ensuring that the indicator aligns with fresh daily trends. How It Works: The indicator draws horizontal lines at predefine
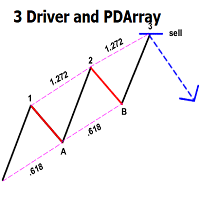
This indicator automatically identifies the SMC 3-Drive pattern and sends notifications to users when the pattern is detected. Additionally, the indicator identifies PDArray (including FVG and OB) and offers an option to combine the 3-Drive pattern with PDArray. This combination provides users with more reliable signals. What is the 3-Drive Pattern? This pattern is formed by three price pushes in one direction, providing a strong reversal signal (Figure 3). The key to identifying this pattern is
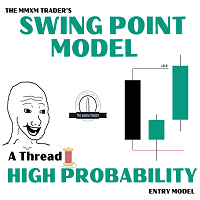
Introducing the Swing Point Model Indicator – A Professional Trading Tool The Swing Point Model Indicator is an innovative tool designed for traders who want to capture market structure and identify potential trading opportunities. With a logical and transparent approach, the Swing Point Model helps you gain deeper market insights and make precise trading decisions. This is multiple Timeframe indicator so you can choose Higher timeframe for detect Swing point model What Is the Swing Point Model?
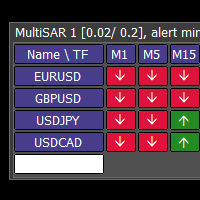
This tool monitors Parabolic SAR indicators on all time frames in the selected markets. Displays a table with signals to open a BUY trade (green) or SELL trade (red). You can easily add or delete market names / symbols. If the conditions for opening a trade on multiple time frames are met, you can be notified by e-mail or phone message (according to the settings in MT5 menu Tools - Options…) You can also set the conditions for sending notifications. The list of symbols/ markets you have entered

EXPER ADIVSOR that gets economic news calendar from forexfacotry.com and calculates time until next news happen or since last news happened. It shows exactly same output as ffcal for MT4 by Derk Wehler, original version may be available at forexfacotry
This version is clean, done WITHOUT ANY DLL IMPORTS !!!
Additionally it creates excel file with latest news in your datafolder-> ".../MQL5/Files" , (* so this data can be used if you want to use news in EA , just load data from this file, I
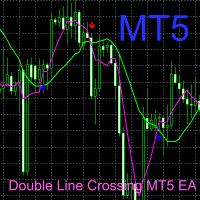
This is based on the double moving average cross and arrow mark under the preparation of custom indicators EA.
When the blue arrow appears, make a long order.
When the red arrow appears, short the order.
When the pink line crosses the green line upward, the pink line is above, the green line is below, the golden fork appears, and the blue arrow appears.
When the pink line crosses the green line downward, the pink line is below and the green line is above. There is a dead fork and a red arro

This is diamond! Contact me to send you instruction and add you in group.
Diamond Pattern is based on Read The Market(RTM) concepts. The purpose of this model is to face the big players of the market (financial institutions and banks), As you know in financial markets, big traders try to fool small traders, but RTM prevent traders from getting trapped. This style is formed in terms of price candles and presented according to market supply and demand areas and no price oscillator is used in i

MT5 RSI Experiment: This indicator leverages the Relative Strength Index (RSI) and floating levels to pinpoint potential buy and sell signals.
The code uses enums for prices and RSI calculation methods. These enums define indicator parameters.
Input variables include RSI period, price type for RSI calculation, smoothing method, and look-back period with levels for floating levels.
Index buffers store RSI fill, RSI up line, RSI middle line, RSI down line, and trend line data.
For each bar, i

Indicator basic idea is buy strong currency and sell weak currency. If A/B currency pair is in an uptrend, it shows if it is due to A strength or B weakness.On these signals one can choose the most optimal pair to trade. You can use Currency Power System for pattern trading as well, among basic patterns which can be used are: cross trend break divergencies So much for theory. I searched for a ready-made indicator (Currency Strength) to support my trade but did not find one. Well. I have to wr

EA de Long & Short para B3 BOVESPA BMF IBOV Link para entender como funciona a parametrização e o painel de controle mql5.com/pt/blogs/post/757181
Esse Expert Advisor (EA) foi desenvolvido para realizar operações de Long & Short na Bolsa de Valores de São Paulo (B3 BOVESPA), podendo funcionar tanto em formato de Day Trade quanto de Swing Trade. Ele automatiza o processo de identificação de oportunidades de negociação entre dois ativos (Símbolo 1 e Símbolo 2), aproveitando as discrepâncias de pr

Weis Wave Box ile analizlerinizi bir üst seviyeye taşıyın! Eğer ticaretinizde hassasiyet ve netlik arıyorsanız, Weis Wave Box ihtiyaç duyduğunuz araçtır. Bu ileri düzey gösterge, hacim dalgaları ve swing noktalarının ayrıntılı görsel analizini sunarak, piyasalarda çaba ve sonuç arasındaki ilişkiyi daha iyi anlamanıza yardımcı olur. Weis Wave Box’ın Başlıca Özellikleri: Kişiselleştirilebilir Hacim Dalgaları: Ticaret stratejilerinize uygun olarak hacim dalgalarını tik bazında ayarlayın.
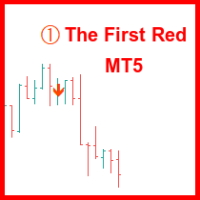
"The First Red" göstergesi, Dariusz Dargo tarafından oluşturulan stratejiye dayalı olarak geliştirilmiştir. Bu gösterge, "The First Red" stratejisi ve "Second Red," "First Green" ve "Second Green" gibi genişletme koşullarını karşılayan mumları grafik üzerinde belirlemek ve işaretlemek için tasarlanmıştır. Strateji, yerel aşırılıkların ve MACD osilatöründen gelen sinyallerin analizine odaklanır. İlk Kırmızı Mum (First Red Candle): Bir mum, yerel bir maksimum oluşturduğunda ve MACD histogramı dü
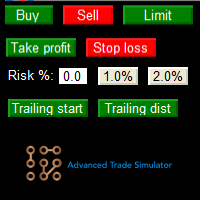
Advanced Trade Simulator for MT5
It is an indicator you can attach to any chart and then buy and sell the given symbol virtually. No actual trading takes place. You can attach it to multiple charts. Then you can buy multiple symbols.
A more detailed description here: https://www.mql5.com/en/blogs/post/750336 Features:
- buy and sell immediately on the given time frame - market , limit and stop orders - generalized OCO, more than 2 orders can cancel each other. - OSO, one sends another.. - bu

TickCounter göstergesi, her yeni çubukta yukarı ve aşağı keneleri sayar.
Hesaplama, gösterge tabloya yerleştirildiği andan itibaren başlar.
Histogram çubukları şunları temsil eder: Sarı çubuklar - toplam kene sayısı; Mavi çubuklar - YUKARI işaretler; Kırmızı çubuklar - AŞAĞI işaretler. Mavi çubuk görünmüyorsa, daha fazla aşağı onay işareti vardır ve kırmızı çubuk mavi olanın üzerinde görüntülenir (kırmızı katman mavi olanın üzerindedir). MT4 version: https://www.mql5.com/en/market/product/82
MetaTrader mağazası, MetaTrader platformu için uygulama satın almak adına rahat ve güvenli bir ortam sunar. Strateji Sınayıcıda test etmek için Uzman Danışmanların ve göstergelerin ücretsiz demo sürümlerini doğrudan terminalinizden indirin.
Performanslarını izlemek için uygulamaları farklı modlarda test edin ve MQL5.community ödeme sistemini kullanarak istediğiniz ürün için ödeme yapın.
Alım-satım fırsatlarını kaçırıyorsunuz:
- Ücretsiz alım-satım uygulamaları
- İşlem kopyalama için 8.000'den fazla sinyal
- Finansal piyasaları keşfetmek için ekonomik haberler
Kayıt
Giriş yap
Gizlilik ve Veri Koruma Politikasını ve MQL5.com Kullanım Şartlarını kabul edersiniz
Hesabınız yoksa, lütfen kaydolun
MQL5.com web sitesine giriş yapmak için çerezlerin kullanımına izin vermelisiniz.
Lütfen tarayıcınızda gerekli ayarı etkinleştirin, aksi takdirde giriş yapamazsınız.