YouTube'dan Mağaza ile ilgili eğitici videoları izleyin
Bir alım-satım robotu veya gösterge nasıl satın alınır?
Uzman Danışmanınızı
sanal sunucuda çalıştırın
sanal sunucuda çalıştırın
Satın almadan önce göstergeyi/alım-satım robotunu test edin
Mağazada kazanç sağlamak ister misiniz?
Satış için bir ürün nasıl sunulur?
MetaTrader 5 için ücretli Uzman Danışmanlar ve göstergeler - 147

The Interesting Thing indicator visually unloads the price chart and saves analysis time: if there is no signal, there is no deal, if an opposite signal appears, then the current deal should be closed. This is an arrow indicator for determining the trend.
The indicator implements a trend trading strategy, filtering and all the necessary functions built into one tool! The principle of operation of the indicator is to automatically determine the current state of the market when placed on a chart

The Checkpoints indicator implements an advanced algorithm for visualizing the market trend. The main application of the indicator is to generate buy and sell signals.
Determining the market trend is an important task for traders. Probably, almost every trader has dreamed of non-lagging MAs at least once. I have embodied this dream in my indicator. With this indicator, you can predict future values.
The indicator is designed to determine either a trend or short-term buy or sell signals. The

Our Trend entry points should be used as potential market reversal points. The indicator works using the cyclic-wave dependence function. Thus, all entry points will be optimal points at which movement changes.
The simplest use case for the indicator is to open a trade in the direction of an existing trend. The best result is obtained by combining the indicator with fundamental news; it can act as a news filter, that is, show how the market reacts to this or that news.
The default indicator s

This multicurrency Expert Advisor uses 28 currency pairs. For predictions, the advisor uses models trained by the machine learning algorithm in the Python language environment. All signals of this advisor in real time and settings for it can be downloaded from my website forexvisible.com - copy and paste into the browser
The Expert Advisor can work with two time intervals H1 and H2 together or separately parameters in the Use Time Intervals group The profitability of currency pairs can be view

The indicator Supply Demand RSJ PRO calculates and plots the "Supply" and "Demand" zones on the graph, identifying the type of Zone (Weak, Strong, Verified, Proven) and in case of retests of the Zone it shows how many times it was retested. "Supply" Zones are the price zones where more supply than demand has occurred, driving prices down. "Demand" Zones are the price zones where more demand than supply has occurred, pushing prices up.
Be sure to try our professional version with configurable fe

Make your Take Profit, Stop Loss, and Trailing Stop levels invisible to the broker! Main option: STEALTH MODE Virtual Trailing Stop Virtual Take Profit Virtual Breakeven Virtual Stop Loss Virtual Orders Lifetime WARNING: The Expert Advisor does not place orders by itself. You must open orders yourself (including through the Expert panel) or use a third-party Expert on another chart of the same currency pair. Please specify the Magic number "-1" in the Expert settings for the Expert to process th

/ ********** ********** ********** ********** ********** ********** ********** ********** ********** ********** / Big Sales for Easter! Price is reduced > 50 % already! Grasp the chance and Enjoy it! / ********** ********** ********** ********** ********** ********** ********** ********** ********** ********** /
This is a powerful EA that support single order strategy, martingale strategy, multiple timeframes strategy, etc with lots of useful indicators and self defined

Sepet
Yapabileceğiniz en iyi şey, siparişlerinizi kayıplara dönüşmekten korumaktır. Artık rahatlayabilir ve UR Basket'in halletmesine izin verebilirsiniz.
UR Sepeti kullanmanın avantajları:
Tüm parametreler grafiğinizdeki grafik panelinde dinamik olarak değiştirilebilir - Parametreleri değiştirmek veya hangi ayarları kullandığınızı hatırlamak için EA'yı yeniden başlatmanız GEREKMEZ! Siparişlerinizi şu adresten takip edebilirsiniz: - Sihirli sayı - EA Yorumu - Yukarıdakilerin ikisi de
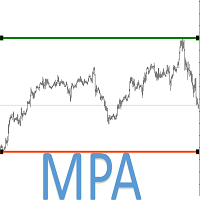
M P A (Multipair Price Action ) It is a multipair system, which uses the value of the support and resistance in the majors to detect the entry points in the EURUSD.
!!!!!IMPORTANT!!!!! THIS EA IS FOR USED IN EURUSD ONLY. !!!!!IMPORTANT!!!!!
This system uses only one operation at a time. It does not use hedging or marging systems, all operations have Stoplost, Take Profit and trailing stop, configurable. The system also allows you to configure the parameters of the value of the pairs in you

Find out in real time which side, buy or sell, is putting the most pressure through a simple and efficient visualization of Depth of Market. The indicator calculates the amount of offers at the specified depths and displays the percentage on each side in relation to the total. PressureBook Indicator is fully customizable, in which you can: Select which symbol you want to track. By default, the selected symbol is the same as the graph in which the indicator was inserted; Define the amount of pri

Pivot Point Multi Method MT5 Pivot Point Multi Method MT5 is a fully automatic pivot point indicator and indicate support and resistances (S1,S2,S3,S4,R1,R2,R3,R4) based on four Methods that you can select on of them Pivot point detection and drawing support resistances Methods( Classic ,Camarilla ,Woodie ,Fibonacci)
Pivot Point Multi Method Mt5 is working on all time frames and all currency pairs and gold silver and crypto currencies .
Recommended Setting : Pivot_Method select one of t
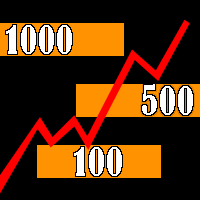
The indicator builds "psychological levels": levels of round numbers and intermediate levels of round numbers.
Round numbers play an important role in forming support and resistance levels. There is a pattern in which the decline or growth of the price can stop at round numbers.
The level whose price ends at 0 is the level of a round number of the first order. Intermediate level, this is the level between two round levels, for example, between 10 and 20 this is level 15.
In the " Num_Zeros "

Description: TrendAccess can optimize your trading time by showing you the trend via two different calculation modes quick and easy.
No more searching for Trends. Just open the chart and look at the trend display.
Features: Shows Uptrend, Downtrend and "No Trend" indicator
Shows the calculated ZigZag Profile
Works on all timeframes Two different calculation Modes (MACD and Candle-based calculation)
Settings: Variable
Standard Value Description
Calculation Mode
Candle based
Choose betwe
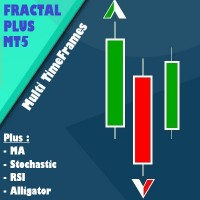
Fractal Plus is a trading tool in the form of an expert advisor. I n it there are 1 indicators that are position execution and 4 indicators that function as filters. You can choose whether each indicator is active or not, it can even be combined according to your trading needs. All filter indicators have multi timeframes options.
Indicators as execution position: 1. Fractal
4 Indicators as Filter: 1. Moving Averages 2. Stochastic Oscillator 3. RSI 4. Alligator
Parameter Information: - Lot Mo

Description. This EA base on Accelerator oscillator indicator and Parabolic sar indicator. Accelerator oscillator details. set = iAC(_Symbol,_Period); Parabolic sar details. set = iSAR(_Symbol,_Period,0.02,0.2); This is only Buy EA. This EA fixed details in side. Only input is volume. Because i need to keep it simple. Buy order when Accelerator oscillator indicator and Parabolic sar indicator had a signal for buy. Close order when Accelerator oscillator indicator and Parabolic sar indicator had

https://www.mql4.com The price trend indicator
The price trend indicator accurately shows the changes in market prices , At the same time, this index also shows the future trend of the market price . The indicator does not redraw and does not lag. The recommended time frame is not less than H1 . When the market price is in the light green range, the market is in the rising range, and when the market price is in the light purple range, the market is in the falling range
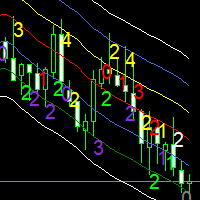
Moving averages are a simple and serious indicator for evaluating the development of a price. But which configuration to choose? 12 periods ? 20 periods? There is not a single moving average setup for all instruments, at all times, for all time periods, simply because not all instruments have the same volatility, they are all very different. They have a signature. The Signature App is a powerful decision support tool. It is based on the use of moving average envelopes. The program calculates th
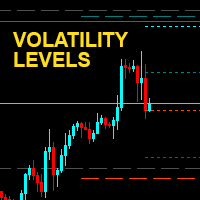
Transfer volatility levels to the chart to understand the nature of the ongoing movements. The levels are calculated based on the volatility recorded in the last few sessions. Easily identify possible targets or swing points for intraday , daily and weekly trading. In addition, the round price levels considered most important are also visible, here the highest trading volumes are usually concentrated. NO REPAINT
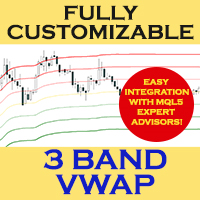
3-BAND VWAP (Volume Weighted Average Price)
Fully customized and EA-friendly VWAP Bands Indicator
MAIN FEATURES:
Choose the period of the VWAP calculation reset (Daily, Weekly or Monthly): For day trading use the Daily VWAP, and for longer term analysis use the Weekly or Monthly calculations.
Fine adjustment of the deviation of the bands: Find the best band’s deviation for the instruments you trade and adjust accordingly.
Customize line colors, style and width according to your chart p

Capital protector MT5 is an Expert Advisor who works based on the profit and loss of your account. Its functions include: Closing of all orders when a certain profit or loss is reached. Remove any other Expert Advisor installed on a secondary chart when a certain profit or loss is reached. Send a notification to the mobile when a certain loss or profit is reached. To configure the Expert Advisor you will only have to program the loss limit that you are willing to lose or the profit limit that

This MT5 indicator, Bull Bear Visual MTF V2, summarize the strength color graphic and percentages of power for both Bull and Bear in current market emotion stage which will show you in multi timeframes (21) and sum of the total Bull and Bear power strength which is an important information for traders especially you can see all Bull and Bear power in visualized graphic easily, Hope it will be helpful tool for you for making a good decision in trading.

ADX is one of the most versatile indicators, understanding it can help you understand the true nature of movements. It is often used within automatic experts to filter input signals. Unfortunately in its original form it is not immediately understandable. This version aims to simplify its reading by transferring the burden of interpreting its values to the code. The result is a clear graph where it is easy to identify the accumulation and distribution phases, trend phases and excesses. The color
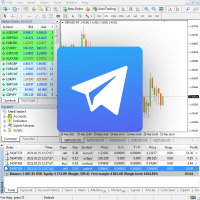
Сообщения в Telegram из MT5 о торговых событиях: Открытие/закрытие сделок; Выставление/удаление отложенных ордеров. Версия утилиты для MT4 здесь: https://mql5.com/8bjjy Настройки Telegram:
Создайте своего бота. Для этого напишите для пользователя @BotFather команду /newbot , и следуйте инструкциям. В результате вы получите Token бота, примерно такой: 1245680170:BBGuDFVkTYIPtjSaXMgQEhdfg7BOQ6rl8xI. Узнайте свой ID в Telegram, для этого напишите пользователю @userinfobot любое сообщение.

This MT5 indicator, Bull Bear Visual MTF (21 Time Frames), summarize the strength color graphic and percentages of power for both Bull and Bear in current market emotion stage which will show you in multi time frames and sum of the total Bull and Bear power strength which is an important information for traders especially you can see all Bull and Bear power in visualized graphic easily, Hope it will be helpful tool for you for making a good decision in trading.

This algorithm is based on the grid strategy and performs dynamic position management to make it work on netting accounts. Unlike other robots, this grid system bases its entries on profit over time of the asset instead of using pips. This parameter is the one that corresponds to "Average Distance".
You can trade all 28 major currencies simultaneously. Parameters: +------------------------------------------------------------------+ :-:-:-:-:-:-:-:EXPERT SETTINGS:-:-:-:-:-:-:-: +---------------

A "Volume Profile" is an advanced charting indicator that displays total volume traded at every price level over a user specified time period. The main components of the volume profile are POC ( Point Of Control - the price level, at which the maximum number of contracts were executed during a selected period), VAH ( Value Area High - the highest price in the Value Area) and VAL ( Value Area Low - the lowest price in the Value Area).
When we settled on the original indicator, we spent a lot of

Описание индикатора будет крайне коротким. Индикатор Коридор тренда показывает трейдерам зону в которой находится валюта и даёт понимание по какому тренду движется рынок. Визуально очень хорошо воспринимается. Уровни взяты и просчитаны не просто. Полезный индикатор для арсенала индикаторов трейдера. The description of the indicator will be extremely short. The Trend Corridor indicator shows traders the zone in which the currency is located and gives an understanding of which trend the market is

Индикатор RSI MT5 - это индикатор Metatrader 5, и суть этого технического индикатора заключается в преобразовании накопленных исторических данных на основе индикатора RSI. Сигналы показаны разными цветами свечей. Смотрите настройки, тестируёте. Это очень полезный индикатор и он точно должен быть у вас . The RSI in candlelight MT5 indicator is a Metatrader 5 indicator, and the essence of this technical indicator is to transform the accumulated historical data based on the RSI indicator. Signals a

Deflection MT5 (MT4 version https://www.mql5.com/ru/market/product/63276 ) - a trend following expert advisor. It is based on strategy of searching entry points in the beginning of a trend. 2 EMA are used for a signal determination. Deflection has an adaptive system of profit and losses targets calculation which is based on current volatility. The control of risks is managed by TP/SL ratio and via setting risk per trade of a balance amount. Stop Loss and Take Profit targets in points are calc

" A trading range occurs when a financial instrument trades between constant high and low prices over a period of time. The upper part of the trading range of a financial instrument often provides price resistance, while the lower part of the trading range usually offers price support. Traders can enter in the direction of a breakout or breakdown from a trading range... "
This is the "Classical Theory" understanding of ranges. We have a different understanding of the nature of ranges and the

Индикатор Trading Strategy призван помочь трейдерам в поиске оптимальных входов в сделку и выходов из неё. В его основе лежат показания технических индикаторов (MA, RSI, ATR и др.), а также авторский алгоритм, связывающий их сигналы в единое целое. Индикатор даёт сигналы на покупку и продажу в виде стрелочек: стрелочка вверх — сигнал на покупку, вниз — на продажу. В правом верхнем углу показаны сигналы индикатора на 6 таймфреймах (M1, M5, M15, M30, H1, H4) данной валютной пары. Индикатор свои з

The MA Bounce Strategy is a strategy that seeks to long FX pairs on a strong uptrend as they bounce off their MA support and shorting FX pairs on a strong downtrend as they bounce off MA resistance. The best suitable periods of moving averages for that strategy are 18, 30, 50. This indicator helps to identify and find place for potential market entry by MA bounce strategy. More information about MA Bounce Strategy can be read by this link https://www.mql5.com/en/blogs/post/743037 . By defaul
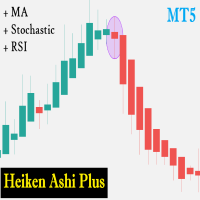
Heiken Ashi Plus is a trading tool in the form of an expert advisor. This EA works based on the change in the color of the Heiken Ashi candle. called a plus because there are additional indicators such as Moving Averages, Stochastic and RSI which you can combine its use with Heiken Ashi candles.
Update V2. = Add Multi TimeFrames Features
Explanation of EA parameters LotMethod : 1 = Fixed Lot, 2 = RiskLot (Freeze of Balance), 3 = Martingale System TrailingStart : Trailing will activated after
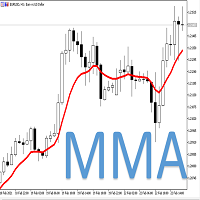
This system use M M A (Multipair Moving Average ) It is a multipair system, which uses the value of the averages in the majors to detect the entry points in the EURUSD.
!!!!!IMPORTANT!!!!! THIS EA IS FOR USED IN EURUSD ONLY. !!!!!IMPORTANT!!!!!
Only one operation at a time. It does not use hedging or marging systems, all operations have Stoplost, Take Profit and trailing stop, configurable. The system also allows you to configure the parameters of the averages that give us the entry and the
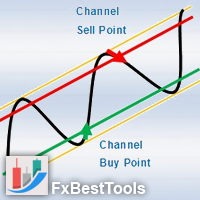
Channels Indicator is an All-In-One Indicator with a powerful calculation engine. The Indicator contains 4 different and usual methods for finding channels on the market. Indicator is powered by a visual interface and with various selections of alerts and notifications.
Testing Indicator : Strategy Tester does not respond to your clicks on panels (This is metatrader tester limitation). Thus input your desired settings on the indicator pre-settings and test.
Using Indicator :
Display 4 Typ

This easy to setup indicator shows you the market volumes in a different way, with support and resistance as showed. You can setup: - Backdays volume to show - Heiken Ashi candle view It works for every kind of graph and every kind of period. The program shows the volumes based on the number of candles displayed in the chart: the more candles the more volumes. Enjoy this very useful indicator.
Please feel free to message me to report any kind of improvements! :D

Secret Average Trade : this is a revolutionary system unlike any other, the strategy uses algorithms such as grids, averaging, hedging and partially uses martingale algorithms. Trading is carried out on 17 currency pairs simultaneously and uses timeframes: 9. Fully automatic trading with the calculation of entries based on a system of various Trends and also supports reverse trading. Benefits
Partial closure to reduce the load on the deposit. Averaging orders, which are required to close past o

Automated multicurrency expert advisor working on any type of accounts and with any type of spreads. The Expert Advisor always sets TakeProfit and due to this, even if there are interruptions to the Internet, the orders will be closed on time and at a favorable price. The timeframe on the chart does not matter, you can set any digits. Working timeframe is set directly in the settings of the EA. To protect the deposit and limit possible losses, the EA has two options: the ability to set StopLos

Coiote Book Balance é um indicador que monitora o livro de ofertas e indica de maneira simplificada o níveis de renovação de ordens agrupados no timeframe gáfico, mostrando quanto o maior lado renovou e a diferença dessas renovações. Além disso, é possível visualizar em quais preços estão as maiores ordens da cada lado, o preço teórico dessa liquidez e a quantidade de lotes em tempo real. Para correto funcionamento do indicador é preciso que o livro de ofertas seja aberto antes da inclusão do in

The indicator plots dynamic POC, VAH and VAL levels for a specified period from tick data. POC - Point Of Control, the price at which the maximum volume has accumulated over a certain period of time (POC in the volume profile). VA - Volume Area, the zone of the fair value of the asset. VAH - Volume Area High. VAL - Volume Area Low. The DBS_DynamicLevels indicator plots dynamic levels where the calculation point is the maximum volume level (POC) and zone VAH / VAL. The indicator shows the history
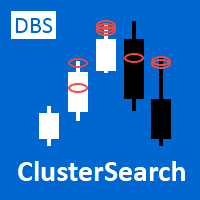
Professional traders know that volume is the fuel for price movement. Large players try to hide their true intentions, but they can be recognized by volume bursts. The standard vertical volume does not show us specific price levels, but the cluster volume and especially its surges provide a very clear picture and specific price levels (areas).
The DBS Cluster Search indicator searches for clusters of the specified size in tick data and highlights them with colored figures on the chart. These l

"Support or Resistance Alert Broken" is a simple and very intuitive tool that allows you to create or eliminate horizontal and trend supports and / or resistances with a simple click.
When the support or resistance line is broken by the closing price at the end of the current candle, the "Support or Resistance Alert Broken" tool will send an alert with sound, as well as a notification to the MT4 or MT5 mobile application. This tool can send alerts from multiple pairs at the same time.
Utility

The Double Currency Correlation EA trading robot is optimized to trade correlated currencies based on the moving average indicator. An example of such currency correlations is EURUSD and USDJPY: Particularly stable signals exist when a long signal occurs in EURUSD and a short signal in USDJPY (and vice versa respectively) at the same time. In order to trade exactly those situations, set the input parameter "Use double currency?" to "yes". The first currency pair is the one you selected in the ch
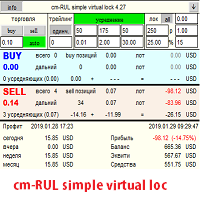
Description of the Expert Advisor:
You can trade with any strategies and any Expert Advisors, but there comes a time when trading comes to a standstill. All dogmas and rules are violated and you do not know what to do next. My hands drop and I want to take a break, but there are several thousand dollars at stake, which is so insulting to leave to the mercy of fate. You can of course just put a lock, go on vacation and then calmly sort everything out, and you can entrust all this to the adviser
For those who trade false breakouts (FBo) levels. The False Breakout Finder (FBoFinder) service was written primarily for trading stocks and their CFDs on daily charts. It will search for you for various false breakouts of extremes on hundreds and thousands of instruments from the Watchlist, which will save you in the long run many hours of daily routine selection of securities before the market opens. In the process of enumerating instruments, securities with a ban on trading are ignored. If a

Semi-automatic Expert Advisor StrikerFBo is designed to trade false breakouts of levels (one bar, two bars, complex false breakout). It was written primarily for trading stocks and their CFDs. For its operation, it is necessary to place a horizontal line on the chart, on which the robot will be guided to enter a position. Checking this Expert Advisor in the strategy tester is meaningless for this reason. StrikerFBo can be used on demo and live accounts.
The Expert Advisor has the following par

Expert advisor based on Bollinger Bands Indicator Since it is not easy to predict when the trend reversal will occur, this Expert can place additional orders at different distances from the first order, and with different lots, so that positions can be averaged and profit taking is more easily achieved. Since the over-buy or over-sell conditions apply to any currency pair in the Forex market, this expert can be used with any pair by adjusting the step and the size of the Lot. The default parame

The EURUSD looking at the Majors is a Multipair System for operate the EURUSD
!!!!!IMPORTANT!!!!! THIS EA IS FOR USED IN EURUSD ONLY. !!!!!IMPORTANT!!!!!
This system detects a multi-pair entry point based on the value of the majors and operates that entry in the EURUSD with its own and efficient algorithm. All tickets have an SL and TP and use optimized trailing. You have to use the name of the value in your broker, in the corresponding inputs.
Very stable growth curve as result of s

Crypto Price Action EA is a trading robot specially designed for forex trading as well as trading crypto-currencies (as soon as the latter ones can be traded for reasonable spreads again). The EA uses the ATR indicator. A trade is opened when the price within a candle moves away from the opening price by an adjustable ATR factor ("Open trade factor"). Many currency pairs have the tendency of continuing a trend once it has started so that exactly the direction the price has exceeded the factored

Expert advisor based on a widely tested price action strategy The EA already incorporates all the variables in its programming, it is enough to let it run on the graph with the values it incorporates by default.
ACCOUNT: - This AE has been optimized to work on a STANDARD account - This AE is suitable for accounts of 3,000 USD - Default settings suitable for EUR/USD (any Timeframe)
DESCRIPTION OF THE STRATEGY Price action trading analyzes the performance of a currency to predict what it mi
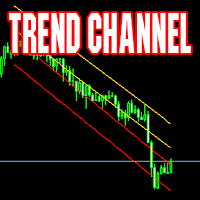
Channel indicator. Calculated dynamically. Suitable for both working in the direction of the trend and inside the channel. Excellent results when working on timeframes from 4H towards the center of the channel.
Example of use: when the price touches one of the extreme lines - opening a deal in the center of the channel with a take profit on the nearest middle line of the indicator. MT4 version The indicator can be used in expert advisors (4 buffers), receiving data in a standard way. Support:

Good afternoon. UturnAnalysis - to check the quality of the indicator
WE HAVE LAUNCHED A TRIAL VERSION free distribution of signals about reversals based on this indicator for the futures and stock markets of the MICEX
write to tech support, me 777basil@mail.ru , or in the comments your email address and we will send you the account details where the alerts are sent, for free. https://youtu.be/q228LvLec-Y
we put it on several tools at once https://youtu.be/Wr7N2WEY8lA will save you time at t

Good afternoon. Today we present a new indicator PointIntoChannelTOMSON https://youtu.be/dmgtVwX3nvg
https://youtu.be/Wr7N2WEY8lA -this indicator is calculated from the channel to the level of price deviation in the direction of buying and selling, the green and red window of indicators, respectively. The higher the deviation level, the greater the probability of a reversal. The indicator readings are recalculated with each new bar and it is recommended to use it only as an auxiliary one
Con

This is the Total & Real version of Arawako MT5 EA , based on the Bollinger Bands indicator. I have created an open strategy you can modify at your will, as it has been specially designed for trading GOLD at 0.01 but it can work in all pairs and any other lot start option. >> A Demo version can be found at the following link< <
It provides the option to take advantage of its 2 signals: Crossing with MAs or Top and Bottom retracements of the BBands indicator . Minimum recommended balance: 10

EVOLUTION NIGHT SCALPER
Evolution Night Scalper is an expert advisor trend follower that work on any currency pairs,but performs on EURUSD M5 . The EA uses Take Profit and a money Stop Loss. Average positions are opened when the market goes in the opposite direction but all closed at the maximum loss entered or take profit hit. Default setting are optimized by "Forward Test" to reduce overfitting from 2014 to 2021 and has the right compromise between initial lot and max loss but each one can mo
Risk Calculator is a panel for order size calculation according to stop loss and allowed risk per trade. The calculation is performed for the symbol the expert is launched at. Risk Calculator tells you how many cost to trade based on: Given stop-loss take-profit levels for "Instant Execution" and "Pending Order" Account currency Price of the quote currency (when different from account currency) Risk Calculator can place order like one click trading

The trading system is designed to work with gold on time periods: 30M, 1H. The indicator allows you to adjust to the market situation.
Parameters for 1H : PERIOD=9F , FILTER=300 .
Parameters for 30M : PERIOD=22B , FILTER=450 .
A small adjustment to a specific broker is allowed .
If you change the amount of history displayed, you may also need to adjust the parameters.
The indicator is not redrawn.
"Gold n XAU" uses different rules for entering a trade and different rules

Please rate it.
Approximate approximate buy / approximate approximate trend EA.
Trends are trends.
Buy a squeeze and choose a candle.
You can wear it in black and white when going backwards.
Currency Currency: BTCUSD
Trading Style: Scalping
Trading time: 5 minutes
Parameters
Magic: Magic number
Lots: I use MM
ExitRatio: Closed with N% account balance
MaxPosition: Number of updates
MM: Setting to use the lodging function
MaxRisk: Large risk when using MM
BreakPeriod: Candle

MT5 Version Dashboard: Free scanner to monitor All pairs and timeframes. Please contact me after purchase, i will send it to you! MT4 version indicator: https://www.mql5.com/en/market/product/59127 Tip: This is an indicator for real-time signal display. When the indicator is loaded and running on the chart, the past signal cannot be displayed Market structure changes as price reverses And filter with all import features built inside one tool. Breaker's smart algorithm detects the reverses,
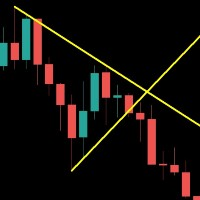
Save your time . Select area and the trend line will draw automatically . Draw a support and resistance line for the selected range with two mouse clicks . If you need to, you can also draw a line for support and resistance based on separate areas.
The resistance trend line is drawn based on the first and last highs inside the selected area; The support trend line is drawn based on first and last lows inside the selected area;
The Moving Average Convergence Divergence Indicator (MACD) is both a trend–seeking and momentum indicator which uses several exponential moving averages set to closing prices to generate trading signals. This Version brought to you the Stochastic confluence filtering the signals, this set ups amazing entries on índices and stock futures trading.
We added many types of alerts plus the Delay Cross Filter to aid in your search for better opportunities in the market.
Product Features Sound alert
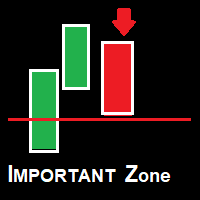
Zona Importante. O indicador Zona Importante é um indicador desenvolvido com todo meu conhecimento no mercado. o que voce podera esperar dele? o Indicador gerara alerta em toda e qualquer Reversao, seja uma reversao de fato ou um simples pullback ou seja a cada mudanca de direcao ocorrera um alerta. - Beneficios: - Nao deixara voce perder oportunidade.
O sell signal significa que uma nova onda de queda ocorrera. O buy signal significa que uma nova onda de alta ocorrer

Non standard attitude to the standard moving average indicator. The essence of the indicator is to determine the strength and speed of the price direction by determining the tilt angle of the moving average. A point is taken on the fifteenth MA candle and a point on the last closed MA candle, a straight line is drawn between them, it is movable and on a hemisphere shows an angle of inclination from 90 degrees to -90. above 30 degrees is the buying area, below -30 degrees is the selling area. abo

Perseverance. It is an Ea that seeks the best window of opportunity to enter the market.
If the entry is wrong, the system exits by stop lost.
If the entry is correct, once the point of no return is exceeded, an aggressive follow-up system begins.
Can used this EA whit 500$ in your account Perseverance IS IDEAL FOR SMALL ACCOUNTS Perseverance IS ONLY AN OPEN OPERATION. Perseverance IS VERY LOW RISK OF MARGIN CALL
You can download the demo and test it yourself.
Very stable grow

GIVE A LOOK TO MY OTHER PRODUCTS ! 100 % PER MONTH PROFIT---- MY NEW SIGNAL HERE -------> https://www.mql5.com/en/signals/2162238?source=Site+Signals+My#
The Parabolic SAR (PSAR) helps trader identifying direction of the stock movement and also provides them with the entry and exit. This indicator on the chart appears as a series of dots either above or below the price bars. When the Dots are below the price bar is then the price movement is considered to be bullish and when the Dots are abo

Overview The Expert Advisor sends notifications to a mobile phone, via e-mail or plays a sound in case any changes are detected on the trading account: opening/closing positions, changing order or position parameters, balance or leverage. Also, the Expert Advisor can inform that Equity on the trading account has dropped below a specified value or Free Margin is small compared to Margin. The Expert Advisor does not trade, it only monitors your account.
Launching the Expert Advisor You should all
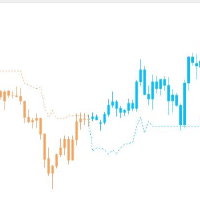
Stable trend index without clutter The index optimizes the moving average and removes the unstable clutter It can also be used in any other commodity It is best used in mainstream currencies such as EURUSD, USDJPY, GBPUSD and AUDUSD
The time period is 1 hour
I only know a little English, please forgive me if you don't understand I will always improve this indicator
Daily Percentage Change (MetaTrader indicator) — calculates the change of currency rate related to the previous daily close and displays it in percentage points in the main chart window of the platform. Additionally, it can display the weekly and monthly percentage changes. Different colors can be set for positive or negative price increases. Also, a small customizable arrow helps to visualize the price change direction. If your broker uses an unconventional time zone, the indicator can use

Indicador en MQL5 que obtiene el promedio de 10 EMAS que son alineadas y procesadas según Fibonacci luego el promedio es suavizado" Se ingresa un número de 2 a N que multiplica los EMA-Fibonacci y por consiguiente aumenta los fibonacci, resultando un promedio. Se ingresa un número que suaviza los EMA-Fibonacci. Considerando los números 1/1 seria la suavización minima. Considerando los números 3/5 seria la suavización media. Considerando los números 10/30 seria la suavización alta.....etc

Hello This EA is depending on Guaranty strategy , it open same position by wide pips every time then will close in profit. it can make a continues profit (maybe little but continues) you can change all settings but don't be impetuous. note; (if you want make back test) make Work_in_Backtest_TF true
you can download it and make Back Test before buy it
good luck
السلام عليكم ورحمة الله وبركاته يعتمد هذا الاكسبيرت على إستراتيجية مضمونة ، فهو يفتح نفس المركز في كل مرة لكن على فترات متباعدة ثم
MetaTrader mağazası, MetaTrader platformu için uygulama satın almak adına rahat ve güvenli bir ortam sunar. Strateji Sınayıcıda test etmek için Uzman Danışmanların ve göstergelerin ücretsiz demo sürümlerini doğrudan terminalinizden indirin.
Performanslarını izlemek için uygulamaları farklı modlarda test edin ve MQL5.community ödeme sistemini kullanarak istediğiniz ürün için ödeme yapın.
Alım-satım fırsatlarını kaçırıyorsunuz:
- Ücretsiz alım-satım uygulamaları
- İşlem kopyalama için 8.000'den fazla sinyal
- Finansal piyasaları keşfetmek için ekonomik haberler
Kayıt
Giriş yap
Gizlilik ve Veri Koruma Politikasını ve MQL5.com Kullanım Şartlarını kabul edersiniz
Hesabınız yoksa, lütfen kaydolun
MQL5.com web sitesine giriş yapmak için çerezlerin kullanımına izin vermelisiniz.
Lütfen tarayıcınızda gerekli ayarı etkinleştirin, aksi takdirde giriş yapamazsınız.