YouTube'dan Mağaza ile ilgili eğitici videoları izleyin
Bir alım-satım robotu veya gösterge nasıl satın alınır?
Uzman Danışmanınızı
sanal sunucuda çalıştırın
sanal sunucuda çalıştırın
Satın almadan önce göstergeyi/alım-satım robotunu test edin
Mağazada kazanç sağlamak ister misiniz?
Satış için bir ürün nasıl sunulur?
MetaTrader 5 için Uzman Danışmanlar ve göstergeler - 30

Ranking Scalping allows you to quickly identify the best opportunities in the market, reducing analysis time and empowering your trading decisions. It is a robust and adaptable tool, ideal for traders looking to optimize their scalping and intraday strategies. With its automated analysis and clear visualization, discover how to maximize your opportunities and trade more efficiently with this innovative tool! Serie: Daytrading: Scalping & Intraday Top Symbols Analyzer General Description:
The "R

Golden Retirement is a multi-strategy system designed for trading GOLD vs USD (XAUUSD). It does not use grid or martingale or any high risk money management strategies. Every position has a fixed stop loss and take profit. A trailing stop is used to catch as many pips as possible. It is not a scalping system, but most positions are closed within a day or two. It uses 10 different strategies to make the best out of every market condition.
As this EA does not utilize grid and/or martingale it wil

It is the MQL5 version of zero lag MACD that was available for MT4 here: https://www.mql5.com/en/code/9993 Also there was a colored version of it here but it had some problems: https://www.mql5.com/en/code/8703 I fixed the MT4 version which has 95 lines of code. It took me 5 days to write the MT5 version.(reading the logs and testing multiple times and finding out the difference of MT5 and MT4!) My first MQL5 version of this indicator had 400 lines of code but I optimized my own code again and n
FREE
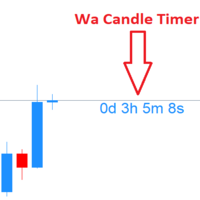
Wa Candle Timer MT5 , MT5 grafiğinizde bir sonraki mum oluşana kadar kalan süreyi gösteren güçlü ve kullanıcı dostu bir göstergedir. Mum kapanış sürelerinin farkında olmanıza yardımcı olarak daha iyi işlem yürütme ve karar verme sağlar. Temel Özellikler :
Mevcut mum için geri sayım sayacı gösterir.
Kalan süre, kullanıcı tarafından tanımlanan yüzde seviyesinin altına düştüğünde renk değiştirir.
Belirli bir yüzdeye ulaşıldığında özelleştirilebilir uyarı verir.
Yazı tipi ve renkler tama
FREE

GOLD robot4trade (FTMO Uyumlu Sürüm) v1.5
Robot4Trade.com tarafından geliştirildi | Yapay Zeka Destekli & Challenge Hazır Genel Bakış
Advanced Forex EA , yüksek performans, istikrar ve FTMO, MyForexFunds gibi prop firmaların gereklilikleriyle tam uyumluluk için tasarlanmış yeni nesil bir otomatik işlem algoritmasıdır. Bu EA; klasik ve güvenilir göstergeleri (MA, RSI, ATR), modern risk yönetimi ve sermaye koruma araçlarıyla birleştirir. Günlük zarar kontrolü, akıllı giriş stratejisi ve g

This EA implements a range trading strategy using three key indicators: Bollinger Bands : Identifies overbought (upper band) and oversold (lower band) conditions Default period: 20, deviation: 2.0 Relative Strength Index (RSI) : Confirms overbought/oversold conditions Default period: 14 Overbought threshold: 70 Oversold threshold: 30 Moving Average : Determines the overall trend direction Default period: 35 (SMA) Entry Conditions: Buy Signal : Price touches or crosses the lower Bollinger Band RS
FREE

This indicator searches for candlestick patterns. Its operation principle is based on Candlestick Charting Explained: Timeless Techniques for Trading Stocks and Futures by Gregory L. Morris. If a pattern is detected, the indicator displays a message at a bar closure. If you trade using the MetaTrader 4 terminal, then you can download the full analogue of the " Candle Pattern Finder for MT4 " indicator
It recognizes the following patterns: Bullish/Bearish (possible settings in brackets) : Hammer

This trading strategy uses HeikenAshi candles to smooth out market noise and 2 SMAs for more accurate market entry points. It is suitable for trading any currency pairs, commodities (e.g., gold and oil), and stocks. The strategy was tested on EURUSD with a 1-hour timeframe. Period 01.01.2024 - 27.07.2024 Recommended parameters: Lots = 1 StopLoss = 490 TakeProfit = 310 Moving averages parameters: FastMA = 66 SlowMA = 32 Before starting, make sure that the Heiken Ashi indicator, located in Indicat
FREE

RBC Range Bar Chart is a classical range bar chart indicator. The indicator features price ranges for charting: High/Low price range is a classical option for analysis. It also has Open, High, Low and Close prices. In the first option, two price values are analyzed at the same time, while other options only use one price. Conventionally, range bars are drawn using tick data but since tick data is not available on the server, charting is only possible based on bar data from standard time frames.

Advanced Indicator Scanner is a multi-symbol multi-timeframe scanner that works with hundreds of custom indicators available across the web including mql5 website market and codebase indicators.
Advanced Indicator Scanner features:
Scans your indicator in 28 customizable instruments and 9 timeframes. Monitors up to 2 lines(buffers) of an indicator. Showing of indicator value on buttons. You can choose between 3 alert modes: Single symbol and timeframe Multiple timeframes of a symbol Multiple

TITAN X
The advantages and features the Expert Advisor (EA) TITAN X
1. Automated Trading Execution Precision: TITAN X meticulously follows your predefined trading rules. This eliminates the risk of human error, such as hesitation during entry or exit signals, or impulsive decisions driven by fear or greed. 24/7 Availability: Unlike human traders who require rest, TITAN X operates continuously, seizing trading opportunities around the clock, even during non-market hours. This ensures no potent
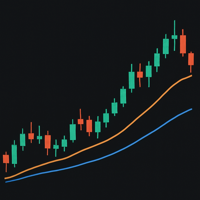
The 13- and 21-period exponential moving averages (EMA) on a 15-minute gold chart are used to identify short-term trends and potential trading signals. When the 13-period EMA crosses above the 21-period EMA, it is considered a bullish signal indicating a possible price increase. Conversely, when the 13-period EMA crosses below the 21-period EMA, it is considered a bearish signal indicating a possible price decline.
These crosses are used to determine entry and exit points. For example, when a
FREE
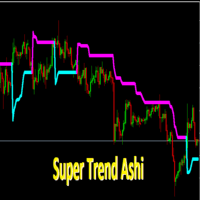
SuperTrendAshi Description SuperTrendAshi is an advanced and optimized version of the SuperTrend indicator that incorporates Heikin Ashi calculation to provide smoother and more reliable signals. This unique combination results in an indicator that reduces false signals and identifies trends with greater precision. Key Features Combines the strength of SuperTrend with Heikin Ashi smoothing More stable signals with less noise Intuitive color system (Aqua for uptrend, Magenta for downtrend) Custo
FREE

Welcome to the revolution of trading! We are a team of trading experts with many years of experience who have channelled their expertise into the development of Zazen EA. Zazen EA can also be used with PropTrading companies (for example FTMO). The EA has many functions (e.g. drawdown limit) that are specifically required in the area of prop trading. The name "Zazen" is no coincidence. It is derived from the Buddhist meditation practice that promotes calmness, serenity and clarity. Zazen EA is no

The Expert Advisor is designed for pair trading with 2 instruments with high positive or negative correlation. Instrument lots are balanced automatically depending on the tick value of the instrument, and therefore it is advisable to use the base lot of at least 0.05. The function of refills is built-in, taking into account the number of knees and the coefficients of multiplication and addition of lots. Trades are opened when there is a discrepancy by a specified distance in points of instrument

Hello You can copy orders between terminals for any computer via Internet (MT4 to MT4) or (MT4 to MT5) or (MT5 to MT4) or (MT5 to MT5) it's fast Open orders Modification Stop Loss and Take Profit Close Orders This is EA (Master) put it in Experts folder you must buy (Copy orders for any computer via Internet Slave) EA too from this link if you want to copy to MT4
https://www.mql5.com/en/market/product/55097 if you want to copy to MT5
https://www.mql5.com/en/market/product/56414
Please w
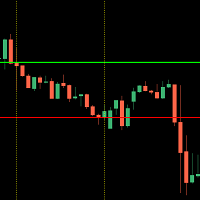
This indicator shows you the higher high and lower low of a certain period of time.
It is easy to use - select your desired time frame (current, 15Min, 1H, 1D) and the corresponding number of candles.
The indicator measures the highest and lowest point within the specified range and automatically draws the two corresponding lines.
The design of the lines is up to you!
Should the trend break one of the drawn lines with a closed candle, a message will be sent to you by the built-in alarm funct

Unlock the power of the market with the Investment Castle Multi Time Frame Moving Average Indicator. Simplify your trading journey by easily identifying trends and pullbacks across multiple time frames on one convenient chart. This indicator is a must-have tool for any serious trader. Available for MT4 and MT5, and exclusively on the MQL5 market, customize your experience by adding as many indicators as you need on the chart, each with their own unique time frame or period. Enhance your strat

"PS Celestial Navigator" is a powerful and straightforward Expert Advisor (EA) designed for MetaTrader 5, tailored for both trend-following strategies and professional traders.
This EA operates on a simple yet effective rule: It initiates a Buy trade when the last candle closes above the 9 EMA and a Sell trade when it closes below. Both the EMA value and other key parameters can be easily modified through the user-friendly input settings. One of the standout features of "PS Celestial Navigator"

Superior Boom and Crash Spike Alert: Real-Time Market Intelligence at Your Fingertips
Unlock the power of timely trading decisions with our Superior Spike Alert, a cutting-edge trading tool designed to notify you of potential market spikes. This innovative system sends instant alerts to your phone, audible notifications on your laptop, and displays clear arrows on charts for each currency pair, ensuring you stay ahead of the market.

EA that tracks and monitors the gold price during the period Heiken Ashi with operational control. Recommended settings • Symbol: XAUUSD / Gold • Timeframe: H1 • Minimum deposit: $1000 • Lot 0.01 • Leverage: 1:100 or higher • VPS: Highly recommended for 24/7 trading operations
Things to know before buying
Trading involves risk, and past performance is no guarantee of future success. Market conditions are subject to change, and it is important to test the EA under different circumstances to

The indicator is designed to detect range market or consolidation areas on the chart. It does this by using the market volatility and price momentum. The indicator signals the start and stop of the range with icons on the chart and various type of alerts options provided in the input settings. Usage: The indicator can be used to check the state of the market i.e. trending or ranging to make appropriate decision and use strategies designed for specific market state. Please see the attached video

Tick Speed Pro povides a charted record of tick speed to allow you to see the ebb and flow of market activity. Observing patterns in tick speed may allow you to better time entries to reduce slippage and re-quotes.
The tick speed plot updates it's entire position to show you only the last N seconds you choose, ideal for scalping and HFT approaches. An alert is provided to signal when the instrument is getting ticks at a higher rate than the alert limit. Multiple loadings are supported to compare

Trend Entry Indicator Your Trading will Be easier with this indicator!!! This Indicator is Developed To make our trading life easier. Get an Arrow for Entry with Take Profit and Slop Loss marks on chart. - Indicator is Based on trend, because thats what we all want we want to follow the trend "it's our friend". - Based on Levels, price action and oscillators. - It works on all currency pairs, all indices, metals and stock. - it works on all pairs/indexes on Deriv including Boom and Crash. - Tim

Offer 249 down from 350 for the next 1 copies. then back to 350 $
Are you tired of using outdated indicators that leave you guessing where to set your profit targets? Look no further than the AK CAP Opening Range Breakout Indicator. This powerful tool is backed by a US patent and has already helped countless traders pass funded challenges like FTMO. We use it daily on our prop traders and internal funds, and now it's available to you as well. The calculation behind the indicator is incredibly a

Fully featured Pivots and Levels indicator Pivots: Floor (normal), Woody, Camarilla, Fibonacci Levels: ATR, Historical Volatility with standard deviations, Close Price Volatility with standard deviations
Features: - 4 +/- levels
- MTF, pivots/levels based on Daily, Weekly, 4hr or even 15min - Hour and minute time offset
- Texts with prices and pip distances to central pivot/level - Inputs for Camarilla/Fibonacci/ATR/Volatility levels
- Alerts, popup, push, email, sound, live or completed candle

功能介绍
本软件利用键盘快捷键来辅助短线操盘、快速刷单和组合下单,是短线操盘手的利器。 本软件支持快捷下单,批量平仓,批量挂单及平仓与开仓的组合交易,实现一键操作多个交易指令执行。 面对行情剧烈行情波动时,操盘手可从容应对,并快速准确的下单和平仓,让交易变的更简单。 适合人群 热爱交易并希望成为一名操盘手的人。 长时间盯盘,操盘风格为短平快的操盘手。 愿意提高短线操盘胜率并训练强大执行力的操盘手。 希望更加高效把握市场机会,并能快速且准确的执行交易指令的操盘手 安装和配置 先软件需要安装在Experts文件夹中。 在导航中刷新可显示本软件,然后双击在到图表。 输入参数中选择语言及界面主题。 主界面分两个标签栏目: 基本交易和组合交易。基本交易执行的是简单命令,组合交易执行多个命令捆绑。 设置要对应的交易参数之后,要选择启动,那么就按下对应的快捷键执行交易了。 修改快捷键和交易参数必须在非启用状态下,双击对应的表格单元填入参数,或者弹出下拉框选择。 快捷键列表
本软件支持的预设快捷键清单,包括买入、卖出、撤单等常见交易操作的快捷键。 双击快捷键弹出下拉框可以选择自定义快捷键,同时用
The Traders Dynamic Index indicator is the only technical indicator you need to scalp the market successfully. The TDI is the only technical indicator that can read the market sentiment, market volatility, and momentum at the same time. The advantage of combining the qualities of several indicators into one indicator is that it can be the “holy grail” you are looking for. Let’s break down the Traders Dynamic Index indicator and go through it a little bit. As you can see, this scalping indicator

The TimeFilter indicator allows visually selecting the bitmaks (GoodHourOfDay, BadHoursOfDay, GoodDayOfWeek, BadDaysOfWeek), which correspond to the Standard Library's Intraday Time Filter module for trading signals. Additionally, it is possible to enable and disable the trading intervals in a string form. It is also possible to use the trade volume multiplier when using the indicator as a part of an EA. String format: [week day]:[first hour]-[last hour]. See the screenshots and the video for us

The indicator colors bullish, bearish and doji candles. Also, the amount of candles (bullish, bearish and doji) for the last N days is calculated. You can select colors for both bodies and shadows of candles, as well as enable coloring of only candle bodies МetaТrader 4 version: https://www.mql5.com/en/market/product/11624 Parameters color bulls = color of bullish candle bodies color shadow bulls = color of bullish candle shadows color bears = color of bearish candle bodies color shadow bears =

An expert based on artificial intelligence ( AI )
For GOLD (XAUUSD) and BITCOIN (BTCUSD) in time frame 30 minutes, 1 and 4 hours and daily
Has a TP and a SL
Without the use of dangerous strategies such as martingales and hedges
Best time frame: M30 , Best currency pair: GOLD Get EURUSD Expert for free after buying(or renting) this Expert. For more information, send a message after buying(renting).
Symbol: GOLD (XAUUSD) and BITCOIN (BTCUSD)
Time frames: M30 , H

This simple, yet powerful indicator is very good way to determine actual S/R levels. It's main purpose is making your overview on markets much better.It has built-in arrow signal system, which should be used along with MT indicators for best results.Just try it.
Recommended MT indicators to use along:
Bollinger Bands (default) RSI (period 3, levels 10/90)

This indicator builds upon the previously posted Nadaraya-Watson Estimator. Here we have created an envelope indicator based on kernel smoothing with integrated alerts from crosses between the price and envelope extremities. Unlike the Nadaraya-Watson Estimator, this indicator follows a contrarian methodology. Please note that the indicator is subject to repainting. The triangle labels are designed so that the indicator remains useful in real-time applications.
Settings
Window Size: Determin
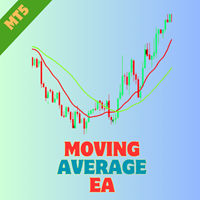
Moving Average Strategy EA MT5 Welcome to the pinnacle of automated trading with the Moving Average Crossover EA for MetaTrader 5. This expert advisor is meticulously designed to harness the power of moving averages, offering traders a versatile solution for capturing trend reversals and potential entry points. With an array of customizable settings and robust features, this EA is set to redefine your trading strategies and amplify your trading experience. For detailed documentation General
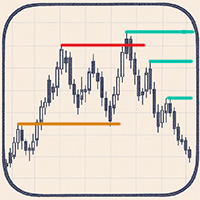
Automatic Marking of Key Price Levels
Each of you spends a huge amount of time every day manually marking and updating key price levels.
Every missed important level can lead to an unpredictable market reaction! This tool keeps your chart constantly up to date — removing outdated levels and adding new relevant ones in real time
Liquidity levels – target zones for price movement Reversal and reaction zones – break levels or likely turning points Liquidity grabs and price reversals You choose th

STRATEGY DETAILS ______________________________________________________________________________________________________________ Entry indicators:MACD+Aligator+RSI+Bull power+Moving averages+Daily points Symbol: GBPUSD + possibble to set and optimize for other currency pairs Timeframe: H1 + possibble to set and optimize for other currency pairs No Dangerous Strategies Take profit: Fixed+Exit indicators(Envelopes + Bollinder bands) Stop loss: Fixed+Exit indicators( Envelopes + Bollinder bands )

Bu gösterge, farklı zaman ölçeklerinde birçok grafiğin gözden geçirilmesini daha hızlı ve daha kolay hale getirmek için tasarlanmıştır. Birden fazla grafikte Zaman ve Fiyatı İzleyin Bir grafikteki Sembolü Değiştirin ve aynı sembolün diğer tüm çizelgeleri de değişecektir. Kullanımı kolay, ustalaşması hızlı Gösterge, aynı Sembolde açık olan diğer tüm grafiklerde fare işaretçisinin geçerli grafikte bulunduğu fiyatı ve zamanı belirlemenize olanak tanır. Bu, birden fazla grafikteki bilgileri hızlı bi

Introduction to Sideways Market Analyzer Notable period of Low volatility and non-trending movements in the financial market is considered as Sideways Market. Sooner or later, the low volatility will increase and the price will pick up a trend after Sideways Market. In terms of trading point of view, Sideways Market can serve as the very good entry timing for traders. Sideways Market is also quite often the representation of accumulation of large orders from big investors. Therefore, knowing the

Multifarious EA – your ultimate multi-strategy trading ally, designed for the BYBIT platform but ready to shine on any MT5 trading setup. This advanced EA empowers you with over 30 strategic combinations by pairing 5 top indicators, giving you complete flexibility and control in the fast-paced world of crypto. Why Multifarious? Endless Strategy Options : Unlock the potential of Moving Averages, RSI, Momentum, Fibonacci, MACD, ATR, and more. Combine or layer them for tailored trading setups that
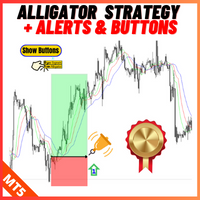
Description: For a comprehensive understanding of our indicators, we invite you to explore the entire Q&A section within this MQL5 blog post here . The Alligator Cross Strategy with Alert and Button is an effective technical analysis tool designed to assist traders in identifying potential entry and exit points with enhanced trading. Based on the popular Alligator Indicator, this tool brings an added layer of convenience with real-time alerts and trading buttons for seamless execution. Key F

White Weis Volume
This indicator shows the sum of the volume in each wave, bulish or bearish, as idealized by David Weis , but it brings an important addition , which is the marking of the bar with the highest volume of the wave (White Bar)!
In coding the indicator, it was sought to optimize the code to require minimal processing during use and not to overload mt5.
The indicator can be used for pre-trading analysis and study, where the trader analyzes possible points of support and resistance

Volume Delta Panel is a very powerful indicator that read the supply on Market. It calculates the Delta from movement of the price and the difference of BUY volumes and SELL volumes. The Volumes are added to price and normalized to symbol points.
Its special structure allows you to get all Time Frames values available on the platform MT5. Panel can show 50 instruments simultaneously all customizable according to the offer of the Broker. A good observation of this instrument can suggest great e
Summary: This strategy is designed to trade the EUR/USD currency pair utilizing a sophisticated combination of technical indicators. It seeks to automate the trading process by analyzing market conditions based on various metrics and executing trades following the defined strategy rules. Key Features: Indicators Used : 1. Williams Percentage Range (WPR) : Used for momentum trading. 2. MACD : To identify potential buy and sell signals based on the cross of moving averages. 3. OSMA : A varia

The indicator detects and displays М. Gartley's Butterfly pattern. The pattern is plotted by the extreme values of the ZigZag indicator (included in the resources, no need to install). After detecting the pattern, the indicator notifies of that by the pop-up window, a mobile notification and an email. The pattern and wave parameters are displayed on the screenshots. The default parameters are used for demonstration purposes only in order to increase the amount of detected patterns.
Parameters z

NOTE: CHANGE THE STOP LOSS TO 1000 POINTS BEFORE TESTING AND PLEASE AFTER THE PURCHASE CONTACT US FOR TESTED SET FILE Only GOLD Elevate your gold trading with SimpleEA v1.09—a uniquely designed Expert Advisor engineered exclusively for XAUUSD. With a robust set of features, proven profitability, and cutting‐edge risk management capabilities, this EA is a market-ready solution that’s as effective as it is user-friendly. The default settings are meticulously optimized for gold, so you can start
50% off. Original price: $60 Triangle Finder is a multi symbol multi timeframe dashboard that finds symmetrical triangle pattern in 28 symbols and 9 timeframes with a deep scan feature to scan all market watch symbols (up to 1000 instruments!).
Download Demo here (Scans only M1, M5 and M10) Settings description here MT4 version here
Triangle Finder features: Realtime monitoring of 28 customizable instruments and 9 timeframes at the same time. Deep scan mode to scan all market watch symbo

The Squeezer indicator simply draws ascending lines with Sell signal in the downtrend and descending lines with Buy signal in the uptrend to catch the pullbacks and sniper entries. This is a common successful trading strategy being used by many successful traders, and the good thing about this strategy is that it works with all time frames. The difference is in the take profit level between them. Buy / Sell signals are triggered at the close of the current candles above / below the ascending or

BUY INDICATOR AND GET EA FOR FREE AS A BONUS + SOME OTHER GIFTS! ITALO TREND INDICATOR is the best trend indicator on the market, the Indicator works on all time-frames and assets, indicator built after 7 years of experience on forex and many other markets. You know many trend indicators around the internet are not complete, does not help, and it's difficult to trade, but the Italo Trend Indicator is different , the Italo Trend Indicator shows the signal to buy or sell, to confirm the signal t

Get the MT4 version here ! Automate your range breakout strategy! The "Range Breakout Bot" is a powerful tool designed to automate your range breakout trading strategy with precision and ease. Whether you're a seasoned trader or just looking to streamline your trading routine, this bot is the perfect companion to help you capitalize on market volatility when prices break out of a defined range. The bot alerts you or opens positions automatically when a breakout occurs, ensuring you never miss a

This indicator accurately identifies and informs market reversals and continuation patterns by analyzing and signaling the Three White Soldiers / Three Black Crows pattern. It also offers a "real-time backtesting" panel in the indicator itself in a way that every change made on the indicator parameters will immediately show the user how many signals are occurred, how many take profits and stop losses were hit and, by having these informations, the Win Rate and the Profit Factor of the setup bas

This indicator is a conventional analytical tool for tick volumes changes. It calculates tick volumes for buys and sells separately, and their delta on every bar, and displays volumes by price clusters (cells) within a specified bar (usually the latest one). The algorithm used internally is the same as in the indicator VolumeDeltaMT5 , but results are shown as cumulative volume delta bars (candlesticks). Analogous indicator for MetaTrader 4 exists - CumulativeDeltaBars . This is a limited substi

Jackson trendline scanner it a powerful price action tool which draw accurate trendlines and alert a breakout signals . As we all know that trendlines it a most powerful tool in price action by providing us with different chart patterns. e.g. Bullish flag, Pennant, Wedges and more...It not easy to draw trend lines, Most successful traders use trendlines to predict the next move based on chart pattern and breakout. Drawing a wrong trendline it a common problem to everyone, wrong
FREE

Open Multiple Trades on MT5 in 1 click at one price. Enter the Symbol you want to trade Enter the Lot size Specify the number of trades you want to open Choose from a dropdown list whether you want to buy, sell, sell limit, sell stop, buy limit, buy stop If they are pending orders, state the number of pips away from the current price that you want to set the trades. Once you are done, click Ok and see the script open your trades in an instant What to Always Note Check the minimum stop levels f

Introducing our innovative Expert Advisor (EA) designed to capitalize on pullback opportunities in the forex market, with the support of the Average True Range (ATR) indicator. This strategy focuses on identifying moments when the price temporarily retraces within a dominant trend, offering potential entry points with controlled risk. The ATR is a volatility indicator that measures the amplitude of price movements over a given period of time. By integrating the ATR into our EA, we can assess the
FREE

A powerful oscillator that provide Buy and Sell signals by calculating the investor liquidity. The more liquidity the more buy possibilities. The less liquidity the more sell possibilities. Please download the demo and run a backtest!
HOW IT WORKS: The oscillator will put buy and sell arrow on the chart in runtime only . Top value is 95 to 100 -> Investors are ready to buy and you should follow. Bottom value is 5 to 0 -> Investors are ready to sell and you should follow. Alert + sound will appe
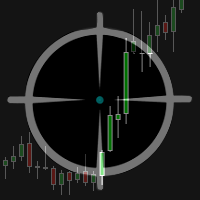
The Multicharts Crosshair draws a cross hair in any linked chart. The indicator can be used for comparison of symbol price levels in different time frame or to compare candles of different instruments in the same time frame
How it works: It can works from every linked charts where the indicator is installed towards the others or from the chart where is istalled towards the following linked charts . It can be shown just pressing a the key of keyboard. After installing the indicators in the char
The Trade Lines EA is an auxiliary Expert Advisor for automated trading based on levels. The EA opens deals at the specified lines when the price crosses them on the chart - the lines are active, they can and must be moved for the EA to operate with the greatest efficiency. The EA also includes the averaging, trailing stop and take profit setting functions. For the EA to work, it is necessary to select the required number of lines and the type of lines for the EA to trade. It is possible to enab
UZFX - MetaTrader 5 (MT5) için Marjin Gerekli ve Maksimum Lot Büyüklüğü komut dosyası, yatırımcıların 1 lotluk bir pozisyon açmak için gereken marjini hızlı bir şekilde belirlemelerine ve mevcut hesap özkaynaklarına göre işlem yapabilecekleri maksimum lot büyüklüğünü hesaplamalarına yardımcı olmak için tasarlanmıştır. Bu araç, risk yönetimi ve pozisyon boyutlandırma için gereklidir ve yatırımcıların işlemlerini verimli bir şekilde planlamalarına olanak tanır.
Özellikler:
Seçilen sembol üzeri
FREE
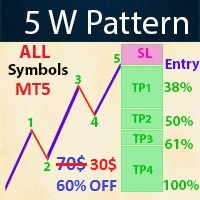
- Real price is 70$ - 60% Discount (It is 30$ now) Contact me for instruction, any questions! - Lifetime update free - Non-repaint - I just sell my products in Elif Kaya Profile, any other websites are stolen old versions, So no any new updates or support. Introduction The Elliott Wave in technical analysis describes price movements in the financial market that are related to changes in trader sentiment and psychology. The 5 W Pattern (Known as 3 Drives) is an Elliott Wave pattern that is forme

Setup Tabajara was created by a Brazilian trader known as "The OGRO of Wall Street" .
The idea of this setup is to indicate to the trader the current trend of prices and the type of operation should be looked for in the graph.
Operation
It does this through the relation of the closing price position and the of 20 periods, by painting the candles in 4 possible colors : Green -> Price rising in upward trend (Search entry points for PURCHASE) Black -> Price correcting in Bullish Trend (Sear
FREE
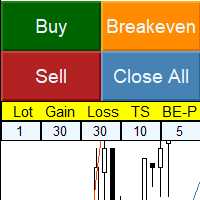
Simple panel with Stop loss (Loss), Stop gain (Gain) , Trailing stop (TS) and Breakeven (BE-P).
Lot is the number of contracts to be traded.
Gain is the number, in points, that the stop gain will be positioned. If you don't want to put stop gain, just put 0 (zero) in place and when you open the order it won't have this stop.
Loss is the number, in points, that the stop loss will be placed. If you don't want to put stop loss, just put 0 (zero) in place and when you open the order it won't ha
FREE

NATS (Niguru Automatic Trailing Stop) will help you achieve more profits, by setting the trailing stop automatically. Pair this NATS application with EA, or can also be used as a complement to manual trading.
A trailing stop is a powerful tool in trading that combines risk management and profit optimization.
A trailing stop is a type of market order that sets a stop-loss at a percentage below the market price of an asset, rather than a fixed number. It dynamically adjusts as the asset’s pric
FREE

The " YK Find Support And Resistance " indicator is a technical analysis tool used to identify key support and resistance levels on a price chart. Its features and functions are as follows:
1. Displays support and resistance levels using arrow lines and colored bands, with resistance in red and support in green.
2. Can be adjusted to calculate and display results from a specified timeframe using the forced_tf variable. If set to 0, it will use the current timeframe of the chart.
3. Uses th
FREE

Market Sentiment is an indicator for MT5. Market sentiment is the feeling or tone of a market . Also called investor sentiment, it is generally described as being bullish or bearish : When bulls are in control, prices are going up . When bears are in control, prices are going down . Markets being driven by emotions, the market sentiment is about feelings whereas fundamental value is about business performance .
Settings : Range in bars : numbers of bars used for the calculation, at your own c

Gold Miner MT5 strategy is based on the search for areas of concentration of prices of large buyers and sellers. In such zones, short-term trends are usually generated. This is a grid EA, but thanks to the function of overlapping unprofitable orders, it is able to withstand large drawdowns and recover the account. Works well on volatile pairs and gold (XAUUSD, GBPUSD, USDCAD, EURUSD, USDJPY, USDCHF, AUDUSD, NZDUSD ... ). It has many useful functions, such as closing orders on Friday or w

Do you want to see the future lines of the ZigZag indicator? This indicator will help you do that because the indicator model is based on two indicators: Historical Memory and ZigZag. So it can forecast the ZigZag lines. Very useful as an assistant, acts as a key point to forecast the future price movement. The forecast is made using the method of searching the most similar part in the history (pattern) to the current one. The indicator is drawn as a line that shows the result of change of the

This indicator is a simple tool to spot a possible trend.
When the ribbon below the price bars, It will turn to Green color and the trend is seen to be bullish When the ribbon above the price bars, it will turn to Red color and the trend is seen to be bearish. It can be used a either Entry Signal Exit Signal or trailing stop, so it is very versatile. By default color : Green is UP trend and Red is Down trend and this work perfect with Bar4Colors.ex5
FREE
Trade donchian breakouts with complete freedom. This EA can trade any breakout period, any timeframe, with pending or market orders- as desired- and implements many other useful features for the exigent trader, like customizable trading sessions and week days, a martingale mode and inverse martingale mode. [ Installation Guide | Update Guide | Troubleshooting | FAQ | All Products ] Easy to use and supervise Customizable trading direction Customizable donchian breakout period It can trade using

40% off. Original price: $50
Advanced Bollinger Bands Scanner is a multi symbol multi timeframe Bollinger bands dashboard that monitors and analyzes the Bollinger Bands indicator from one chart. This panel scans the Bollinger bands indicator in up to 28 configurable instruments and 9 timeframes for price overbought/oversold, price consolidation (Bollinger bands squeeze), and consolidation breakout (squeeze break) with a deep scan feature to scan all market watch symbols (up to 1000 instrument
40% off. Original price: $50 Moving Average Trend Scanner is a multi symbol multi timeframe triple MA crossover dashboard that helps traders to monitor, and identify potential market trends from one chart. This panel scans 3 moving averages in up to 28 configurable instruments and 9 timeframes for triple moving average alignment and moving average crossover with a deep scan feature to scan all market watch symbols (up to 1000 instruments!).
Download Demo here (Scans only M1 and M6) Setti
MetaTrader mağazası - yatırımcılar için alım-satım robotları ve teknik göstergeler doğrudan işlem terminalinde mevcuttur.
MQL5.community ödeme sistemi, MetaTrader hizmetlerindeki işlemler için MQL5.com sitesinin tüm kayıtlı kullanıcıları tarafından kullanılabilir. WebMoney, PayPal veya banka kartı kullanarak para yatırabilir ve çekebilirsiniz.
Alım-satım fırsatlarını kaçırıyorsunuz:
- Ücretsiz alım-satım uygulamaları
- İşlem kopyalama için 8.000'den fazla sinyal
- Finansal piyasaları keşfetmek için ekonomik haberler
Kayıt
Giriş yap
Gizlilik ve Veri Koruma Politikasını ve MQL5.com Kullanım Şartlarını kabul edersiniz
Hesabınız yoksa, lütfen kaydolun
MQL5.com web sitesine giriş yapmak için çerezlerin kullanımına izin vermelisiniz.
Lütfen tarayıcınızda gerekli ayarı etkinleştirin, aksi takdirde giriş yapamazsınız.