YouTube'dan Mağaza ile ilgili eğitici videoları izleyin
Bir alım-satım robotu veya gösterge nasıl satın alınır?
Uzman Danışmanınızı
sanal sunucuda çalıştırın
sanal sunucuda çalıştırın
Satın almadan önce göstergeyi/alım-satım robotunu test edin
Mağazada kazanç sağlamak ister misiniz?
Satış için bir ürün nasıl sunulur?
MetaTrader 5 için yeni Uzman Danışmanlar ve göstergeler - 187
HEDGING ACCOUNTS ONLY!!! Double Trouble RSI uses 2 Moving averages to define trend then opens trades based on RSI over bought or over sold conditions. It also has a time filter to define trading times. Default settings are for 5 minute timeframe. This EA is highly configurable and can be optimized to be used on most instruments and currencies, including DAX and S&P 500
The money management section is also highly configurable and does not make use of any risky strategies like martingale etc..
FREE

This EA trades a weekly GAP, opening trades on the Friday before the market close and closing trades on Monday morning. The expert works from one chart for all currency pairs: EURUSD, GBPUSD, USDCHF, AUDUSD, USDCAD, EURJPY, EURCHF, EURAUD, EURCAD, EURNZD, GBPJPY, GBPCHF, GBPAUD, GBPCAD, CHFJPY, AUDJPY, CADJPY, AUDCHF, AUDCAD, AUDNZD. If the symbols in the "Market Watch" have a suffix, then specify it in the expert parameter "Symbol_suffix". Version for MT4
Expert setup Download the latest sett

Секвента Демарка (Sequential) - индикатор, демонстрирующий развитие тренда, его структуру. Довольно точно отображает начальную и конечную точки, важные точки перелома. Срабатывает по открытию свечи, поэтому перерисовок не будет никогда.
Здесь нет сложных формул, только статистика, отсчёт свечей, выбранных по определённым критериям. При этом индикатор может давать очень точные сигналы для входа, особенно при поддержке какого-нибудь индикатора уровней, например, этого . Алгоритм нахождения сигнала

The Fixed Trend indicator searches for and displays the turning point price on the chart. Trend indicators are one of the main tools for analyzing trends in the Forex currency market.
The goal, which was pursued in its creation, is to obtain signals that will give less noise and respond more quickly to price changes. The Fixed Trend indicator is a trend indicator that is used to search for reversals when its boundaries break.
Trend indicators allow you to effectively determine the direction o

Join Deriv link on profile>>>
GET THIS FULL COPY AND GET ANOTHER FREE INDICATOR ONE OF THE BEST AND USEFULL INDICATORS IN THE WORLD ..This is the one of the best usefull indicators which has chosen to be used by top traders in the world.
AUTOMATIC SUPPORT AND RESISTANCE This way of trading is also called Supply and demand, On this way of trading you can see auto colours appear where the market changes direction buying or selling Direction.
ALL KIND OF PAIRS METALS AND INDICIES ARE INCLUDED A

The Didi Index is an indicator that helps in the identification of the so called “Didi Needles” (Agulhada do Didi), a method created by the experienced Brazilian trader Odir Aguiar (Didi).
DIDI NEEDLES EXPLAINED
The concept of the needles is simple: 3 moving averages are added to the chart (by default 3, 8 and 20 periods, simple mode), and whenever all 3 averages pass simultaneously inside the real body of a candle, the needling occurs. It was named after the movement of passing a thread throu

With the SR Dashboard, you get a powerful tool to control some of the most important information in trading. Assemble a setup according to your strategy and get informed as soon as this setup is valid. Assign scores to defined conditions and let the Dashboard find them. Choose from Trend, Average Daily Range, RSI, Moving Averages, Pivot (Daily, Weekly, Monthly), Highs and Lows, Candlestick Patterns. What can you do with this tool? Use the dashboard as a powerful tool for your discretionary trad

Set your Stop Loss, Take Profit and enter the operation and with the Close Position button, exit the operation whenever you want and safely. What's more, let us control your operation with Trailing Stop. With Expert Trade Control, you can enter a trade with your stop loss and take profit defined, but if you want to leave before the market reaches these targets, just click on "close position" and your position will be closed at the same time.
Mechanisms like this prevent a counter-order from be

FX Trade Manager is a tool used to open and manage your buy and sell orders with few clicks and with ease in MetaTrader 5 . Through this fantastic tool you can open orders like: SELL BUY SELL LIMIT BUY LIMIT You can open an order just by informing the lot volume you want, your takeprofit and stoploss and clicking on the opening button, or just placing the lot volume you want and clicking on the opening button.
If you don't know the lot size you want to open, let the FX Trade Manager tool do it

Chaoszillator Expert Advisor is a swing trader designed to be not only profitable but be stable and consistently profitable in uncertain times.
Because of the extreme accuracy of the entries and the algorithms ability to filter out bad trades, the system does not take new trades every day.
To make our system as user friendly as possible we have spent hundreds of man hours finding the best pairs and fine tuning the settings for each currency pair, so you don’t have to.
Our technology is design

This EA is a robot based on two EMAs and an standard MACD. No martingale or grid strategies. All positions have their own stop-losses. Trading strategy: This robot uses fast and slow EMAs to check the trend of the currency, once the trend is known, the standard MACD will trigger the correct order. Placing the best take profit and stop loss depending on the strengh of the trend. The Expert Advisor is designed for best performance in EURUSD currency pair at a 15m timeframe. Both slow EMA and fast
FREE
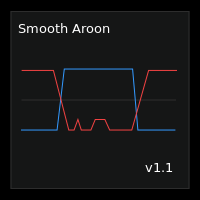
Smooth Aroon is a version of the Aroon Up and Down with smoothing and filtering.
Features :
Smoothing : You have smoothing from 0 to 99 . To smooth a signal, find the maximum value of the points in question then set the smoothing level above the maximum value. For example : If you want to smooth all signals below 30, then you should set the smoothing level above 30 This also smooths all signals above 70, since the Aroon Up and Down Oscillates between 0 and 100. Filtering : If you only w
We would like to introduce you to our newly developed ZScore Dashboard Indicator for the Metatrader 5 platform. It automatically calculates and updates the ZScore values of Price (Z) and Tick Volume (ZV) as it changes in the particular timeframe chart to which the indicator is applied to. The Dashboard contains 4 columns per each average. Each average has the following columns: ZScore of Price (Z), 3 period SMA of ZScore of Price (ZMA), ZScore of Tick Volume (ZV) and a 3 period SMA of ZScore of

MT5 EA trading system for BTCUSD
T vack Beginners
Use a brokerage firm with narrow spreads.
trading style: Grid type
time frame: 15min
No indicators are needed on the chart.
Known for its high trading direction analysis and high win rate using fundamental analysis
It is a trading method that incorporates logic by combining half & half tralipi type EA.
Half-and-half type holding long-term unrealized loss due to high price buying and bottom price selling,
which is a weak point of Tra

Bu gösterge, pratik ticaret için mükemmel olan otomatik dalga analizine yönelik bir göstergedir! Dava...
Not: Dalga sınıflandırması için Batılı isimleri kullanmaya alışkın değilim. Tang Lun'un (Tang Zhong Shuo Zen) adlandırma kuralının etkisiyle, temel dalgayı kalem , ikincil dalga bandını ise segment olarak adlandırdım. aynı zamanda segmentin trend yönü vardır. Adlandırma esas olarak trend segmentidir (bu adlandırma yöntemi gelecekteki notlarda kullanılacaktır, öncelikle söyleyey

Necessary for traders: tools and indicators Waves automatically calculate indicators, channel trend trading Perfect trend-wave automatic calculation channel calculation , MT4 Perfect trend-wave automatic calculation channel calculation , MT5 Local Trading copying Easy And Fast Copy , MT4 Easy And Fast Copy , MT5 Local Trading copying For DEMO Easy And Fast Copy , MT4 DEMO Easy And Fast Copy , MT5 DEMO MACD is called Convergence and Divergence Moving Average, which is developed from the double e
FREE
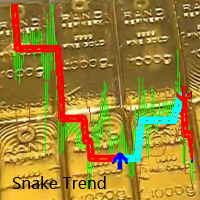
Index content: 1. The benchmark price, refer to the benchmark price. In the short term, the price fluctuates continuously and disorderly, and the short-term fate will appear unpredictable 2. Reference trend direction
Suggest: Weaken the short-term fluctuations of the K-line and follow the mid-to-long-term trend.
"Grow together!" "Cooperative QQ:556024" "Cooperation wechat:556024" "Cooperative email:556024@qq.com"
"The trend is forming or dying, and following the dancing snake circling

We often need to know the sudden change in trend that happens on the graph and this can be confirmed through indicators.
This indicator shows the moments of trend reversal and how in which trend the price is shifting.
Custom background, no need to configure the colors in the chart, just drag the indicator!
Indication with arrows.
- Blue arrow: Upward trend.
- Pink Arrow: Downward Trend.
NOTE: Free indicator, support may take a while to respond.
FREE
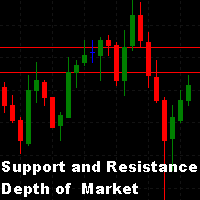
We often look for support and resistance points on the chart. One of the techniques that can be used is through the quantity of lots offered in the order book. This indicator searches for the largest lots in the order book and draws them on the graph in the form of lines, thereby obtaining where is the greatest concentration of lots offered on the centralized stock market at that time, thus configuring possible support and resistance lines.
- The number of lines to draw can be defined by the u

VWAP is an intraday calculation used primarily by algorithms and institutional traders to assess where a stock is trading in relation to its weighted average volume for the day. Day traders also use VWAP to assess market direction and filter out trading signals. This indicator is used to analyze and calculate the Vwap from a certain point on the graph, which is widely used to analyze the beginning of a movement of the price relationship with the volume.
- Multi Vwaps on the same chart, placed
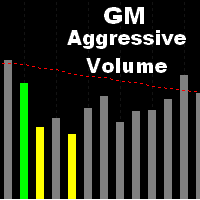
Volume is a resource used by analysts of various methodologies, precisely because it shows the confirmation of movements and the market's progress. It is an indicator that analyzes the financial quantity that was traded during a certain period.
This indicator analyzes the amount of volume for each candle, when there is an excessive increase in this, it differs from the others by a colored bar.
In addition to informing in the form of colored bars, this indicator allows you to emit an audible w

A simple volume indicator according to the color of the candle!
- Custom background!
- Supports Volume by Ticks or Real Volume.
The original Metatrader Volume indicator does not show the colors of the bar according to the color of the Candle, it only changes color when the volume of a candle is greater than the previous one, this sometimes creates confusion for beginners and does not know the real reason for the color change.
Free indicator, support may take a while to respond!
FREE

This multicurrency Expert Advisor uses 28 currency pairs. The predictions are based on two indicators: Bollinger Bands and DEMA.myfxbook.com/members/MUSBREATH Settings for MultiBolbands The default settings are for the EURUSD H1 Algorithm1. Optimization from 2016 year Before testing in the strategy tester or installing the EA on a chart, if you want to speed up the testing process, set the ShowTradePanel advisor setting to false In the strategy tester, set the "Open prices only" trading mode, t

Hello You can copy orders between terminals for any computer via Internet (MT4 to MT4) or (MT4 to MT5) or (MT5 to MT4) or (MT5 to MT5) it's fast Open orders Modification Stop Loss and Take Profit Close Orders This is EA (Master) put it in Experts folder you must buy (Copy orders for any computer via Internet Slave) EA too from this link if you want to copy to MT4
https://www.mql5.com/en/market/product/55097 if you want to copy to MT5
https://www.mql5.com/en/market/product/56414
Please w
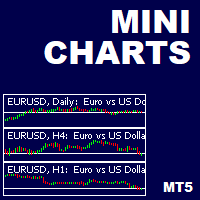
This is a utility indicator that creates mini charts on left side of the chart you are looking at.
It is very useful to watch many timeframes simultaneously, without having to change between multiple charts. Its configuration is very simple. You can have up to 4 mini charts opened. They automatically load the template of the "parent" chart. If you have any doubt please contact me. Enjoy!
This is a free indicator, but it took hours to develop. If you want to pay me a coffee, I appreciate a lot
FREE

Mr Martin MT5 EA Mr.Martin MT5 is a fully automated Expert Advisor that is designed for quiet, investment trading over a long period of time. The Expert Advisor uses in its strategy the principles of averaging unprofitable positions, but due to the unique input system, several filters, and the deposit protection system, expressed in the SL_percent_balans parameter, is completely safe for your deposit.
The default settings are optimized to work on EURUSD M1 GMT+2 and can be used in tra

ISS Station MT5 it is a Secure Automated Software for trade Forex market and indices.
The architecture is a Fully Automatic Autonomous Robot Expert capable of
independently analyzing the market and making trading decisions
ISS Station MT5 Have neurals nets to used the correct algoritm in the correct market situation
ISS Station MT5 It is an advanced trading system. This is a fully automatic Expert Advisor.
ISS Station MT5 is a plug and play system ISS Stat

You know you are not a shark but maybe you can be a remora fish. You just have to locate a shark and feed on the remains. This system uses an indicator that detects the movements of the shark and positions itself in favor of it, taking advantage of its capture.
This system analyzes the market looking for the waves that the shark produces in the forex sea when it attacks the market. Once the shark attack is located, it enters the market to catch a piece of the catch. All operations have their

Protect your EA from unauthorized use. With EA Locker you can generate individual licenses for your EA to your customers.
Product blog page Download MT4 version from here
Protection consists of three parts: 1. Your Unique EA identifier 2. User Identifier 3. Expiration date
Description of parts: 1. EA ID is your internal EA identifier. Itcan be the short name of the EA. (MyGridEA, TradeCopierEA...) 2. User identifier can be anything user specific data (Mt4 account number, Account number + User

The Inno Trend indicator tracks the market trend with reasonable reliability, ignoring sharp market fluctuations and noise around the average price. The Inno Trend indicator simplifies the decision-making process by recognizing reversals using a built-in algorithm, and then confirming signals at support / resistance levels, implements a kind of technical analysis based on the idea that the market is cyclical in nature. It can be used both for pipsing on small periods and for long-term trading.

Genaral: Not martingale, not a grid; Use on EURUSD Use on M5
Signals: There is a good rational algorithm. Work of two indicators: 2 DeMarker (from 2 timeframes) (you can set a separate Timeframe for each indicator)
Stop Loss/Take Profit: There is a good money management system (there are several type for trailing stop loss); There is virtual levels of Stop Loss / Take Profit; There is smart lot (percent by risk) or fix lot
Important: EA can work on closed candles, and on current candles;
FREE

Introductory offer.
The EA has been built around the London Stock Exchange open and the currency pair GBP/JPY. It is based on taking entries during the first hour of the London Stock Exchange open due to the volume in this period. The EA will take a maximum of one trade per day; it will not take multiple trades. The EA also has the option to use the MACD for exit management instead of a fixed take profit. The use of the MACD for exit management is to maximise trade exits at potential reversal

Hello This EA (expert advisor) will open orders from Telegram "Auto Open orders from Telegram" (Telegram to MT5). Please watch our video for more details: https://www.youtube.com/watch?v=p06o1xgsD5c
download instructions from here https://drive.google.com/file/d/1rwZnvgaWoi3gSkEwsi7s5jeatjJLGTWc/view?usp=sharing
Good luck -------------------------------------------------------------- السلام عليكم هذا الاكسبيرت سيفتح صفقات آلية وفورية من تليجرام (Telegram إلى MT5) يرجى مشاهدة الفيديو لمزيد من ا

For those traders who really care about Volume as an important vector information on Price Action, here is an exclusive idea & creation from Minions Labs: Volume Speed . The Volume Speed indicator shows you visually how much time (in seconds, minutes, hours, you choose) the Volume took to reach the Average Volume of the past bars. This way you can have the exact idea of "what is happening right now with the Volume of the current bar..." and take action accordingly with your strategy, having even

This indicator is created by using an exclusive algorithm to indicate you Buy or Sell in an accurate way all the possibles reversals within a normalized trending bands. The main goal for this algorithm is to achieve fast profitable movements and aggressive retracement. Thanks to the normalized bands, using the noises of the market. We have added the "Golden Trade", we define it as the perfect order: For those orders that had the perfect entry price. They were always in profit, or the final pr

GO Trendline was created to make it easier to train forex trading skills in backtester and at the same time make it easier to live trade using trendlines.
Setfile | Bot explanation: here | How to trade properly : here | MT4: here Input parameters: 1. Manage Open Positions Trade Buys: allow buys Trade Sell: allow sell Open Position Mode: Select the open position method Reverse the Auto mode signal : Reverse the signal Delete trendline after opening a position: set false for continuous pen

Hello
This EA for send Orders Signals when you open or close order and send statics to your channel in Telegram with sum of profit or Loss Pips you can share your orders with your clients in your telegram please watch our video to see how it is fast. https://www.youtube.com/watch?v=u_7twtYZhyI
you must have Telegram channel then make bot and give it Permission and get token (watch this video to know how do it) https://www.youtube.com/watch?v=x1bKWFOjSBE
and you must download this files https

Hello You can copy orders between terminals for any computer via Internet (MT4 to MT4) or (MT4 to MT5) or (MT5 to MT4) or (MT5 to MT5)
it's fast Open orders Modification Stop Loss and Take Profit Close Orders This is EA (slave) put it in Experts folder you must buy (Copy orders for any computer via Internet Master) EA too from this link if you want to copy from MT4
https://www.mql5.com/en/market/product/55096 if you want to copy from MT5
https://www.mql5.com/en/market/product/56397
Plea

This EA is a unique approach to Gold day/swing trading. The objective of the strategy is to: Identify ideal and repeatable trade entries with high level of certainty Create a day trading strategy which doesn’t require a hard SL and TP Use alternate risk management mechanism instead Visualize and auto manage trades based on S/R A trade management solution that can be applied to any trading pair
Please also install the free custom indicator: FibonacciVPT https://www.mql5.com/en/market/product/
Multiple Exponential Moving Averages from two different timeframes have been used in making this fully automatic trading robot. The backtest screenshots speak the rest. The amount to be invested has to be put manually in input tab. So works on all account sizes. For best results - Timeframe = 15M - Leverage = 100 - Preferred pair = EURUSD but gave profit on other pairs too. - Avoid trading between last week of December and first week of January.

Ema Pro v1.17 is a newly developed robot featuring a classic crossover strategy using two MA indicators. What sets it apart is the integration of a data miner. Additionally, the system supports various order types and enables flexible trading. Exit rules, such as take profit, stop loss, trailing, and break-even, are determined based on independent ATR indicators. The default configuration targets EURUSD in the H1 time frame, though the robot can also be applied to XAUUSD in the same time frame.

MOST IMPORTANT INFORMATION
<1>
Exactly this program was used to set World Record in Trading 2020
Account Equity was increased from $1,000,000 to $100,000,000 in 16 days
Details => www.mql5.com/en/users/AIS
<2>
In the last days of this record the position was creating by 1000-2000 orders
It was used the computer with 1 core Pentium 4 CPU at 2.8 GHz and 1 GB memory
In the last two days the daily profit was $40,000,000 every day
<3>
It was 100% manual trading
And this special program was used to

Trader's Panel is a simple EA for managing trades once open. Your options for managing open trades are to close an entire open trade, close a percent of an open trade, which can be input from the trader panel, and then set stop loss to break even on an open trade. The Trader's Panel hovers at top left of screen right below the one click order buttons. **Note that this EA does not open trades. It only manages trades once they are open.

This plots Fibonacci deviation levels above and below a moving average of the price. Companion indicator to the " Golden Bull Wave Trader " expert advisor which uses volume\price trend to determine price reversals. https://www.mql5.com/en/market/product/56291 The expert advisor and this indicator were created in order to: Identify ideal and repeatable trade entries with high level of certainty Create a day trading strategy which doesn’t require a hard SL and TP Use alternate risk management me
This utility sends notification to trader’s MT5 (for MT4 version, checkout this link ) mobile app, to remind traders about their open positions. Super useful for part time traders to keep track and not forget any positions. To turn on notification, please visit this link (https://www.metatrader4.com/en/trading-platform/help/setup/settings_notifications)
Features Keep track on open orders (pending orders, running orders) Customize time to send notification Customize notification interval (se

Overview
The Expert Advisor allows you to receive notifications to the mobile phone (or tablet PC), mailbox or play the sound alert when some events occured: opening or closing position (also closing all positions), placing or deleting pending order; changing open price, stop loss or take profit; the account balance, equity, margin level, free margin or drawdown has reached the user specified level. You can specify a notification interval, notification text template and audio file for sound aler

This is Advanced NotifyMe version with large interface.
Overview
The Expert Advisor allows you to receive notifications to the mobile phone (or tablet PC), mailbox or play the sound alert when some events occured: opening or closing position (also closing all positions), placing or deleting pending order; changing open price, stop loss or take profit; the account balance, equity, margin level, free margin or drawdown has reached the user specified level. You can specify a notification interval,

This is the MT5 version. Get Dual Onset MT4 here
It is an algorithm to detect trend changes early. You should try multiple values for the Multiplier parameter (1 <value <10 recommended). At first glance you can see effective entries. This is, in fact, one of the rows that Geleg Faktor initially had. But it was removed because it was no longer needed. The other rows were sufficient for G.Faktor's effectiveness, but I still wanted to share this one.
Always test before using it on your live ac
FREE

This is MT5 version Get Tunnel Warrens MT4 here
Here are several indicators that work together. It basically works with moving averages and various levels of ATR creating a dynamic channel through which the price is drained. As I always recommend, you should try it before using it in live so that you understand how it works. The market entry signal is similar to other MA indicators, but with this one you also have a graphical analysis of the moment when the trend is found and dynamic levels to
FREE

This is the MT5 version. Get Q-Math MT4 here
Check it out and if you like it just enjoy it. Try various values to find the setting that best suits your trading. Upward signal if the indicator is colored lawn green and bearish signal if the indicator is gray. You can use the line itself to trailing stop when you open orders. This is just a tool. A complement. It is not a strategy. Combine it with your own analysis Just download it and try it, it's free.
FREE

Excellent dashboard for analytics. The panel helps to analyze the values of the TRIX (Triple Exponential Moving Average) indicator and its signals.
With this panel you can: watch the current signal from TRIX on all timeframes; watch the current signal from TRIX for different symbols; watch the current TRIX value; several types of signals for analytics.
Values in a table cell: value of TRIX
Signal type: TRIX crosses "0" line TRIX upper/lower "0" line
Work option: all symbols added to t
The VR Close orders script is designed to close positions in the terminal at a profit or loss mark set by the trader. The program is written as a script and can work together on the same chart with any other indicators and expert advisors. The program has a simple visual panel and is easy to configure with the mouse. With this program's help, the trader can automatically close positions and delete orders depending on the conditions set. There is often a situation when you need to close position
FREE

Wrote for yourself a good expert for profitable trading, which can help you to increase your deposit. He can track all or selected trading instruments of your broker for sharp price hikes. Stocks are best suited for tracking and trading as more trendy instruments than Forex, and are more predictable in their movements, especially on strong positive or negative news. For example, the Tesla stocks increased 60 percent in two weeks after the split was announced (screenshot with chart attached), and

The expert Advisor is designed for dealing with complex situations, including Loka. In addition, the expert Advisor can successfully trade itself. To do this, it provides auto-trading functions. Parameters BUY – allow to resolve sales
SELL – allow to resolve purchases
Step = 60; – step between averaging positions
ProfitClose – closing profit in currency
Lot = 0.01; – the first lot of averaging
K_Lot = 1.5; – averaging coefficient
Max_Lot = 10.0; – maximum possible volume
StartLot

Mir Station MT5 it is a Secure Automated Software for trade Forex market and indices.
The architecture is a Fully Automatic Autonomous Robot Expert capable of
independently analyzing the market and making trading decisions Mir Station MT5 Have neurals nets to used the correct algoritm in the correct market situation
Mir Station MT5 It is an advanced trading system. This is a fully automatic Expert Advisor.
Mir Station MT5 is a plug and play system Mir Sta

FIRST 10 COPIES AT 30 USD, NEXT PRICE WOULD BE 50 USD
HAWA MOMENTUM & TREND PRO (MT5) Advanced trading indicator with proper pre-defined entry and exit levels with almost 80% win rate. Its smart and advanced algorithm detects trend and trend strength using momentum for maximum profits and send signals after filtering out market noise. SETTINGS: Please make sure all inputs are NOT "false" in indicator properties otherwise it will not display identified trades. Directory Location: Download fil

Данный индикатор предназначен для мониторинга торговой активности вашего счета. Особенно полезен будет тем, кто торгует сразу на нескольких инструментах. В одном окне индикатора собрана наиболее важная информация о счете с детализацией по инструментам и мониторингом заработка. Описание настроек: Start from date history - с какой даты индикатор будет обрабатывать торговую историю Max symbol on screen - индикатор берет данные по символам из обзора рынка. В данной настройке вы можете ограничить

This strategy was learned from Stormer to be used on B3.
Basically, 15 minutes before closing the market, it will check RSI and decided if it will open an position.
This strategy do not define a stop loss. If the take profit reach the entry price it will close at market the position. The same happens if the maximal number of days is reached.
It is created to brazilian people, so all configuration are in portuguese. Sorry
Activations allowed have been set to 50.

️ SOBRE A ESTRATÉGIA
O robô DayLong foi programado a partir da estratégia desenvolvida pelo engenheiro Vinicius Reis após anos de trading, centenas de alunos formados e milhares de horas operando.
Eles utilizam em sua fórmula alguns indicadores e osciladores parametrizados de maneira a prever os pontos explosivos de início de tendência do índice futuro brasileiro.
Com seus parâmetros otimizados pelo histórico de movimentação do ativo, foram configurados para entrar em trades
Thesoo 89 is a multi-functional Expert Advisor working with Triangular or Single Pair systems, including Scalper Martingale Anti-Martingale MultiCurrency / SingleCurrency Default parameter for Multi Currency (setfile T88-1), works with Anti-Martingale using the multiplier constant This EA can manage transactions made manually from all platforms including from a mobile phone Time Frame: Works on all Timeframes, preferably M1 or M5
Pairs: Default Paramaters for Multi Currency Triangular, works b

The Expert Advisor helps in manual trading or closes the positions of another Expert Advisor. He is designed to automatically close position or group positions when the total conditions is reached. He does not open deals on his own. The EA can close positions on one symbol, on the entire account or on a specified magic number. You can specify in the settings the general Take and the general StopLoss for a group of positions for close. If you have any questions, comments or suggestions, write me

This robot is not such a martingale and is designed based on a special and unique strategy which is beneficial for traders who are looking for quick profitable trading processes, that is why it works in 5 minutes timeframe as well as theCurrency pair of EUR/USD. Instructions for EXPERT settings FastM5: Adjust/select 0.1 for any any 1000 USD, “refer to the photos attached” It means you need to trade 1 Lat per 10000 USD.

Triple Threat is the latest offering from Algotrading_za It uses Bollinger Bands and RSI to determine entry positions with MACD as confirmation of trend. It also has a time filter to define trading times. This EA is highly configurable and can be optimized to be used on most currencies.
The money management section is also highly configurable and does not make use of any risky strategies like martingale etc..
FREE

Time to Trade Trading timing indicator is based on market volatility through 2 ATR indicators to determine the timing of a transaction. The indicator determines the times when the market has strong volatility in trend. When histogram is greater than 0 (blue) is a strong market, when histogram is less than 0 (yellow) is a weak market. Should only trade within histograms greater than 0. Based on the histogram chart, the first histogram value is greater than 0 and the second histogram appears, this
FREE
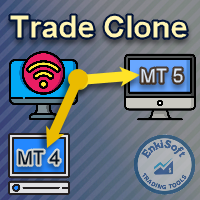
EnkiSoft Trade Clone EA new!
User description in MQL5 blog
You can use it on unlimilted clients for unlimited time! MT4 version download here
With Trade Clone EA you can trade on multiple MetaTrader 4 and MetaTrader 5 accounts simultaneously, clone the trades of any trading robot from server account to your friends and family accounts. Note: All MetaTrader 4 and MetaTrader 5 must run in same computer, or you need copy the trade file to the Client computer. You can run multiple Tr
EnkiSoft Trade Clone EA
User description in MQL5 blog New version 1.57 Read updates MT4 version download here
With Trade Clone EA you can trade on multiple MetaTrader 4 and MetaTrader 5 accounts simultaneously, clone the trades of any trading robot from server account to your friends and family accounts. Note: All MetaTrader 4 and MetaTrader 5 must run in same computer, or you need copy the trade file to the Client computer. You can run multiple Trade Clone EA as server, and yo

This Currency Meter Calculates Strength Using a currency basket of 28 pairs? This Currency Meter uses a basket of 28 currency pair to define strength. This is very important because it gives an wholesome view of the strength of a currency by considering its reaction to all major currencies paired with it.
This Currency Meter is Multi-timeframe!!! Majority of the currency strength indicators around the market today only has a single time frame view. Even with the so called multi-timeframe versio
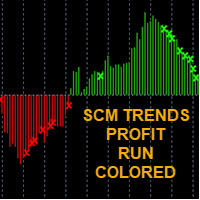
-EASY TO FOLLOW TRENDS -RED SELL / GREEN BUY -CROSS SIGNAL IS MEAN "TRENS WARNING" TO EXIT ORDER (WEAK TRENDS)
-WITH AUDIBLE ALERT ON/OFF
SCM indicator with different colors at levels 0, 100 and -100. The cross is a signal for " Exit" This exit signal is effective especially in short-term breakout trades, because it prevents early exiting at small corrections.
*****TIP EURUSD/BTC TF 10 min is work very Well****
****** GOLD TF15min is work very Well***** (after TF 15min show exit buy and sel

GOLD EAGLE is a swing strategy that is for the market in flat, which is 80-90% of the time. The GOLD EAGLE Expert Advisor is optimized for the XAUUSD (GOLD) pair. This is a trend scalping strategy using the TrendLine PRO indicator as an input signal. The Expert Advisor opens the first order at the signal of the indicator and fixes the TP at a given level, but if the price does not reach the TP level and rolls back, an additional order is automatically opened averaging the level of the total TP,

Professional tool for professional traders It allows you to browse all available financial instruments and select best ones to trade with lightning speed.
Fastest market screening ever
Move your mouse over the instruments and instantly see 3 charts with selected timeframes and predefined indicators! Click on the symbol name to hold it. Use UP and DOWN keys to select previous / next instrument.
Ultimate charting Smooth scale, automatic indicator lines width, smart grid and much more. You'll li
MetaTrader mağazası, alım-satım robotları ve teknik göstergelerin benzersiz bir deposudur.
Yatırımcılara sunduğumuz benzersiz hizmetler hakkında daha fazla bilgi edinmek için MQL5.community - Kullanıcı notunu okuyun: alım-satım sinyallerini kopyalama, freelancerlar tarafından geliştirilen özel uygulamalar, ödeme sistemi aracılığıyla otomatik ödemeler ve MQL5 Bulut Ağı.
Alım-satım fırsatlarını kaçırıyorsunuz:
- Ücretsiz alım-satım uygulamaları
- İşlem kopyalama için 8.000'den fazla sinyal
- Finansal piyasaları keşfetmek için ekonomik haberler
Kayıt
Giriş yap
Gizlilik ve Veri Koruma Politikasını ve MQL5.com Kullanım Şartlarını kabul edersiniz
Hesabınız yoksa, lütfen kaydolun
MQL5.com web sitesine giriş yapmak için çerezlerin kullanımına izin vermelisiniz.
Lütfen tarayıcınızda gerekli ayarı etkinleştirin, aksi takdirde giriş yapamazsınız.