YouTube'dan Mağaza ile ilgili eğitici videoları izleyin
Bir ticaret robotu veya gösterge nasıl satın alınır?
Uzman Danışmanınızı
sanal sunucuda çalıştırın
sanal sunucuda çalıştırın
Satın almadan önce göstergeyi/ticaret robotunu test edin
Mağazada kazanç sağlamak ister misiniz?
Satış için bir ürün nasıl sunulur?
MetaTrader 5 için yeni Uzman Danışmanlar ve göstergeler - 163

"ONE SHOT, ONE KILL" - Trade like a Pro SNIPER . The best EA for anyone who loves the ACCURACY, PATIENCE, PERFECTION. The EA works like a sniper who hidden and waits until the best chance coming. So that, it only places about one order per month on average. While waiting, it takes time to analyze the market to find a unique pattern with the highest win rate (you can see it takes time in the backtesting). - This EA isn't suited for people who want to trade a lot of orders per day, trade every day

"Quick Copier" is designed to copy trading without any complicated settings. It copies master orders faster than "Just Copier" (https://www.mql5.com/en/market/product/20920). Please also check this product at fxina.hostingerapp.com. The copy can be done in one PC. One EA can be set as master (provider) or slave (receiver). The receiver lot can be set to multiple providers lots. Any type of copy is available. MT4 -> MT5 MT4 -> MT4 MT5 -> MT5 MT5 -> MT4 If you want to copy MT4 -> MT5 or MT5 -> MT
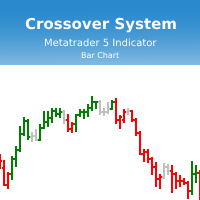
Индикатор Crossover System основан на трех скользящих средних, который изменяет цвет баров в зависимости от определенных условий скользящих средних. Этот индикатор позволит реализовывать системы из одной скользящей средней, из двух скользящих средних и из трех скользящих средних. Параметры индикатора: fastperiod - период быстрой скользящей средней fastMethod - метод построения быстрой скользящей средней fastPrice - метод вычисления быстрой скользящей средней fastshift - сдвиг быстрой скользя

Blahtech Fisher Transform indicator is an oscillator that displays overbought and oversold locations on the chart. The Fisher Transform algorithm transforms prices with any distribution shape into a normal distribution. The end result is a curve with sharp turning points that may help to identify bullish or bearish trends. Fisher Transform values exceeding 1.66 on the daily chart are considered to be good areas for reversal trades. Links [ Install | Update | Training | All Products ]

Trade easily from the chart with CAP Trade Pad EA . It handles risk management for you and can perform several useful tasks with your existing trades. Trade easily from the chart Trade with precise risk management hassle free Set your desired stop loss and take profit levels Close all existing trades with a single click Delete all pending orders with a single click Reap partial profits with a single click It has no input parameters
How to Use Please Read this blog - Details Information in o
FREE
This indicator helps you control several pairs in a small workspace, therefore, it is not necessary to open several charts on the platform to do so. The indicator shows sequentially up to 6 different pairs, besides that each of these pairs has a button with which you can stop the indicator to observe the selected pair. Place the indicator on a chart to monitor several pairs and the rest of your space use it on the chart of the pair you wish to observe in detail. MT4 version Parameters Ob
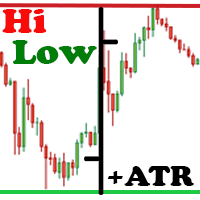
The Hi Low Last Day ( Hi Lo Last Day ) indicator shows the high and low of the last trading day and the second trading day. There are many trading strategies on the daily levels. This indicator is indispensable when using such trading strategies. In fact, everything is simple in trading, you just need to understand and accept it for yourself. There is only price!!! What is price? This is the level on the chart. The level is the price that the buyer and the seller are holding back. What price is

Blahtech Moving Average indicator is a multitimeframe version of the standard Moving Average indicator. It is also enhanced with customisable alerts, period breaks and other configuration options. The 50 day and 200 day moving averages are widely followed by investors and traders, with breaks above and below the MA lines considered to be signals of interest. Links [ Install | Update | Training | All Products ]
Feature Highlights Up to three timeframes Configurable calculation variab
FREE
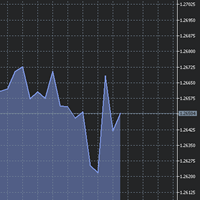
The utility Filled Area Chart adds to the standard set of price presentations. It is a brand new, nice price chart. You will certainly like it if you want to feel yourself a trader born under the Bloomber lucky star.
The Properties allow to set the colors and other things: Color preset - choose a preset or set to "Custom" and set your own colors using the properties below.
Custom area color - color of the area below the price line. Works only with Color preset = Custom.
Custom chart color -
FREE

The purpose of this utility is to manage one or more subwindow in the same chart by opening and closing them through a button or the keyboard keys
How it works: If you want to handle more than one subwindow you need to reinstall the indicator . In this case some setups has to be customized onlu in the last subwindow installed and others setups in the installed subwindow during the first time installation. They are denoted in the input rispectively as ' LW ' and ' IW '.
First of all insta

One of the best tools for analyzing volume,
Weis Wave was idelized by David Weis, to facilitate the reading of directional flow. For the VSA method disciples it is an evolution of the practices created by Richard Wycoff, facilitating a predictive reading of the market, always seeking an accumulation and distribution of the negotiated contracts.
Cumulative wave volume Range of wave ( removed) Average Wave volume Ref "Tim Ord lectures" ( removed)
FREE

KT Momentum Arrows Indicator is based on a momentary breakout which is calculated using the bands deviation and emerging volatility in a certain direction. A buy signal is generated when the price closes above the upper band and a sell signal is generated when the price closes below the lower band. A magnitude coefficient is used as the input which affects the band deviation and volatility at the same time. The coefficient value should be carefully selected and analyzed based on the instrument a

Highly configurable OBV indicator.
Features: Highly customizable alert functions (at levels, crosses, direction changes via email, push, sound, popup) Multi timeframe ability Color customization (at levels, crosses, direction changes) Linear interpolation and histogram mode options Works on strategy tester in multi timeframe mode (at weekend without ticks also) Adjustable Levels Parameters:
OBV Timeframe: You can set the lower/higher timeframes for OBV. OBV Bar Shift: Y ou can set the offs
FREE

TeaCii Auto Fibonacci MTF is an implementation of Fibonacci Levels The indicator is simple and yet more powerful than those in the market
IMPORTANT: UNIQUE SELLING POINTS - The Levels are set automatically - You can see ANY TIMEFRAME Levels in ANY Chart. E.g. Watch H1 on M1. Watch M1 on H1 - The Levels are available in Buffers for EA Use - Helps you to get an edge early in by using multi timeframe
Parameters TimeFrame : The timeframe of the indicator. It can be same, higher or lower than t

KT COG is an advanced implementation of the center of gravity indicator presented by John F. Ehlers in the May 2002 edition of Technical Analysis of Stocks & Commodities magazine. It's a leading indicator which can be used to identify the potential reversal points with the minimum lag. The COG oscillator catches the price swings quite effectively.
MT4 version of the same indicator is available here KT COG Advanced MT4
Calculation of COG The COG indicator is consist of the two lines. The mai

HV Models is an Indicator that containes 4 methods for calculating historical volatility of the selected asset. Volatility is one of the fundamental values describing changes in the underlying asset. In statistics, it usualy describes as a standard deviation. The price chart has 4 values (Open High Low Close) when we calculate volatility using a standard indicator, only one of these values is used as a result we get one-sided volatility picture. The presented indicator uses 4 volatility ca
This indicator copies graphical objects (vertical lines, horizontal lines, text labels, fibo and etc.) from master chart to other charts.
For example, you can copy lines from the chart GBPUSD with period H1 to chart GBPUSD with period M15. It's makes technical analyses more simple. Show label - show label on the Master chart, where you draw graphical objects to copy; Font size - font size of label; Type of synchronisation - type of synchronisation Copy text - on/off copy of text objects
Copy
FREE

Market Sentiment is an indicator for MT5. Market sentiment is the feeling or tone of a market . Also called investor sentiment, it is generally described as being bullish or bearish : When bulls are in control, prices are going up . When bears are in control, prices are going down . Markets being driven by emotions, the market sentiment is about feelings whereas fundamental value is about business performance .
Settings : Range in bars : numbers of bars used for the calculation, at your own

Visit our all-new Stein Investments Welcome Page to get the latest information, updates and trading strategies. Do you want to become a constantly profitable 5-star forex trader? Then get our Stein Investments trading tools and send us a screenshot to get your personal invitation to our exclusive trading chat with 500+ members.
The Trade Manager MT5 is the ideal addition for all FX Trend users which like to use a fully automated trade management. It detects your manually opened trades imme

CAP Universal Grid EA MT5 is a highly efficient and mechanical trading strategy which has no reliance on direction, profits from volatility and uses the intrinsic wavy nature of the market. [ Installation Guide | Update Guide | Submit Your Problem | FAQ | All Products ] Easy to set up and supervise No indicators or hard analysis needed Grid trading is time-frame independent Requires little forecasting of the market Extracts money out of the market regularly
Key Features Easy to set
Description: - Chart Time + Indicator is very simple and easy, but it can be very important to control the time before opening any manual trade. This indicator shows the time in a panel between 3 different options. Can be possible to move the panel with mouse or with fixed coordinates on the chart. Input Parameters: - Local Time : Enable Local Time if you want to show it (Personal Computer Time). - Server Time : Enable Server Time if you want to show it (Broker Time). - GMT Time

RSI magic kjuta trial is the demo version of RSI magic kjuta.
Custom Indicator (RSI magic kjuta) based on the standard (Relative Strength Index, RSI) with additional settings and functions. The maximum and minimum RSI lines on the chart have been added to the standard RSI line. Now you can visually observe the past highs and lows of RSI, and not only the values of the closing bars, which avoids confusion in the analysis of trades. For example, the EA opened or closed an order, but the RSI l
FREE

Magic Finger can help you identify trends and trading opportunities clearly. The finger points to the open position signal, and the discoloration line is confirmed by the trend.
If you are a day trader, you can choose to trade during a period of active trading, referring to the discoloration line as the basis for the next order, finger signal as a filter.
If you are a trend trader, you can choose a period above H1, wait for the appearance of the finger signal in the key price area, and enter

This positions risk visualization indicators, indicators allow you to clearly know price go back will be generated how much account Loss Percent. This is very useful indicator for Controlling Risk when account is open positions, attach this indicator to the chart of the open positions, this indicator will draw three Lines, the three Line of Loss Percent default value is 10% 30% 50% user can define their own Loss Percent value. Loss Percent corresponding Back Point will show in the upper

Santa Scalping is a fully automated Expert Advisor with no use of martingale. Night scalping strategy. The SMA indicator filter are used for entries. This EA can be run from very small accounts. As small as 50 EUR.
General Recommendations The minimum deposit is 50 USD, default settings reccomend for eurusd m5 gmt +2 . Please use max spread 10 if you will not have orders change it to -1. Use a broker with good execution and with a spread of 2-5 points. A very fast VPS is required, preferably w

Индикатор RSI magic kjuta5 .
Пользовательский Индикатор ( RSI magic kjuta ) на основе стандартного Индикатора Силы ( Relative Strength Index, RSI ) с дополнительными настройками и функциями. К стандартной линии RSI добавлены линии максимального и минимального значения RSI на графике. Теперь можно визуально наблюдать прошедшие максимумы и минимумы RSI , а не только значения по закрытию баров, что позволяет избежать путаницы при анализе торгов. Например, советник открыл или закрыл ордер, но
ScalperMultiChartsMT5 is a fully automatic multi-currency trading system for night scalping. Features The Expert Advisor trades on 28 major majors and crosses , Gold, Silver . The Expert Advisor does not use risky methods The Expert Advisor uses the minimum number of input parameters available for understanding The Expert Advisor sets a fixed and hidden stop loss and take profit for all orders from the broker The Expert Advisor uses the magic number Magic to identify its orders Recommendations

The indicator displays the orders book, as well as increases its depth, remembering the location of orders that have gone beyond the current "window" view.
Indicator capability Display the levels of open positions. Simulation of placing/cancelling/editing pending orders directly in the displayed orders book.
Indicator features The orders book display works only on those trading symbols for which it is broadcast by the broker. To reset the information about the rows that were recorded in the
FREE

Matreshka self-testing and self-optimizing indicator: 1. Is an interpretation of the Elliott Wave Analysis Theory. 2. Based on the principle of the indicator type ZigZag, and the waves are based on the principle of interpretation of the theory of DeMark. 3. Filters waves in length and height. 4. Draws up to six levels of ZigZag at the same time, tracking waves of different orders. 5. Marks Pulsed and Recoil Waves. 6. Draws arrows to open positions 7. Draws three channels. 8. Notes support and re

Rental/Lifetime Package Options and Privileges * For optimum results the yearly or lifetime package is suggested due to live training !
Rent Monthly Six Months Yearly/Lifetime Weis Wave with Speed with Alert+Speed Index x x x Manual x x x Quick Set up Video x x x Blog x x x Lifetime Updates x x x Setup and Training Material
x x Free Rectangle Break Alert Tool x Discord Access Channel "The SI traders"
x 2-hour live methodology training
x
How to trade with it: http://

Idea extracted from the books by Anna Coulling and Gavin Holmes using Volume and Spread Analysis (VSA) techniques coupled with Al Brooks' expertise with Price Action these candles are magical, identify the exact moment
of the performance of the big players are acting in the market represented by the colors:
1) Red Candles we have an Ultra High activity,
2) Candles Orange we have a Very High Activity
3) Candles Yellow we have one High Activity
4) White Candles represent normal activ
FREE

Description: - We all want to have the lowest spread and never high, with this utility we can have more information and a clearer idea of when the spread is acceptable or not. The Panel InfoSpread is a utility expert advisor and shows information on different spread options in one or more symbols, can be actual spread, average, minimum, maximum and tick counter. Read and show the symbols that are in the Market Watch window. Also you can put a maximum limit of average spread in every symbol f

BeST_Darvas Boxes is a Metatrader Indicator based on the trading method developed in the 50’s by the Hungarian Nicolas Darvas . BeST_Darvas Boxes indicator draws the Top and the Bottom of every Darvas Box that can be confirmed on the current Chart draws Buy and Sell Arrows for every confirmed Upwards or Downwards Breakout of the above levels draws always only after the bar closing and so is non-repainting or backpainting it can be used as a standalone trading system/method
Inputs
Basic Sett
Automated multicurrency Expert Advisor with an unlimited number of currency pairs. In this case, it is possible to indicate on each individual currency pair how the adviser will work with it. You can add orders manually.
The expert does not have a specific strategy. Everyone chooses what features he will use. And on what indicators and on which TF to work with them.
Real account, which is fully led by an expert. MACD and Envelopes are used . Индикаторы Two Moving Average Envelopes RSI Force

The default input values are already optimized for EURUSD at time frame M1, spread at 14 and hedged account mode with leverage 1:100 and initial deposit of US$ 10,000, if you don't have this balance, I suggest you to use a CENT account. Always use the strategy tester optimization to set the best values for your assets, time frame, spread and account mode. It is very important and strongly recommended for successful trading. Optimize the input values as your needs.The EA's Strategy The Strategy T

This is a free version of the indicator, the period between the vertical lines is always 30 bars. In the paid version the period can be set by user, so a configuration with many ThreePointsChannel indicators with different periods is possible.
The principle of construction - on top of any number of bars set by the user, a channel is constructed with maximum and minimum lines so that the bars touch the maximum and minimum of the channel at exactly three points. The name of the indicator follows
FREE

This is a free version and is forecasting only 5 bars The FourierExtrapolationMAFree indicator transforms and extrapolates the Moving Average function by the Fast Fourier Transformation method.
1. The transformation period is set by two vertical lines, by default the first blue line and the second pink.
2. By default, the Moving Average (MA) line is drawn in red.
3. By Fourier Transform, the indicator builds a model of N harmonics, which is as close as possible to the MA values. The model
FREE

The Advanced Trend Scalper MT5 indicator is designed to help both novices and professional traders. The indicator analyses the market and gives you buy and sell signals. It does not use any other indicators, it works only with the market actions. The signal appears right after the candle close and it does not repaint. The efficient algorithm provides a high degree of reliability of such signals. Advanced Trend Scalpe r for the MetaTrader 4 terminal : https://www.mql5.com/en/market/product/

Описание стратегии:
Набор торгуемых валютных пар: GBPUSD, GBPAUD, GBPCAD, GBPJPY, EURUSD, EURGBP, EURAUD, EURCAD, EURJPY, AUDUSD, AUDNZD, AUDCAD, AUDJPY, NZDUSD, NZDCAD, USDCAD, USDJPY
В момент открытия рынка после выходных, определяется на каких парах из списка цена прошла от открытия до закрытия недельной свечи более 2000 пунктов и открываем позицию в противоход недельному движению с целью забрать откат в 500 пунктов. Стоп не ставится.
Если цена пошла против позиции, то через кажды
FREE

Weiss Wave with lots of functionality and lightweight. The same can be used both in markets that have access to volume (REAL=Contracts, Tick=Business) or points!
You will be able to:
- Analyze the volume of the market by swings made!
- Define the source of the data presented in the graphic, its size and color! Or simply hide this information!
- Define whether or not to show the swings in the graph and how many swings! In addition to setting the trend line color, thi

It's demo version of Auto StopLoss Defender , you can buy on page - https://www.mql5.com/ru/market/product/33106 or extended version of the program is Auto StopLoss Premium , you can set stoploss and takeprofit - https://www.mql5.com/ru/market/product/33111
Demo restrictions: Stop-loss 0.10% for new order.
While you are trading, Auto StopLoss Defender doing all the routine work. "Must have" for scalping. Best way to save account balance in case of force majeure.(Internet connection lo
FREE

Japanese candlestick analysis has been in existence for hundreds of years and is a valid form of technical analysis. Candlestick charting has its roots in the militaristic culture that was prevalent in Japan in the 1700s. One sees many terms throughout the Japanese literature on this topic that reference military analogies, such as the Three White Soldiers pattern Unlike more conventional charting methods, candlestick charting gives a deeper look into the mind-set of investors, helping to establ
FREE

Binance MT5 is a tool for charting & manual trading Bitcoin and Altcoin on Binance Spot Market from MT5 platform. Support all order types: Limit, Market, Stop-Limit and Stop-Market .
Parameters Symbol = symbol name HistoryData = start time to download history data API Key = your binance api key Secret Key = your binance secret key
* You should allow WebRequest from Tools menu >> Options >> Expert Advisors and add URL: https://api.binance.com * For automatic tradin
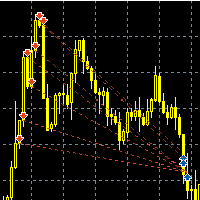
Название советника : Survivor (есть расширенная версия: https://www.mql5.com/ru/market/product/36530 ) Валютные пары : USDJPY, EURUSD, GBPUSD, AUDUSD, GBPJPY, XAUUSD, EURCHF Рекомендованная валютная пара : USDJPY Таймфрейм : М5 Время торговли : круглосуточно Описание : Трендовый советник с возможностью мартингейла и построением сетки ордеров. В советнике используются три группы аналогичных сигналов для открытия, закрытия и дополнительных сделок. При наличии тренда(определяется МА) ловится отс
FREE
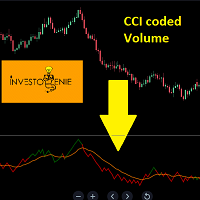
The Indicator is based on Commodity Channel Index (CCI) coded on Volume. The concept is to try and analyze the movement of Volume and Price in a certain direction
Concept:
If the Price of the indicator moves below the threshold price, it turns RED indicating the direction downwards is getting strong.
If the Price of the indicator moves above the threshold price, it turns GREEN indicating the direction upwards is getting strong.
The moving average acts as a great filter to decide entry/exi

The "Sniper MACD" indicator is an enhanced version of the classic MACD indicator, optimized using several methods to achieve maximum trading efficiency. This indicator features additional filtering and multiple levels of smoothing, allowing for more accurate signals. Key Features: Additional Filtering: Extra filtering has been implemented to improve signal quality, helping to avoid false signals and increase forecasting accuracy. Multiple Smoothing: The indicator has been smoothed multiple time
FREE

Trailing Stop Universal MT4 / MT5 utility is a multifunctional tool for protecting floating profit on open positions and reducing possible risks in trading. To realize these goals, the tool offers the user the following features. Breakeven function - transfers a position to breakeven when the profit of the position allows it. If this function is enabled and the conditions of its operation are met, it moves the StopLoss order to the opening price of the position or even to the profitable

Day Channel The indicator draws a channel built on the extremum levels of bars from the older period set in the settings, and also displays the level of closing prices. For the indicator to work correctly, the current period for which the indicator will be set must be less than the specified period in the indicator settings. Description of indicator settings: TimeFrame - selection of a period for plotting indicator levels. By default, the daily chart period is set. LevelClose - enable or disab

The Alert Arrows RVI indicator is an advanced version of the Relative Vigor Index (RVI) indicator, enhanced with alert arrows functionality. It has the ability to identify potential support and resistance levels, providing traders with valuable insights into market dynamics. Key Features: Alert Arrows: Alert arrows have been integrated into the RVI indicator, offering visual cues for potential trading opportunities. Additional Filters: Two additional filters have been incorporated to enhance ind
FREE

Moxie 5 Moxie 5 is an intraday trading system that makes profits from short-term price movements. EA is optimized for multiple currency pairs. Optimized parameter files are installed in the product news. You can see the statistics of the advisor for different brokers on various instruments in the section Trading Signals for MetaTrader 5 . There is the possibility of including martingale, which requires special care. Options Management of risks: enter allotted funds - (<=0-OFF, <=2.0 - coeff

The principle of construction - on top of any number of bars set by the user, a channel is constructed with maximum and minimum lines so that the bars touch the maximum and minimum of the channel at exactly three points. The name of the indicator follows from this principle. Both vertical lines can be moved along the graph by the user, thus specifying the period on which the channel is built. After a specified period, channel rays are drawn that define a channel in which the price can move.

Pivots Points are significant levels traders can use to determine directional movement, support and resistance. Pivot Points use the prior period's high, low and close to formulate future support and resistance. In this regard, Pivot Points are predictive and leading indicators. Pivot Points were originally used by floor traders to set key levels. Floor traders are the original day traders. They deal in a very fast moving environment with a short-term focus. At the beginning of the trading day,

Deposit Supercharger: Optimized Trend Indicator This indicator is based on three technical analytical indicators and two filters, providing more accurate signals. Description: Technical Indicators: The indicator is based on three technical analytical indicators that help determine the trend direction and possible reversal points. Filters: To filter signals, price highs and lows for the past two days (support and resistance levels) are set, as well as a volume indicator, improving signal qualit

The FourierExtrapolationMA indicator transforms and extrapolates the Moving Average function by the Fast Fourier Transformation method.
1. The transformation period is set by two vertical lines, by default the first blue line and the second pink.
2. By default, the Moving Average (MA) line is drawn in red.
3. By Fourier Transform, the indicator builds a model of N harmonics, which is as close as possible to the MA values. The model is drawn by default in blue over the MA for the period bet

This indicator uses VWAP and projects this VWAP into up to 3 levels, shifted by a percentage of the chart's symbol.
How to configure: Choose the symbol and desired graphic time Set the start time of the symbol (in bovespa, WIN and WDO start at 9 o'clock). This time is used as the cutoff reference for VWAP. Check which VWAP period fits the chart better: Ideally, a period when VWAP is not too distant from the chart Set percentage levels: Ideally, you should set levels based on history, so that l

It is is your personal risk guard. Drop it on any chart on your VPS or trading computer and it will guard your total risk in any pair or asset and make sure the sum of all stops is within your risk. If you happened to exceed the risk, in a split second this EA will calculate the exact position for the combined risk of all open positions and place all stops at the exact same spot. If you open a new position with another lot size . No problem, all stoplosses will automatically adjust. Tired of man
FREE

I recommend you to read the product's blog (manual) from start to end so that it is clear from the beginning what the indicactor offers. This multi time frame and multi symbol indicator identifies double or triple top/bottom formations or a following neckline breakout (confirmed top/bottom). It offers RSI, pin bar, engulfing, tweezer, morning/evening star filters as well divergence filter options which makes it possible to filter out only the strongest setups. The indicator can also be used

Currency RSI Scalper MT5, popüler Relative Strength Index (RSI) göstergesine dayalı profesyonel bir göstergedir.
RSI göstergesi piyasanın belirli bir aralığı için iyi çalışmasına rağmen, piyasa koşulları değiştiğinde karlı sinyaller üretememekte ve dolayısıyla yanlış sinyaller üreterek büyük kayıplara neden olmaktadır.
Piyasa koşullarına göre kendini uyarlayan uyarlanabilir bir RSI göstergesi hakkında hiç düşündünüz mü?
Sunulan gösterge, en iyi aşırı alım ve aşırı satım seviyelerini bulan

I recommend you to read the product's blog (manual) from start to end so that it is clear from the beginning what the indicator offers. In addition to finding bullish and bearish Three line strike formations this multi symbol and mutli time frame indicator can also scan for the following candlestick patterns (please see screenshots for explanation of the patterns): Three white soldiers (reversal>continuation pattern) Three black crows (reversal>continuation pattern) The formations do not ap
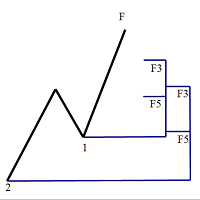
Fibonacci Expansion and Retracement PRO
Fibonacci retracing and extended line tools for the MT5 platform, ideal for traders who use the Golden Section trading Demo: https://www.mql5.com/zh/market/product/35884 The main function:
1. You can draw multiple sets of Fibonacci retracements directly, and the relationship between important return points is clear at a glance.
2. Can draw Fibonacci extensions
3. The Fibonacci foldback and extension of the line can be moved left and right for eas

Introduction This indicator detects volume spread patterns for buy and sell opportunity. The patterns include demand and supply patterns. You might use each pattern for trading. However, these patterns are best used to detect the demand zone (=accumulation area) and supply zone (=distribution area). Demand pattern indicates generally potential buying opportunity. Supply pattern indicates generally potential selling opportunity. These are the underlying patterns rather than direct price action. T
FREE
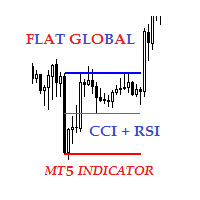
Description The indicator of local flat for CCI and RSI indicators. Users can select financial instruments. The indicator allows to find local flats in the following options: Width of channels that is not more than certain range Width of channels that is not less than certain range Width of channels that is not more and not less than certain range The indicator displays the middle and boundaries of the channel.
Purpose
The indicator can be used for manual or automated trading within an Exper

While you are trading, Auto StopLoss Premium doing all the routine work. "Must have" for scalping. Best way to save account balance in case of force majeure.(Internet connection loss, power outage, sharp change in price direction) The Utilite automatically adds a stop loss to open and pending orders that have no stoploss set. Also adds a take profit. The anti-requote system is built into the Utilite. That means the stop loss will be registered anyway! In the settings you can set any stop los

Introduction To Time Box Indicator Time Box Indicator is a must have indicator for any trader. It will display daily, weekly and Monthly box according to your preferences. Yet, you can extend any important price levels in your chart automatically. You can use them as the significant support and resistance levels. It is very simple but effective tool for your trading.
Graphic Setting Use White Chart Line Style for Current Open price
Daily Setting Update Timeframe for daily box Number of days
FREE

Introduction
Auto Chart Alert is a convenient tool to set alert for your trading in your chart. With Auto Chart Alert, you can set the alert line in one click in your desired location in your chart. You can even set alert over the sloped lines in your chart. Auto Chart Alert is a great tool when you have to watch out importnat support and resistance levels for your trading. You can receive the sound alert, email and push notification when the price hit the alert line at you desired location. A
FREE

Introduction This indicator detects volume spread patterns for buy and sell opportunity. The patterns include demand and supply patterns. You might use each pattern for trading. However, these patterns are best used to detect the demand zone (=accumulation area) and supply zone (=distribution area). Demand pattern indicates generally potential buying opportunity. Supply pattern indicates generally potential selling opportunity. These are the underlying patterns rather than direct price action. T
The utility is entended for preparing information for the Sprint EA . Preparing information for different financial instruments needs the EA to be attached to a chart of the corresponding financial instrument. The EA prepares information in online mode only. Input Parameters Symbol Name - name of financial instrument of the chart the EA is attached to. Connection Control - control of disconnections with the trade server: true - enable. false - disable. Send Mail - send an e-mail notification abo
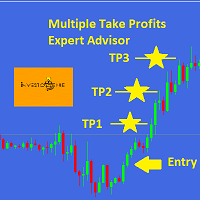
This EA is designed for MULTIPLE TAKE PROFITS options based on User's order management.
ABOUT EXPERT ADVISOR:
The expert advisor is designed to help user take multiple profits on single order. The multiple take profits can be allocated a fixed percentage based on user's preferences. The user is required to set an entry level in price and set target percentages and target prices. The stop loss and price to close options helps user in risk management.
ADVANTAGES:
Option of Taking Profits

While you are trading, Auto StopLoss Defender doing all the routine work. "Must have" for scalping. Best way to save account balance in case of force majeure.(Internet connection loss, power outage, sharp change in price direction) The Utilite automatically adds a stop loss to open and pending orders that have no stoploss set. The anti-requote system is built into the Utilite. That means the stop loss will be registered anyway! In the settings you can set any stop loss begin from 0.0001 (If yo

This positions risk visualization indicators, indicators allow you to clearly know how much price go back will be generated account Stop Out. This is a very useful indicator for Controlling Risk when account is open positions, attach this indicator to the chart of the open positions, the indicator will draw a Line Of Stop Out Price on the chart, and output Stop Out Point Value in the upper left corner. Stop Out Price can give you clearly know what price is Account Stop Out, can giv
MetaTrader Mağaza, geliştiricilerin ticaret uygulamalarını satabilecekleri basit ve kullanışlı bir sitedir.
Ürününüzü yayınlamanıza yardımcı olacağız ve size Mağaza için ürününüzün açıklamasını nasıl hazırlayacağınızı anlatacağız. Mağazadaki tüm uygulamalar şifreleme korumalıdır ve yalnızca alıcının bilgisayarında çalıştırılabilir. İllegal kopyalama yapılamaz.
Ticaret fırsatlarını kaçırıyorsunuz:
- Ücretsiz ticaret uygulamaları
- İşlem kopyalama için 8.000'den fazla sinyal
- Finansal piyasaları keşfetmek için ekonomik haberler
Kayıt
Giriş yap
Gizlilik ve Veri Koruma Politikasını ve MQL5.com Kullanım Şartlarını kabul edersiniz
Hesabınız yoksa, lütfen kaydolun
MQL5.com web sitesine giriş yapmak için çerezlerin kullanımına izin vermelisiniz.
Lütfen tarayıcınızda gerekli ayarı etkinleştirin, aksi takdirde giriş yapamazsınız.